

-
To visualize the best model performance, click the best ensemble as determined automatically by ADMET Modeler.
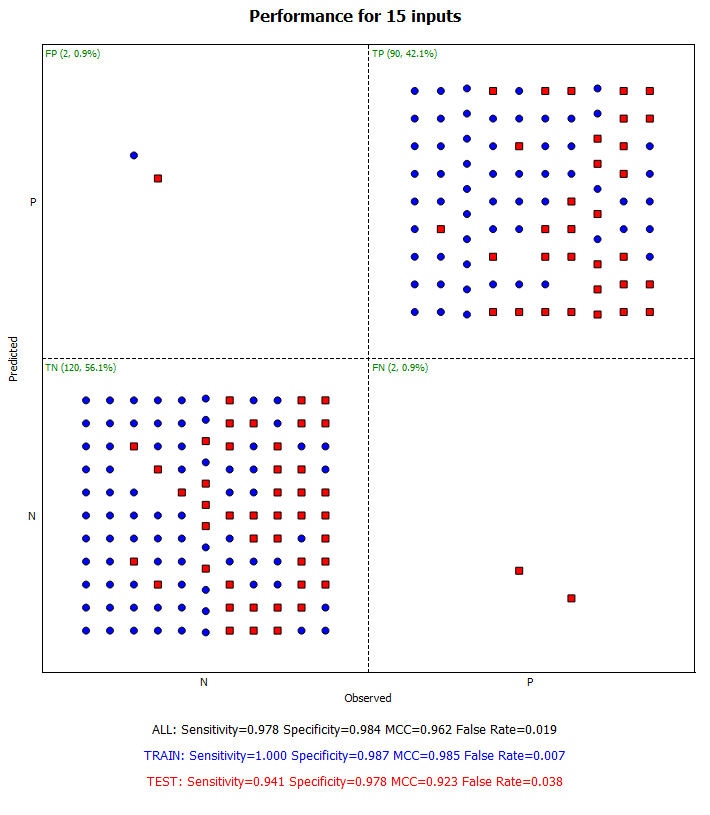
The Performance Viewer window opens. The performance statistics for the selected ensemble are displayed below the performance graph. Note that the Y axis is the Predicted axis and the X axis is the Observed axis.
-
Inspect the model performance and note that the performance is satisfactory.