1. ADMET Predictor's Interface
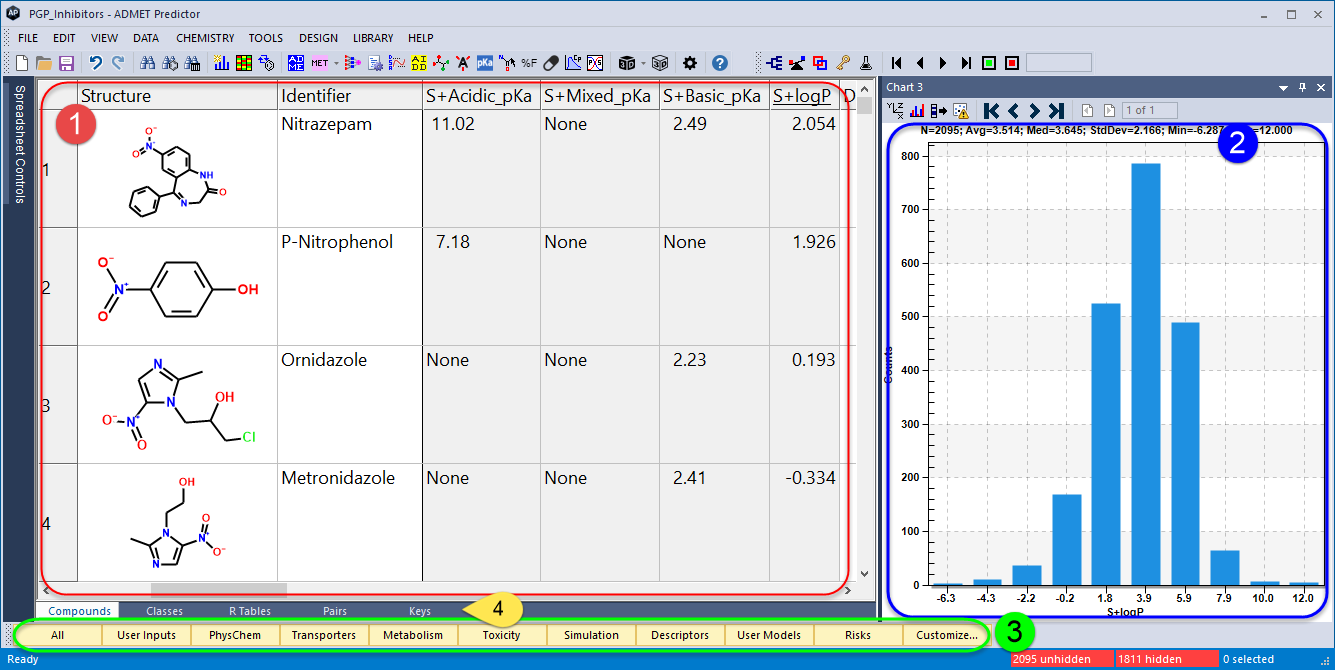
The main window in ADMET Predictor is split into a spreadsheet pane (1) and one or more independently dockable chart panes (2). The spreadsheet pane has a row of buttons along the bottom (3) for limiting display to particular Attribute Groups, but it also has four base tabs (4) that allow you to shift between the various data views described below. In the Compounds tab (selected in the example shown here), each row represents an individual compound.
The views displayed by clicking on the other three tabs show how compounds relate to each other - how they can be grouped into Structural Classes, displayed in R-Tables or as Molecular Pairs.
These alternative views are available to users who have licensed the MedChem Studio module. If your site has a MedChem Studio license and the tabs are a serious distraction, they can be hidden by using VIEW >> MedChem Features.
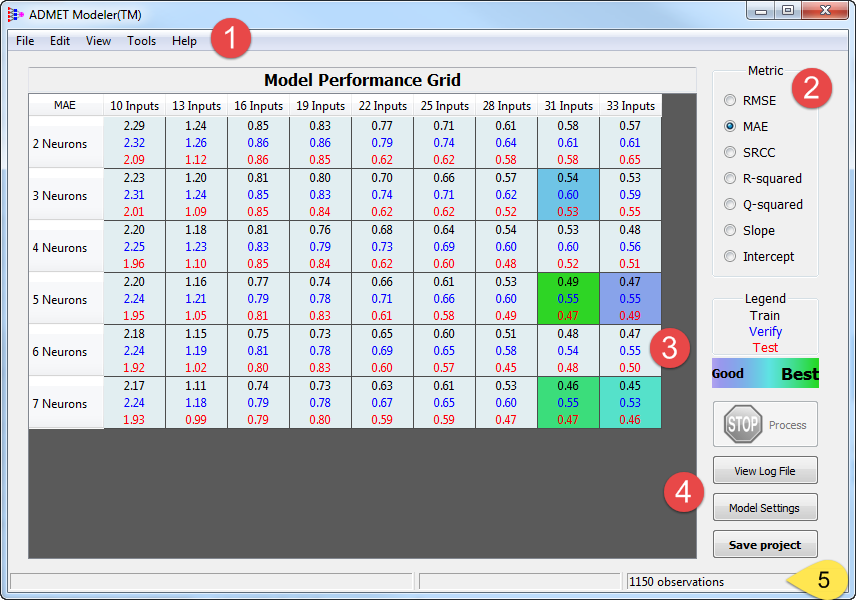
ADMET Modeler has its own free-standing user interface. The performance grid below shows the results page for a regression model built from intrinsic clearance (CLint) data for human liver microsomes (HLM). It includes a menu bar (1) and a set of radio buttons (2) that control the displayed performance metric, as well as an interactive grid (3) of ensemble architectures that display the selected performance metric for the training, verification and test sets. Color-coding of the cells in the grid highlights those architectures that exhibit particularly good overall performance. Clicking on any cell in the grid lets you delve more deeply into model performance by way of a graphical analysis tool. Several control buttons are provided in the lower right corner of the page (4), and a status bar (5) runs along the bottom.
Part[ 3] contains a detailed discussion of the workflow and theory behind ADMET Modeler, which is licensed separately from the MedChem Studio and ADMET Property modules.