

Model Performance with Confidence Analysis
-
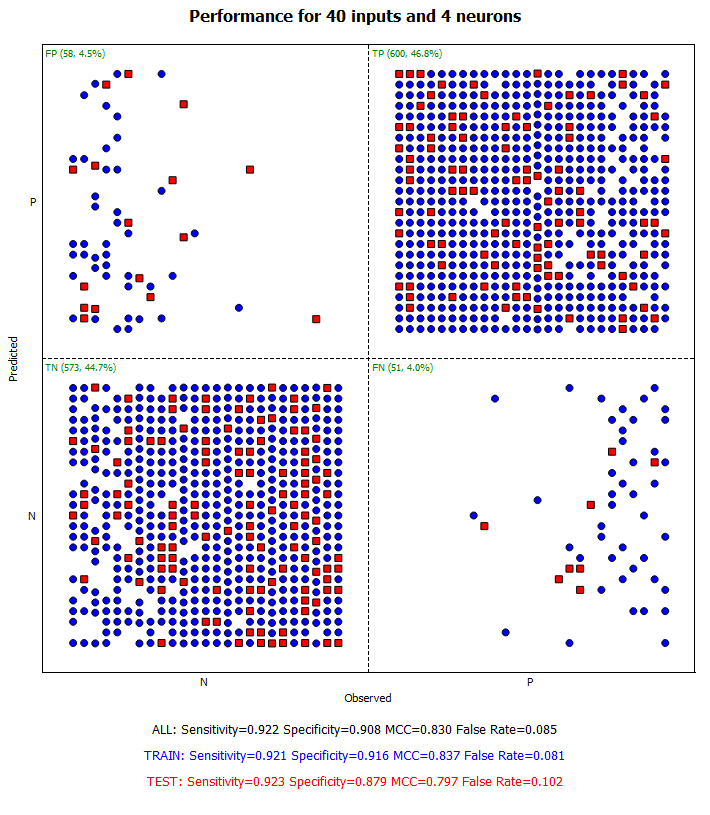
To visualize model performance, in the Model Performance Grid, click on the best (green) ensemble as determined automatically by ADMET Modeler. The Performance Viewer window opens.
-
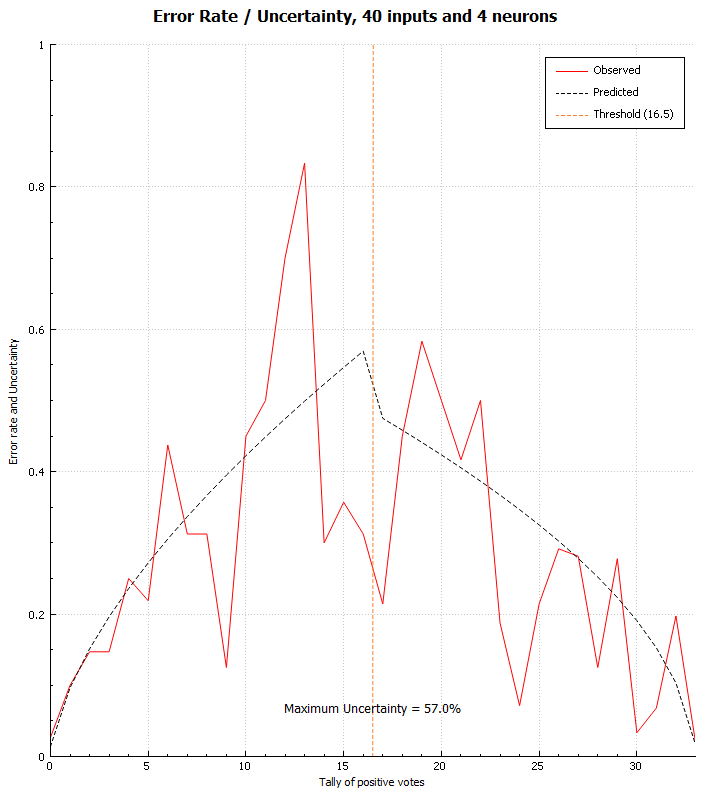
Click the Confidence Analysis (CFA) radio button in Plot type area, in the right top corner of the window. The Confidence Analysis Viewer appears, as shown in the Figure below.
-
Inspect the model's confidence plot and compare it with other top performing models.
The default Error Rate / Uncertainty plot shows the actual error rate as a function of the ensemble's positive (P class) votes in a solid red line. For example, if all votes point to a negative class, then such a prediction is deemed very confident. The black dashed line is the corresponding probability distribution function determined from the training data. The vertical line illustrates the optimal vote threshold separating the negative (N) and positive (P) predicted classes. Maximum uncertainty corresponds to the maximum of the probability distribution curve. Generally, models with maximum uncertainty (or minimum confidence) between 40% - 60% are recommended as statistically stable.
-
Click the Prediction and error distributions radio button in the Analysis types area.
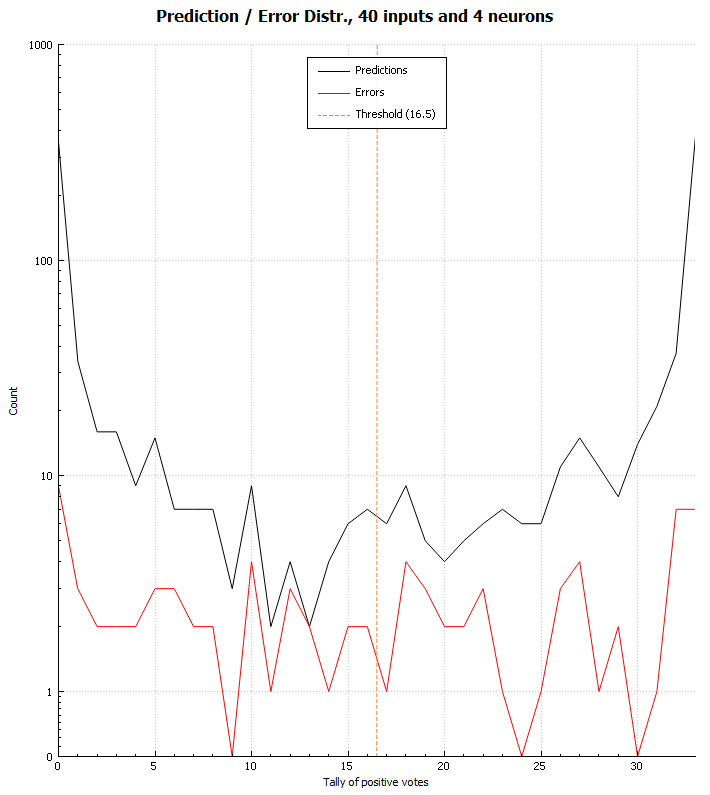
The Prediction / Error Distribution plot, as shown in the Figure above, replaces the previous view. In the new plot, the black solid line shows the actual distribution histogram of all P/N predictions as a function of the ensemble's positive votes, while the solid error line shows the same histogram for erroneous predictions. In particular, the high frequency of predictions with 0 votes on the left illustrates there are many cases where the model is confident (because all votes point to a negative class) that the predicted class is negative. Similarly, the high frequency at 33 votes on the right illustrates the model's confidence for these positive class predictions. Please note that the vertical axis is logarithmic.
NOTE: For detailed information about the indicated topic, see the referenced chapters, section, and/or appendices in the ADMET Predictor User's Manual:
* -* Performance Plots
* -* Confidence Analysis
* *