

3.4.4. Kohonen Mapping
Our preferred way to partition data sets into a training pool and a test set focuses on selecting a good training pool. It works by clustering the data set in the descriptor space using Kohonen self-organizing feature maps, then drawing representatives from each cluster in a form of stratified sampling by structure. We use our molecular descriptors to train trained on structural descriptors. In our implementation, the map is a toroidal grid that by default should be made up of roughly as many cells as there are observations in the data set. If there are 1,000 compounds in the data set, for instance, the default Kohonen map will be 31×31 and contain 961 cells. If the grid were 32×32, it would consist of 1024 cells and some would necessarily be empty.
It is important to note that the Kohonen mapping process does not involve the measured property – only the descriptors. The figure below is a two-dimensional projection of a Kohonen map built using structural descriptors for 351 compounds with measured permeability in MDCK cells. The actual map has a toroidal topology, so cells along the top edge are adjacent to those along the bottom edge and those along the right edge are adjacent to those along the left edge. If you printed the map on an elastic sheet, you could cut it out and roll it into a tube. Stretching the ends of the tube around and connecting them to make a doughnut would recapture the underlying topology.
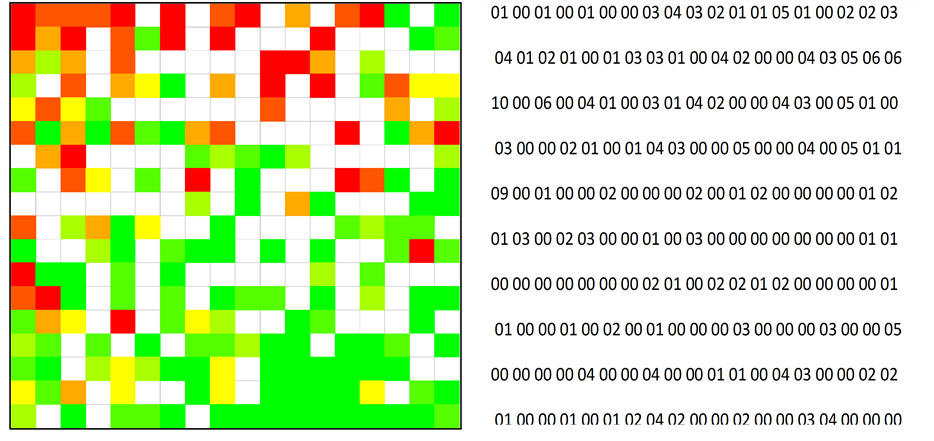
After the map was completed, it was colored to show the average permeability for all compounds in each cell with green indicating the highest permeability group and red indicating the lowest permeability group. White cells are empty. Although permeability had nothing to do with the mapping process, it is clear that the map has regions of low and high permeability that are related to the descriptor values (hence molecular structure similarity) in the cells.
Each cell in the above map can be regarded as a cluster of chemically similar compounds. The number in each cell indicates how many compounds are in the cluster. Cells with zero values have no compounds assigned to them, and they effectively serve to separate other clusters containing dissimilar compounds from each other. ADMET Modeler also provides a separate output file (.som) detailing which compounds are in which cell for further analysis, if desired.
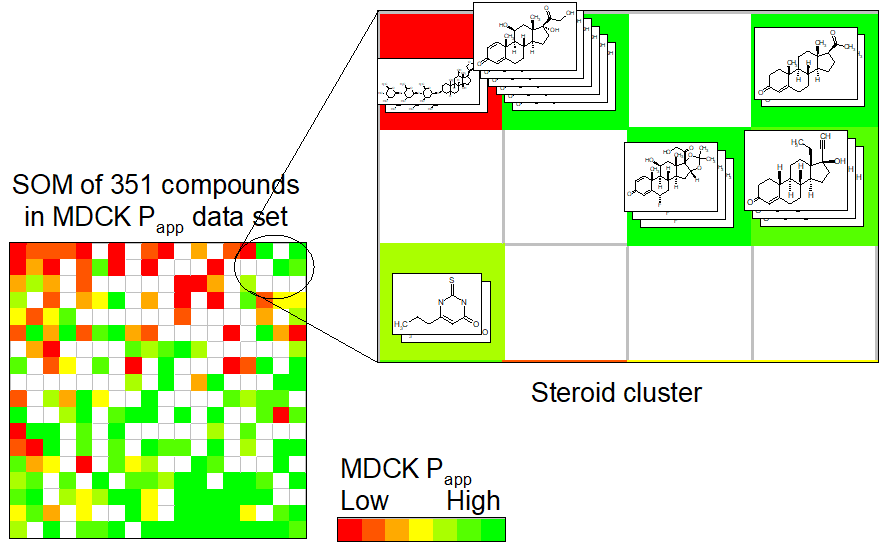
The ability of the Kohonen mapping process to cluster compounds into cells of similar structure provides a useful tool in ADMET Modeler. The figure below shows one particular region of the map made up of adjacent cells that all contain steroids.
Map construction
The Kohonen map is generated in the following way:
-
Autoscale all descriptor values that passed the initial filtering.
-
For each cell in the map, generate a set of random weights for each cell that is equal to the number of descriptors.
-
For each compound, compare the values of each of its actual descriptors to the corresponding weights in each of the cells to find the cell with the closest set of weights based on Euclidean distance.
-
Put the compound into that cell, and adjust the cell weights to be closer to the values of the compound.
-
Repeat this process for all compounds.
Step 2 – 5 comprise an “epoch.”
Processing proceeds in two stages. Each round consists of many epochs. In the first stage (Phase I), the number of compounds in adjoining cells is also adjusted, but not by as much. In the second stage (Phase II), only the cell with the closest set of weights is adjusted.
Once the Kohonen map has been completed, the cells will contain different numbers of compounds. Some may have no compounds; others may have multiple compounds. In any cell with more than one compound, the descriptors of those compounds will be somewhat similar in value, so the molecules might be expected to have similar structures.
Sampling the cells
The final step is to use the Kohonen map to select the training pool. This is done by taking a compound from each cell that contains at least one compound and putting it into the “training set”. For every remaining cell that contains at least one compound, take one compound and put it into the verification set. All remaining compounds are assigned to the test set. This initial assignment of molecules to training and verify sets are then randomly shuffled as part of the generation of the first random fold of the ensemble.
The ratio of training set to verify set size resulting from this procedure is typically around 2:1, the ratio that is used when randomly selected training pools are split.
The number of compounds in test sets generated from Kohonen maps can be quite high and usually exceeds the minimum required (10% by default) fraction of the data set. If it does not, compounds from the training pool are selected at random and reassigned to bring the test set size up to the required level.
NOTE: The Kohonen mapping process involves random starting weights and is order dependent. Hence if you rerun a particular data set with a different random number seed or after reordering the compounds, you are likely to end up with different Kohonen maps, though the compounds will generally be clustered in similar ways.