7.3.1. Plots
-
Open the Demo2D.smi file from the ADMET Predictor application directory file and generate the ADMET Predictor predictions as described in the tutorial Interactive Input: SMILES.
-
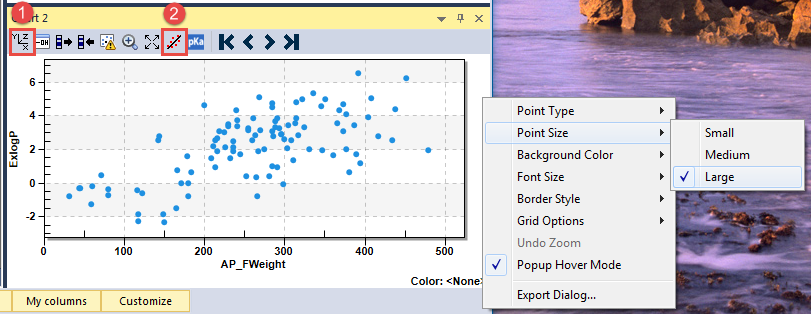
On the right hand side there are two panes, one with a histogram (top pane), and one with a 2D scatter plot (bottom pane). In the bottom pane, right click in the plot area to display the context menu. Select Point Size >> Large to make data points more visible.
-
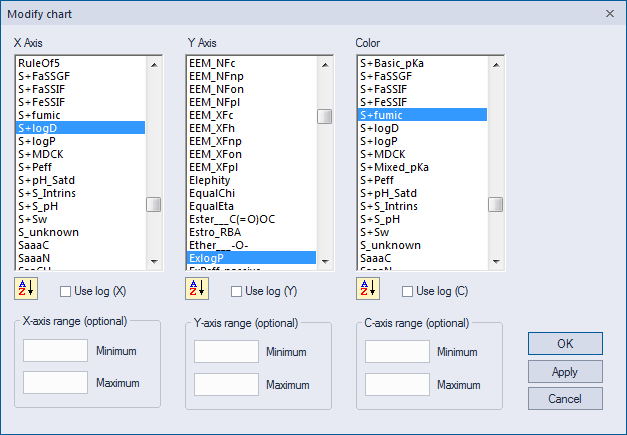
Change properties for the axis and the color by clicking on Modify chart (1). Select S+logD for X Axis, leave ExlogP for Y Axis, and select S+fumic for the Color. Click OK.
-
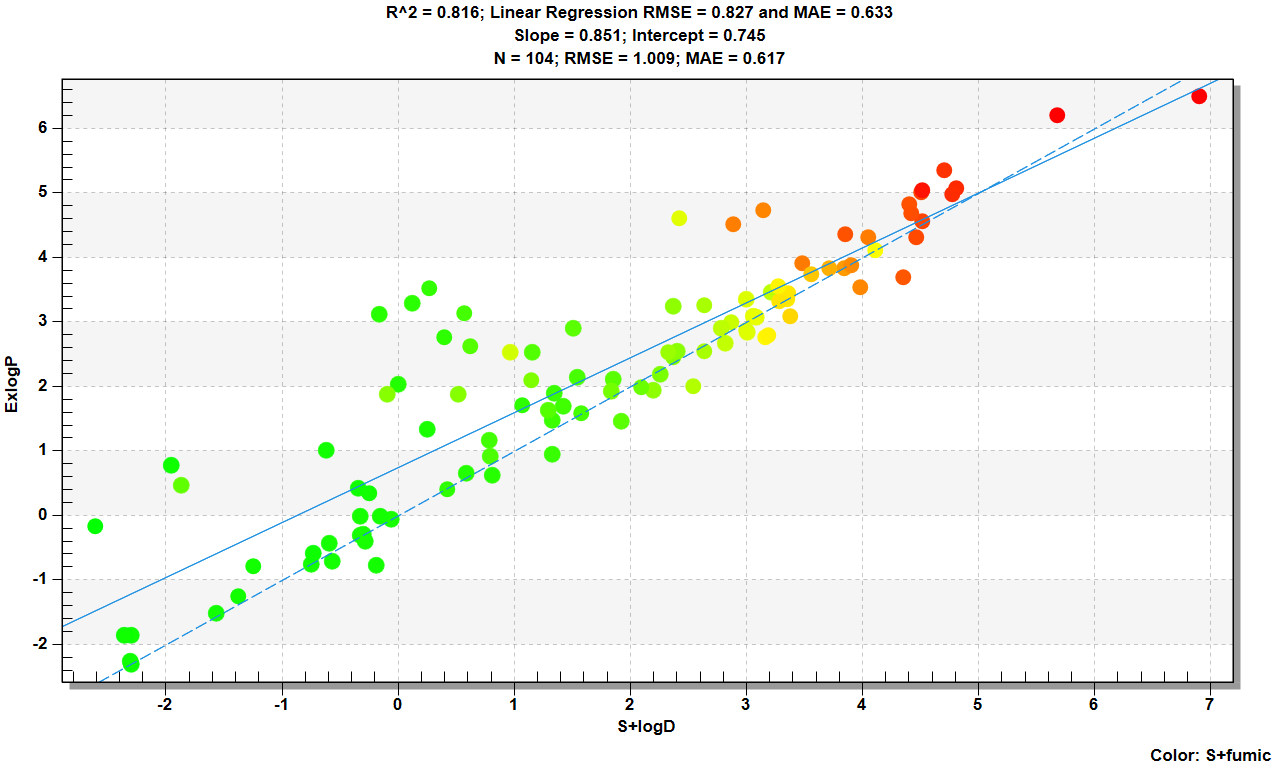
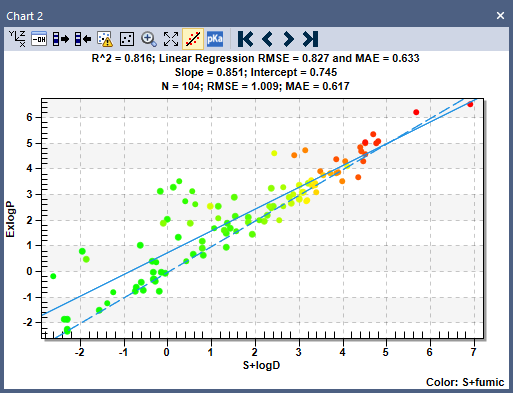
Click on icon Linear fit (2) to display the regression line and the statistics.
-
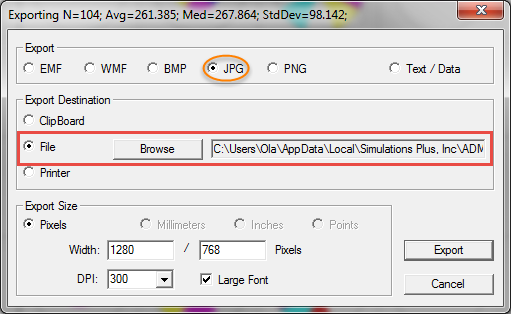
Right click inside the plot area to bring up the context menu and chose Export Dialog.... The Exporting dialog opens. For the export file type keep the default .JPG.
-
In the Export Destination area, check File, then click Browse, select the destination path and type the name of the file, for example MyScatter2D.jpg.
-
The exported image can be viewed in any image viewer, e.g. Windows Live Photo Gallery like the figure below.