

7.3.3. Special Plot: pKa Performance Graph
-
Open the SAMPL6_pKa.smi file from the ADMET Predictor application directory file and generate the ADMET Predictor predictions as described in the tutorial Interactive Input: SMILES. This file contains compounds and experimental pKa data used in SAMPL6 competition (Isik 2021) of the pKa predictive models.
-
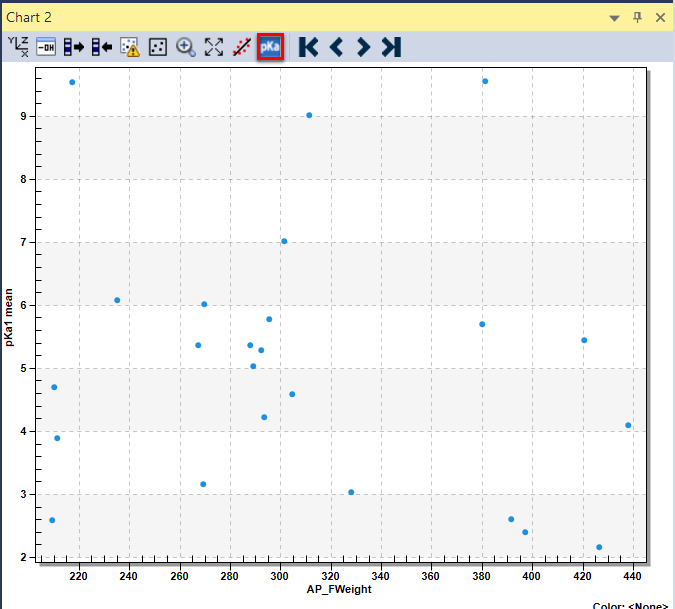
Expand the 2D scatter plot (Chart 2, bottom pane) on the right side. Click the pKa button outlined below in red
-
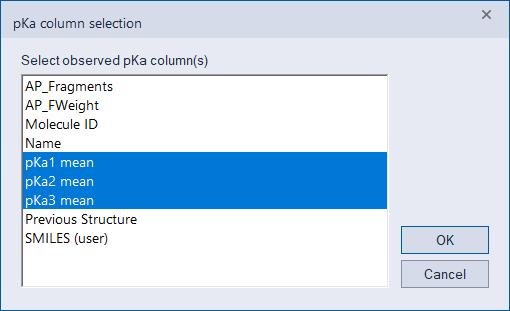
In the new dialog box press the Ctrl button and select experimental pKa named "pKa1 mean", "pKa2 mean", and "pKa3 mean". Click OK.
-
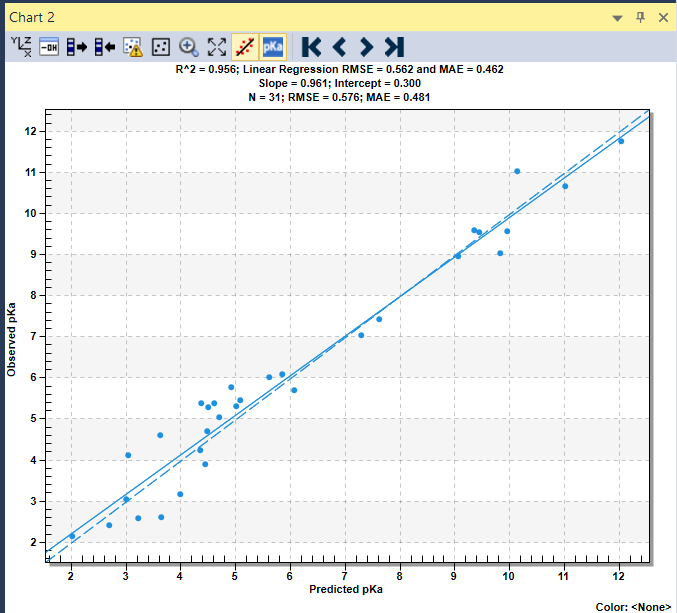
Click the Linear Fit button. You should see the "Predicted pKa" (by the S+pKa model) vs. "Observed pKa" plot along with performance statistics.
-
Use Export... dialog to export the matched predicted and observed pKa.
NOTE:
For detailed information about the indicated topic, see the referenced chapters, section, and/or appendices in the ADMET Predictor User’s Manual:
-
The science of multiprotic ionization, last paragraph about pKa matching.