

2.13.1. Subtleties of Multiprotic Ionization
The following is excerpted with minor modifications from the supporting information for Fraczkiewicz et al. (2015):
Best of Both Worlds: Combining Pharma Data and State of the Art Modeling Technology to Improve In silico pKa Prediction
For theory behind the ASPA and ASP profiles as well as pK50 values see Fraczkiewicz 2023:
pK50─A Rigorous Indicator of Individual Functional Group Acidity/Basicity in Multiprotic Compounds.
The science of multiprotic ionization
Many pharmaceuticals and agrochemicals of current interest are multiprotic and have complex dissociation patterns. There are many significant issues that arise from this fact, as has been discussed elsewhere. (Rupp 2011; Fraczkiewicz 2013; Fraczkiewicz 2025b)
One of the important consequences of the science of multiprotic ionization negates often assumed point of view in which ionization events observed in standard titration experiments can always be “assigned” entirely to individual ionizable groups. In reality, a compound with n ionization sites exists in solution as a collection of 2n ionization states called microstates (or microspecies). Each pair of related microstates differing by one proton is connected by an elementary chemical equilibrium characterized by an ionization microconstant. This fact has been noted already in the early 20th century, (Bjerrum 1923) has a solid theoretical basis (Noszal 1986; Szakacs 1999) and has been confirmed by numerous experiments. It is crucial to have a clear intuitive understanding of the microstate distribution. The “2n” number simply represents all possible combinatorial distributions of dissociable protons, ranging from 0 to n, among n sites. Each of the microstates can be enumerated by a binary vector of length n, e.g., (0,0,1,0,1,1,…,1), where 1 and 0 indicate presence and absence of a proton, respectively, at the site. In the simplest case of n=2 one would have the following microstates: (0,0), (0,1), (1,0), and (1,1).
For n=10 the number of microstates is 1024, which makes it easy to understand why it is virtually impossible to determine the complete microscopic ionization scheme of multiprotic molecules experimentally (Szakacs 1999). Standard spectroscopic and potentiometric titration experiments only “see” changes in the overall molecular charge states, i.e., the macrostates. This yields up to n apparent pKa’s (macroconstants). Determination of microstates populations requires more specialized experimental techniques than those that are routinely employed (Szakacs 1999; Mernissi-Arifi 1995; Peinhardt 2001; Szakacs 2004; Tam 2000). Such work is being done nonetheless, particularly by Hungarian chemists, and it has been successful succeeds in certain relatively simple cases.
One of the recent such reports took aqueous ionization of cetirizine (an anti-allergy drug known in the USA under the name ZYRTEC™) as its subject (Marosi 2009). Knowledge of all the microconstants provides a great deal of useful information about the protonation microstates, such as their relative contributions to the corresponding macrostates as well as, for a given microstate, the relative probability of dissociation for each of its attached protons. A review of the published experimental data shows that the occurrence of multiple microstates with comparable contributions is actually quite common. The view of multiprotic ionization occurring sequentially (i.e., one ionizable group at a time) is seriously misleading in such cases.
The observed macroconstants for cetirizine (2.10, 3.01, and 8.17) are complex mathematical functions of the relevant microconstants and are assignable only to transitions between the various net charge states of the cetirizine molecule, i.e., H3Cet+2, H2Cet+, and HCet. For example, the neutral macrostate bearing the zero net charge (HCet0) is strongly dominated (99.1%) by a zwitterionic microstate wherein the piperazine nitrogen distal to the aromatic rings is protonated. No such dominance exists, however, for the +1 macrostate where two different microstates make nontrivial contributions of 64.8% and 34%.
The ambiguities described above make direct modeling of macroconstants from chemical structure difficult at best. Some models have been constructed in that way, but their range is necessarily limited in most cases to, e.g., narrow chemical classes. However, a global predictive model of protic ionization built this way is likely to be limited in its accuracy and scope.
The figure below provides a detailed view of the experimentally determined macroscopic (in the left column) and microscopic (in the right column) dissociation constants compiled from the recently published data reported for cetirizine (denoted here by “M”) by Marosi et al. (2009). Black percentage numbers next to microstates illustrate relative contribution (probability) of this microstate to its parent macrostate. Red numbers along the reaction arrows are ionization microconstants.
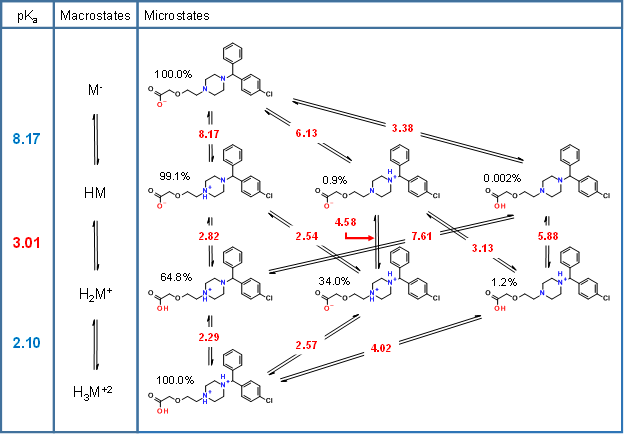
Figure 1.
In contrast to macroconstants, microconstants are properties of individual groups and depend directly on the structure of the microstate involved. Therefore, microconstants are natural candidates for use in QSPR modeling. The problem is that microconstants are also functions of the molecular environment. For example, the basicity of the distal nitrogen in cetirizine strongly depends on the protonation states of the other two groups (Figure 1). Molecular descriptors must be sophisticated enough to take this fact into account.
Since there could be multiple measured (by standard titration) as well as predicted apparent pKa values per compound, matching one vs. the other poses a special challenge. Having m measured and p predicted values there are p*m ways of matching the two sets! Which one is correct? We have addressed this issue in our article (Fraczkiewicz 2013): The only scientifically valid method must use the following optimal matching algorithm: 1) Order both sets in the same order (e.g., descending order corresponds to subsequent protonation events); 2) Try all possible matchings while preserving order of both sets; 3) Pick the matching with smallest predicted-observed absolute deviation. ADMET Predictor offers this algorithm in both the graphical user interface (see Tutorial example 7.3.3) and command line modes (see [ms_match_pka.txt script]).