

2.11. Structural Sensitivity Analysis
The Structure Sensitivity Analysis (SSA) window is an interactive display that shows how the individual atoms of a chemical structure contribute to a predicted property. It is intended to provide sensitivity information that is directly tied to chemical structure, so that chemists can see which regions of a particular compound have the most influence on a prediction of interest.
The SSA window was designed to be complementary to the existing Descriptor Sensitivity Analysis (DSA) window, which shows the sensitivities of individual molecular and atomic descriptors to a predicted property. The DSA indicates how changes to a particular descriptor will influence a particular property. Although such descriptor sensitivity information can be insightful, it can be difficult to interpret, because many of the descriptors provided by ADMET Predictor are not easily mapped back to chemical structure. It is therefore not always clear what structural changes to the compound would be required to change the value of the descriptor and, hence, the property of interest. The SSA window was developed to address this limitation by providing sensitivity information that is more chemically intuitive.
We have created structure sensitivity models for several of our built-in ADMET property models. Each model was built using the same protocol. First, ADMET Predictor was used to predict the property of interest (S+logP, for example) for a fixed set of roughly 7500 reference compounds. Next, ADMET Predictor was used to generate extended connectivity fingerprints (ECFP keys) for the compounds. We then constructed a partial least squares (PLS) regression model on the data, using the predicted ADMET property as the dependent variable and the binary ECFP key scores as descriptors. The PLS regression model provides a numeric coefficient for each ECFP key that was used as a descriptor. These pairs of ECFP keys and numeric coefficients can then be used for structural highlighting. When a new compound is evaluated with an SSA model, the compound is searched using all of the ECFP keys used to build the underlying PLS model. When a key is found, all matching atoms are assigned a score equal to the PLS coefficient for that key. The final score on an atom is the sum of the coefficients of all ECFP keys that hit the atom. An atom can then be colored according to whether its final score is low or high.
The Structure Sensitivity Analysis window is launched using either the menu item
TOOLS >> Structure Sensitivity Analysis
or by using the corresponding toolbar button

The SSA window has a similar layout to the DSA window. At the upper left is a box where you must first choose a single model to display. Once a model is selected, the box at the middle left will show a list of the compounds sent to the window, and the first compound will be selected automatically. To the right, of each compound name in the list, is the prediction from the underlying Simulations Plus model (e.g. S+logP). This prediction will be missing if predictions were not generated in ADMET Predictor or MedChem Designer prior to launching the SSA window.
The single selected compound will be displayed in the large window at the right. Within that main compound window, atoms are colored according to their atomic scores. By default, higher scores will be colored green, lower scores will be colored red and intermediate scores will be colored gray. An example display is shown below, using the drug Lisinopril and the S+logP model.
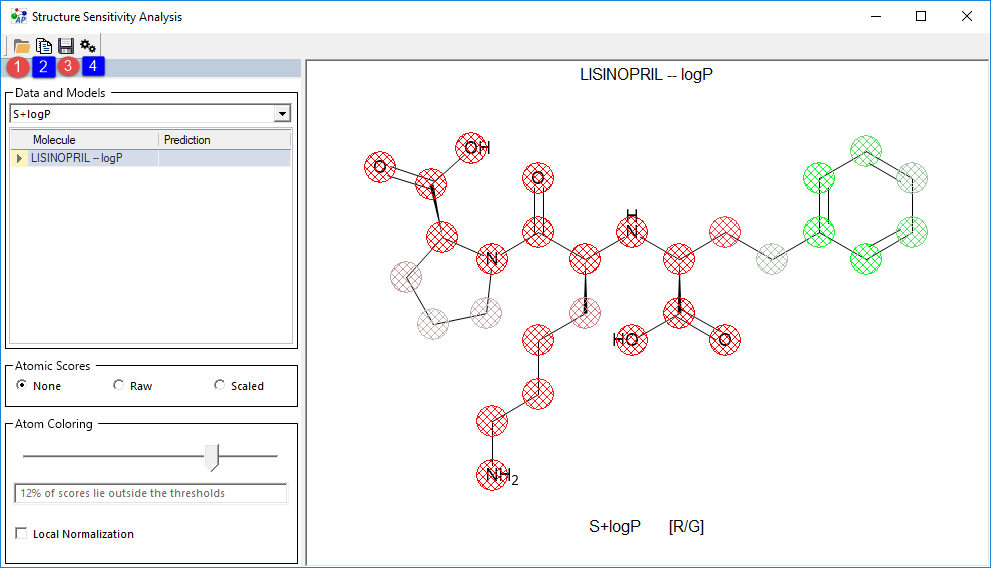
The image can be interpreted as showing which atoms are associated with higher S+logP (the green benzene atoms in the picture above), and which are associated with lower S+logP (the red polar atoms). It should be noted that for classification models, such as those predicting Yes/No or substrate/non-substrate, the legend below the compound depiction will indicate which prediction corresponds to green color; for example, the legend might show "G=Yes" to indicate that green-colored atoms are most important for a "Yes" prediction.
At the bottom left of the SSA window are controls used to adjust the main compound display. The Atomic Scores section lets you choose whether to display the numeric scores in addition to the colored spheres. There are options for both Raw and Scaled scores. The latter use integers from -100 to 100, which makes it easier to compare one score to another within the window.
The Atom Coloring slider bar allows you to adjust the color scale. Moving the bar to the left results in only the lowest- and highest-scoring atoms having an obvious red or green color, while moving the bar to the right results in more atoms being colored red or green. The scale is derived from the distribution of atomic scores for the set of reference compounds used to build the SSA model being viewed. Moving the slider adjusts a scaling factor that when multiplied by the standard deviation of the distribution yields a numeric threshold. Only atoms with scores higher than this threshold -- or lower than the negative of the threshold -- will appear colored, while all other atoms will appear gray. Adjusting the slider thus provides a quick method for seeing which atoms are most important for a particular model. The percentage of scores exceeding the threshold is displayed in the window just below the slider bar, and this percentage changes as the slider bar is moved left or right.
The check box labeled Local Normalization changes the normalization used to color the atoms. Rather than using the distribution of atomic scores for the reference compounds, as described above, atoms are colored according to the distribution for only the displayed compound. In other words, scores near the average score for the compound are gray, scores near the maximum are green, and those near the minimum are red. This can be useful when the default setting causes most atoms to have roughly the same color.
The toolbar at the top of the window provides four additional options. The first button (1) is used to open a query file (*.cqf), the second (2) to copy the compound depiction to the clipboard, the third (3) to save the compound depiction as an image file, and the fourth (4) to modify settings related to the compound display.
The first button (Open Query File) is typically used to open a file containing structure alerts. Examples might be alerts for reactive metabolites or other toxicities; the ADMET Predictor installation includes two such files, named ReactiveMetabolites.cqf and ToxAlerts.cqf. When such a file is opened, the controls on the left change, as illustrated below for the compound trovafloxacin and the file ReactiveMetabolites.cqf.
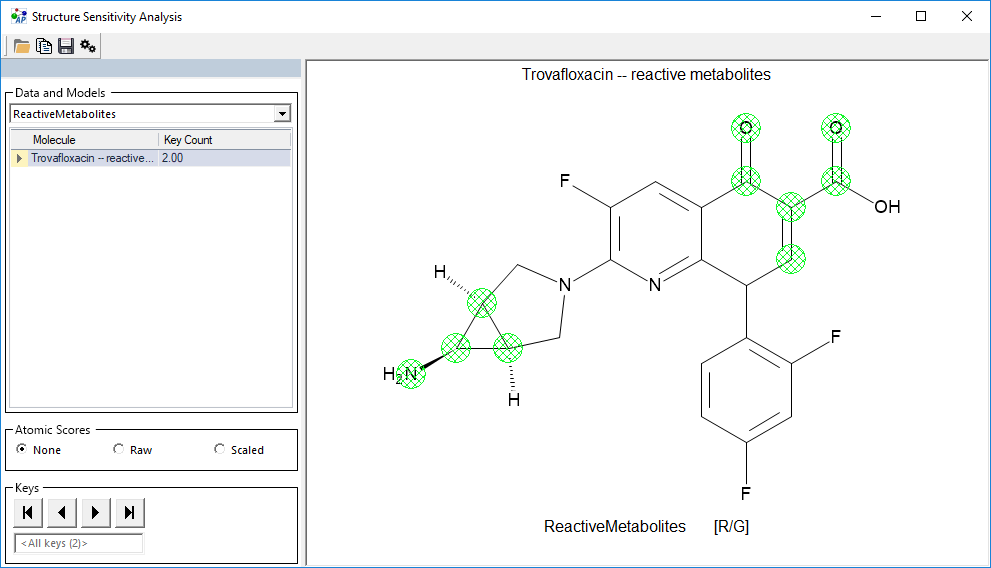
The name of the query file is displayed in the box at the upper left, with the list of compounds being displayed immediately below it. The second column of the compound spreadsheet is labeled Key Count, and shows the number of alerts that match the compound. The compound window at the right displays the matching alerts using structural highlighting. To view the alerts individually, you can use the navigation buttons at the lower left. For the example above, the two alerts are for Cyclopropylamine and Michael_Acceptor.
The final button (4) (Modify Settings) displays the following Display options dialog to change various display settings.
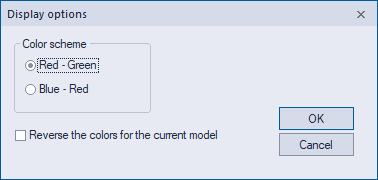
The first options control whether low and high atomic scores will be colored red and green or blue and red. The check box at the bottom allows you to reverse the color convention, such that low scores are green and high scores are red.
Building an SSA model
You can also use your own data to build a model that can be visualized in the SSA window. This will allow you to see structure sensitivity information for the property of your choice, whether it be ADMET or biological activity.
To build an SSA model, use the menu item TOOLS >> Create New SSA Model. The dialog Build a structure-sensitivity model appears when you do so.
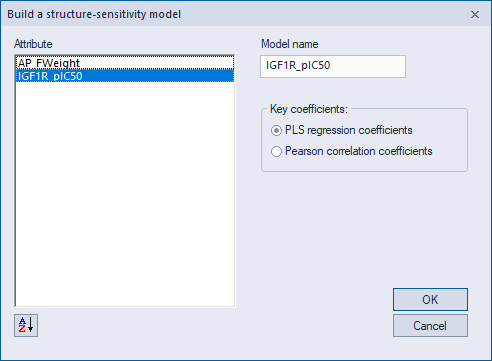
The first step is to choose the compound attribute you wish to model. By default, the selected attribute name will be used as the model name, which is the name that will be displayed in the SSA window. Next you can choose the method used to calculate ECFP key coefficients. The default option is to use the coefficients from a PLS regression model. This is the method used to build the Simulations Plus models displayed in the SSA window (e.g., S+logP). The alternative is to use Pearson correlation coefficients. With this method, each ECFP key's coefficient is simply the Pearson correlation coefficient between the ECFP key and the dependent variable. This option produces relatively simple models that tend to emphasize the substructures that most correlate with the property of interest. You can experiment with the two methods and choose the one that yields the most useful results. When you click OK, the new model will be created and the resulting model file will be placed in the SSA subfolder of the ADMET Predictor application data directory. The next time you launch the SSA window, the new model will appear in the list of available models. If you wish to delete the model in the future, simply delete the corresponding model file.