

2.10. Descriptor Sensitivity Analysis
The Descriptor Sensitivity Analysis allows a user to explore the relationship between one specific descriptor and model output in detail, for one data record at a time. It can be launched using one of the following two ways
TOOLS>>Descriptor Sensitivity Analysis
or using keyboard icon highlighted in following icon bar

The tool may provide useful guidance on how to optimize molecule’s properties. Once you identify one molecule of interest, the corresponding models can be loaded one at a time, and the descriptor influence on the output can be examined. By consistently adjusting descriptors whose values are easy to change, you can use the output to design new molecules with more desirable properties.
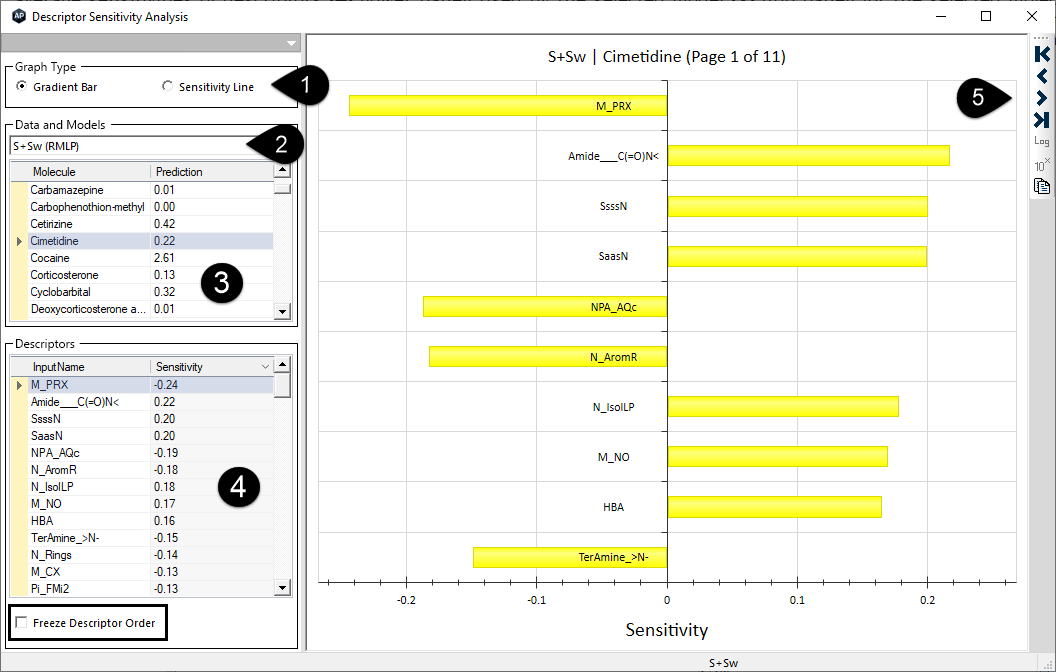
When launched, Descriptor Sensitivity Analysis provides multiple choices to visualize the sensitivities. It supports two types of plots as depicted by (1) in figure below: Gradient Bar and Sensitivity Line. Just below the Graph Type, Data and Models section includes number of models available in ADMET Predictor for which sensitivity Analysis can be run. You should select any property model from the drop-down menu available (2).
An example of descriptor sensitivity analysis is shown below. In the first figure presenting the Gradient Bar type, the bars show the average sensitivities of descriptors (4) (lower panel) used by the selected model (2) (top panel) for the selected molecule (3) (middle panel). The direction of the bars show the sign of the sensitivity while the size of the bars shows the magnitude of the sensitivity. The longer the bar is, the greater the impact the respective descriptor has on the prediction of the selected molecule. If the selected model (2) is based on more than ten descriptors (4) (The bar chart can show maximum ten descriptors at a time), the navigation arrows (5) provides access to remaining descriptors and respective bar charts.
Sensitivities are calculated differently for certain regression (models indicated by the RMLP, SVMR, RLBN and KPLS keywords) and classification models (CMLP only). Both XGBoost regression (RXGB) and classification (CXGB) receive special treatment; see below. For all regression models except RXGB, sensitivities are calculated as scaled partial derivatives of continuous model’s response with respect to a given descriptor while keeping all other descriptors fixed. Hence, the meaning of sensitivity in this case is equivalent to a local slope. For example, positive sensitivity in a regression model indicates that increasing the given descriptor will also increase the predicted value. As such, the sensitivity is defined uniquely.
For binary classification models of the CMLP type, which are not continuous, the calculation of sensitivity is completely different. First, the program calculates the minimal change Δd, either positive or negative or both, of a given descriptor “d” to flip the current prediction for the selected molecule. The smaller the change Δd is, the higher the descriptor d sensitivity. Therefore, the d’s sensitivity is defined as the reciprocal of the minimal flipping change: S = 1/(Δd+1). Thus, if the DSA for a particular descriptor is positive then increasing the value of the descriptor may cause the prediction to flip. On the other hand, if the sensitivity bar is negative then decreasing the magnitude of the descriptor may cause the prediction to be flipped. However, since a descriptor can go both ways to flip a CMLP prediction, some descriptors will have both negative and positive bars.
Since decision trees are not continuous at the decision boundaries, sensitivities for RXGB and CXGB have a different meaning: These are additive contributions to the output value per descriptor calculated as SHAP (SHapley Additive eXplanation) values (Shapley 1952, Lundberg 2017) by the well known TreeSHAP algorithm. (Lundberg 2019).
By default, descriptors are automatically sorted by the magnitude of their sensitivity. The Freeze Descriptor Order option (below descriptor panel (4)) of is useful for freezing the order of descriptors when different molecules are subsequently selected.
The second graph type, the Sensitivity Line, is available only for regression models. In there, graphs show how continuous changes of a selected descriptor (in the lower-left panel) for the selected molecule would affect the model response.
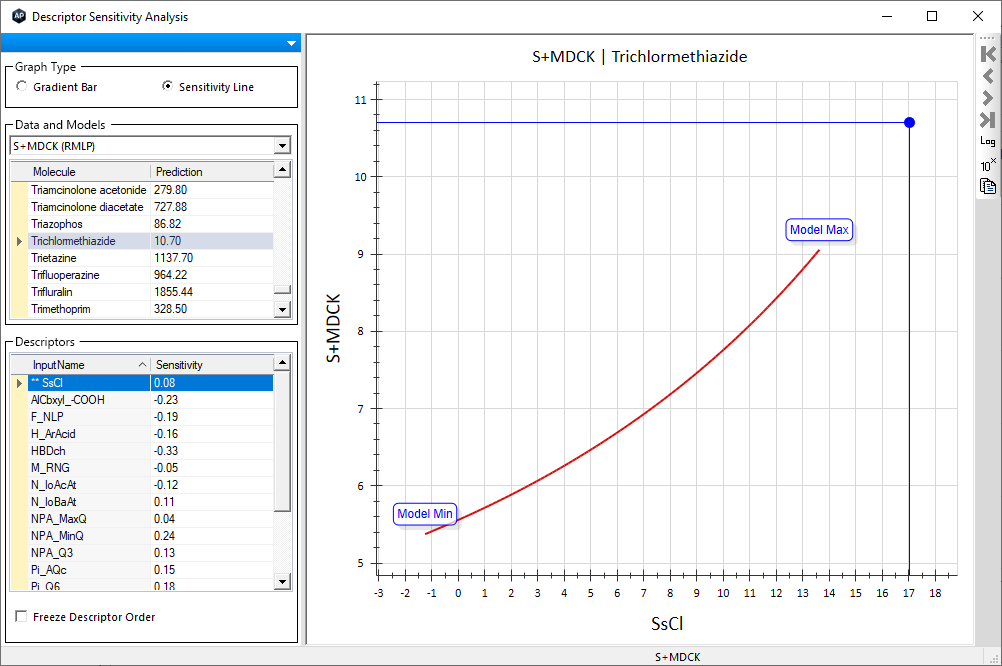
The “ModelMin” and “ModelMax” in the picture refer to the value range of the selected descriptor of all molecules used to build the model. If any of the descriptor of any compound falls outside the range of "ModelMin" and "ModelMax" (not in applicability domain), then the corresponding prediction for that compound will be flagged as "out of scope". For example, in above figure one of the descriptors (SsCl) values is beyond the scope of the S+MDCK model, which is indicated by the prepended asterisks. Hence the predicted S+MDCK value of "Tricholmethiazide" is flagged as "out of scope". For RXGB models the sensitivity line is not smooth but has a step-like appearance with abrupt changes at the decision points. This is normal behavior for a collection of decision tress like XGBoost.