

Model Performance
-
On the model Performance Grid (see previous topic, Building the models) click the cell that is highlighted in green, which is the best ensemble as determined automatically by ADMET Modeler.
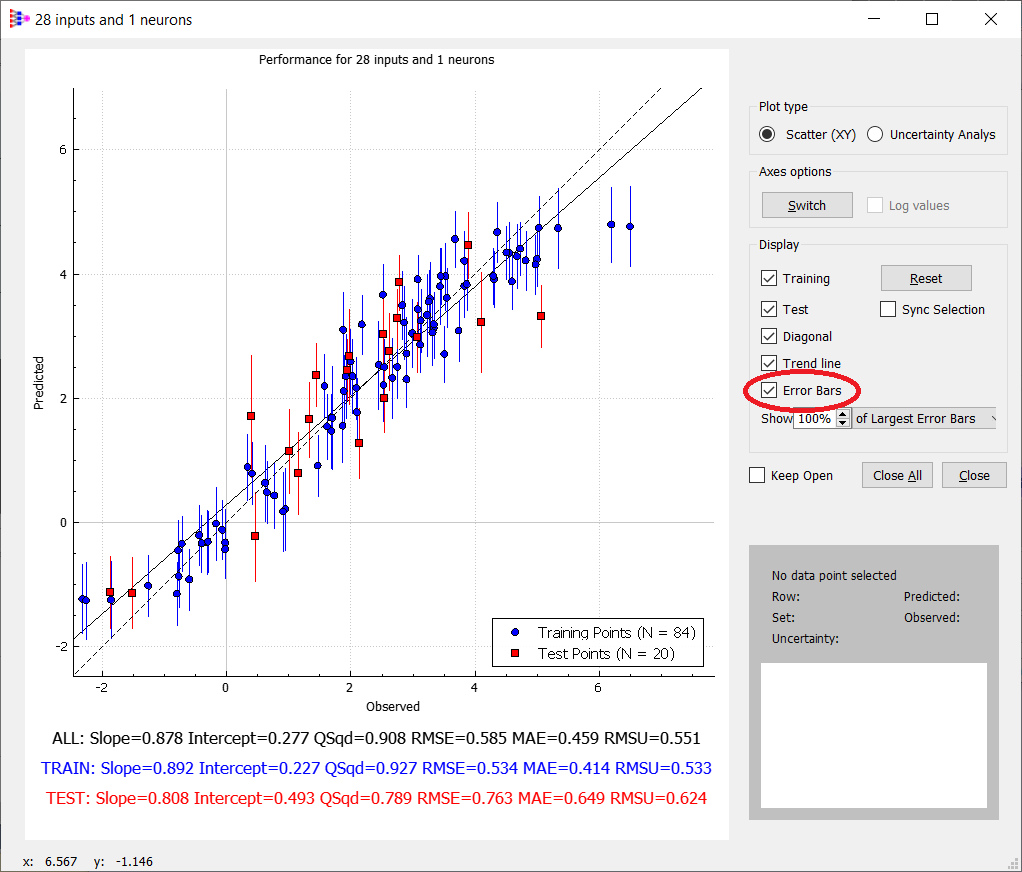
The performance viewer window opens. Performance statistics for the selected ensemble are displayed below the performance graph. The Error bars check-box (under the Display options) is not turned on by default. Checking this box will show the vertical error bars associated with each prediction.
-
Do one or more of the following:
-
inspect the model performance using different graph settings
-
place your mouse pointer on any data point on the graph to display its coordinates in the lower left corner
-
click on a data point to see the compound structure in the lower right corner of the window
-
right click anywhere on the graph to open a context menu that has options for saving the graph as an image, copying the image to the Windows clipboard, and copying the graph data to the Windows clipboard.

-
Close the model performance window once you are done. To export the model, move to the next section.