

Applying the New Predictive Model
-
You would have to close ADMET Modeler to use the newly added model. Before doing so, use the Save project button to write the project files to ExlogP_20xx-xx-xx_01 in the Tutorial/Example 1 folder in your ADMET Predictor applications directory. That way the model files can be reused in a subsequent tutorial.
-
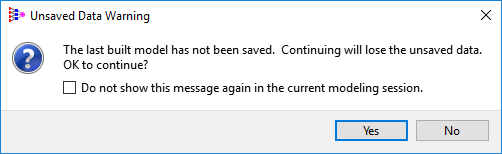
If you try to leave without first saving the project, you will see a warning:
-
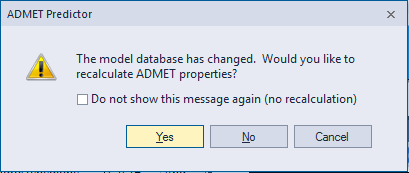
After saving the project, close ADMET Modeler by clicking on x in the upper right corner or by selecting the File >> Exit menu command. After closing ADMET Modeler, ADMET Predictor will ask you if you would like to recalculate ADMET Properties. Select Yes and then select Calculate in the Calculate ADMET properties dialog.
The results of the ADMET Predictor estimations for the Demo2D.qmd file will be displayed in the spreadsheet. The newly added model will initially appear as the last column displayed. If the attribute group displayed is changed (e.g., from User Models to All), the column will be moved to the end of the block of User Models.
-
Do the following:
-
place your mouse pointer on the header of the column to confirm that the tooltip displays the expected message
-
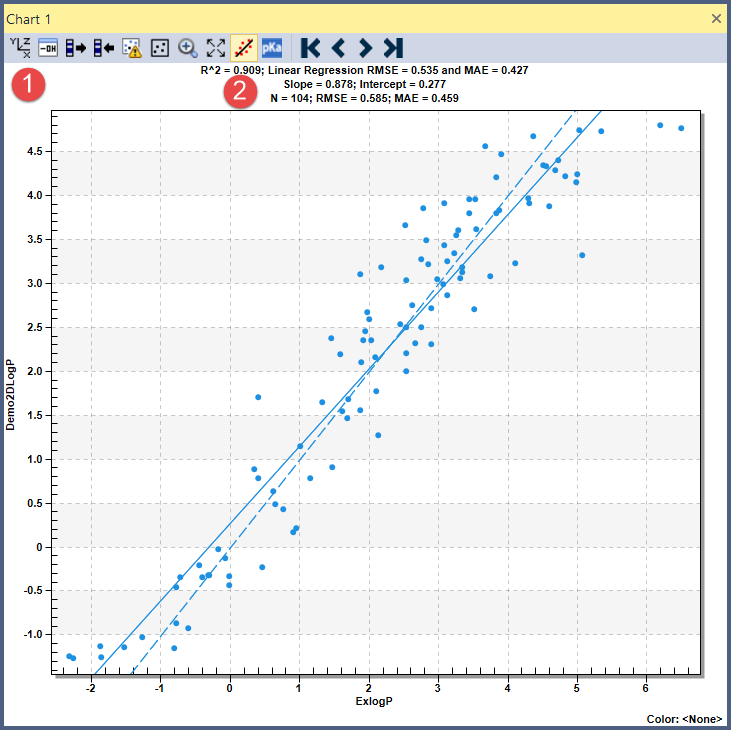
in the window titled Chart2, right bottom corner of ADMET Predictor, click on Chart Properties (1) and select ExlogP for X Axis, and Demo2DLogP for Y axis, then OK. Then click on Linear Fit (2) to see the performance statistics.
-
compare these statistics against those for the commercial S+logP model by selecting it as the X Axis variable instead.