

The Keys tab contains three main sections in addition to the standard charts on the right. In the center is the main spreadsheet (1), whose rows display the generated keys. At the lower left is the Compounds pane (2), which shows the compounds used to generate the keys. At the upper left is the Focus pane (3), which is used to visualize a single compound/key combination. These sections are described below.
The main spreadsheet and Compounds pane also provide right-click context menus. Some of the important and unique menu options are described in the respective sections below.
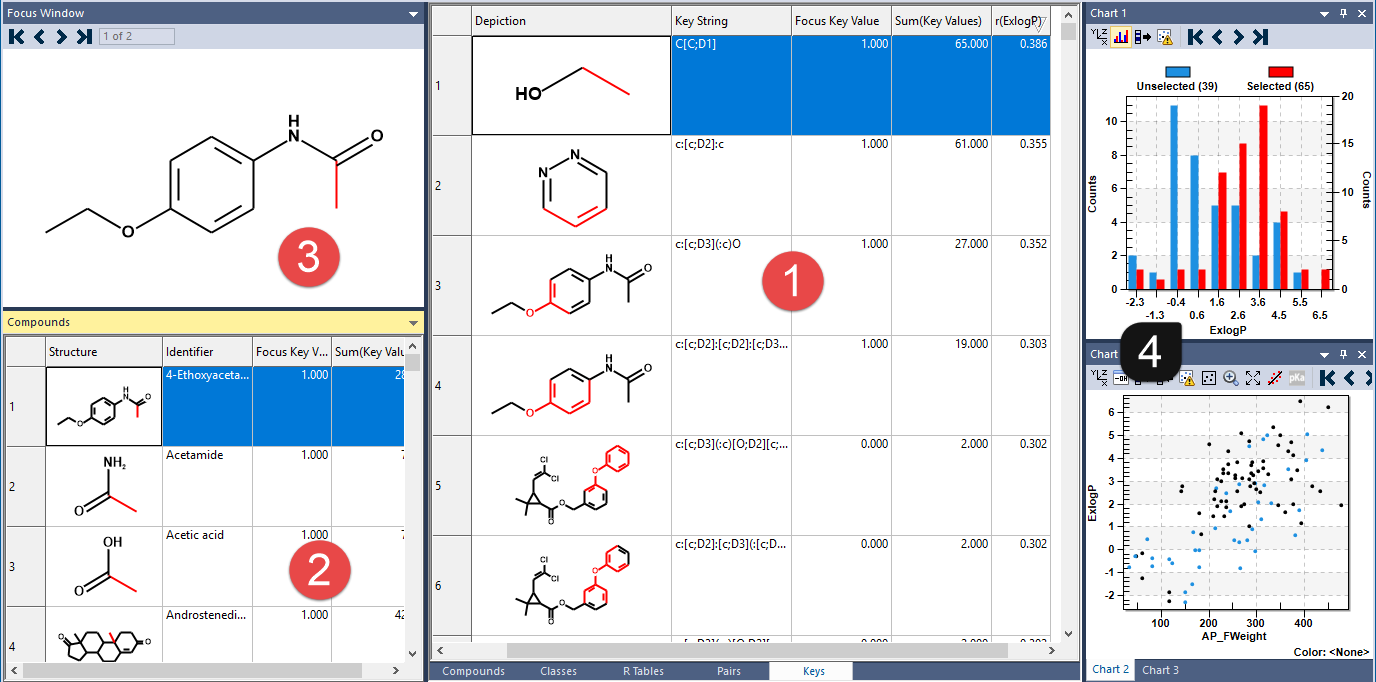
(1) Main spreadsheet
The default columns of the main spreadsheet are as follows:
Key Name. The name of the key. Default names have the form “Key_N”, where N is the integer index of the key. When keys are generated using an external file containing queries, more descriptive key names can be specified in the file.
Key String. A text description of the key. The description is always expressed in the form of a query, the format of which will depend on the type of key represented. See the Query Format section for a description of the different query types.
Depiction. For keys based on substructure, a depiction of the lowest molecular weight compound “hit” by the key, with highlighting indicating the key’s location within that compound. For keys not based on substructure, this column will contain an empty cell.
Focus Key Value. A number representing the combination of the key and the single compound displayed in the Focus pane. For keys based on substructure (ECFP for example), the key value is generally a binary 0/1 value indicating whether or not the compound contains the key; however, as described below, substructure keys loaded from a file can yield key values equal to the number of times a key is found in each compound. For a key representing a property (e.g., molecular weight), the key value is the value of that property. Note that as you change the focus compound by double clicking rows in the Compounds pane, the numbers in the Focus Key Value column will change.
Sum(Key Values). The sum of key values over all compounds displayed in the Compounds pane. For binary (0/1) substructure keys, this value represents the number of compounds “hit” by the key.
r(\<Attribute_Name>). Pearson correlation coefficient between key values and an arbitrary numeric attribute (Attribute_Name) for the compounds in the Compounds pane. This column is generated by using the menu item KEYS >> Key-Attribute Correlation, or by clicking the corresponding toolbar button. A value close to 1 indicates that the presence of the particular key correlates with higher attribute values, while a value close to -1 indicates that an inverse correlation exists. A value close to 0 indicates that there is no correlation, while missing values indicate that the key hits either none of the compounds or all of them. You can explore these correlations in more depth using the histogram chart on the right, as described below.
Right-click context menu
-
Export. Exports the selected keys to an external file. Several different file types are supported. Key Query Files (*.cqf) exports the key names and definitions as a query file that can be used for other ADMET Predictor features, such as class generation or attribute definition. Key Matrix Files (*.txt) and Sparse Key Matrix Files (*.txt) export all or a portion of the key matrix. Note that the files resulting from these three export options can be used to reconstruct the contents of the Keys tab. Simply choose the option called Load from exported matrix file on the Generate keys dialog when generating keys, then select the query and matrix files. This can often be much faster than generating keys using the original method (e.g., ECFP keys). Moreover, since the XTK/CTK file format does not include information about keys, exporting keys is the only way to save the results persistently.
-
Select Compounds Hitting All. Selects in the Compounds pane all compounds with a non-zero value for all of the selected keys. For binary (0/1) keys, this operation selects all compounds that are “hit” by the keys.
-
Select Compounds Hitting Any. Similar to the above option, but selects compounds hit by any of the selected keys, not necessarily all of them.
(2) Compounds pane
The default columns of the Compounds pane are as follows:
Structure. A depiction of the compound. Colored highlighting is used to indicate how the focus key – the key displayed in the Focus pane – “hits” the compound. Note that only keys based on substructure produce this kind of highlighting.
Identifier. The name of the compound.
Focus Key Value. Identical to the Focus Key Value column in the main spreadsheet (see above). Note that the numbers in this column change as the focus key is changed by double clicking within the main spreadsheet.
Sum(Key Values). The sum of key values over all keys displayed in the main spreadsheet. For binary (0/1) substructure keys, this value represents the number of keys that “hit” the compound.
Right-click context menu
-
Select Keys Hitting All. Selects in the main spreadsheet all keys with a non-zero key value for all of the selected compounds. For binary (0/1) keys, this operation selects all keys that “hit” the compounds.
-
Select Keys Hitting Any. Similar to the above option, but selects keys that hit any of the selected compounds, not necessarily all of them.
-
Display In Compounds Tab. Causes ADMET Predictor to switch to the Compounds tab, where the compounds currently selected in the Compounds pane will be displayed as selected in the Compounds tab. This operation allows you to perform further analysis on these compounds.
(3) Focus pane
This pane shows the key and compound that are currently focused. Double clicking within either the main spreadsheet or Compounds pane will change the contents of the Focus pane. Highlighting is used to show the position at which the focus key “hits” the compound. Note that keys that are not structural in nature (e.g., properties) do not display any structure highlighting.
For keys based on substructure, the navigation buttons at the top of the Focus pane allow you to see all possible ways that the focus key hits the focus compound. Note that the number of hits displayed in the window is determined by “uniqueness”: each unique combination of “hit” atoms and bonds will result in a new match that can be viewed using the navigation buttons.
Double clicking inside of the Focus pane will cause both the displayed compound and key to be highlighted within their respective spreadsheets.
(4) Charts in the Keys tab
When the Keys tab is displayed, all histogram charts are displayed in two-color mode. As explained elsewhere, two-color mode displays both blue and red bars. The blue bars are used for compounds that have a key value of zero for the single key that is currently focused, while the red bars are used for compounds that have a non-zero value for that key. Note that for keys based on substructure, key values represent the presence of that substructure within a compound, so red and blue bars represent compounds with and without the focus key, respectively. Because this distribution is based on the currently focused key, it changes as you double click different keys within the main spreadsheet. In this way, it is possible to use the histogram to see which keys are most correlated with an attribute (biological activity, for example), since correlated keys will result in the red bars being shifted to the left or right relative to the blue bars.
2D scatter plots also behave somewhat differently in the Keys tab. When you double click on a key, the compounds with non-zero values for that key become highlighted in the chart.