

6.3. Cp-Time Curve
ADMET Predictor can display a graphical window showing the simulated plasma concentration as a function of time. This Cp-time curve is based on the same compartmental simulation described earlier for estimating %Fa/%Fb and the optimal dose, and shows quantitatively good agreement with the curve generated using a GastroPlus compartmental simulation.
To generate a Cp-time curve, select one or more (up to 16) compounds in the Compounds tab and use either the
TOOLS >> PK Simulation >> Cp-Time Curve menu item (2) or the corresponding button on the main toolbar (1).

The resulting Generate Cp-time profile dialog is similar in appearance and behavior to the one used for estimating %Fa and %Fb.
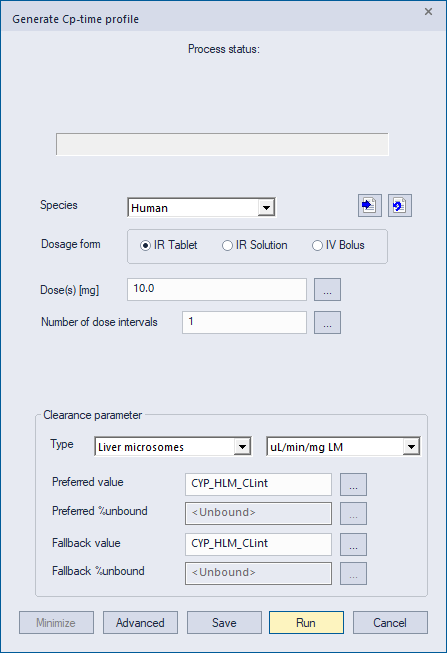
If you change the Number of dose intervals to a value greater than one, the simulation will run for more than one dose interval, with a dose being administered at the start of each. The default dose interval is 24 hours, but this can be changed using the Advanced dialog.
After specifying the desired parameters and clicking Run, a graph is displayed showing one or more curves. The first image below shows results using a single compound with three specified doses, while the second shows results using three compounds with a single dose. Note that a single dose is required if you are generating curves for more than one compound.
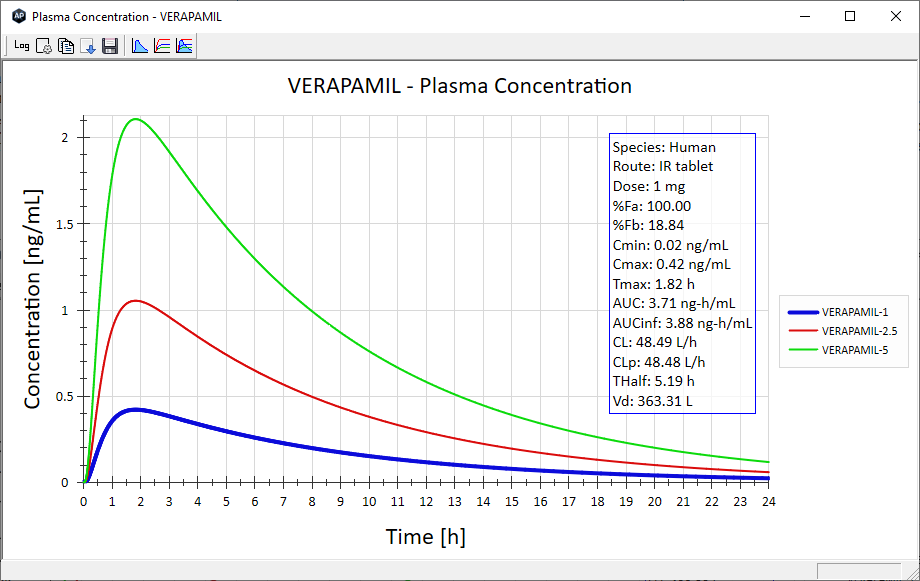
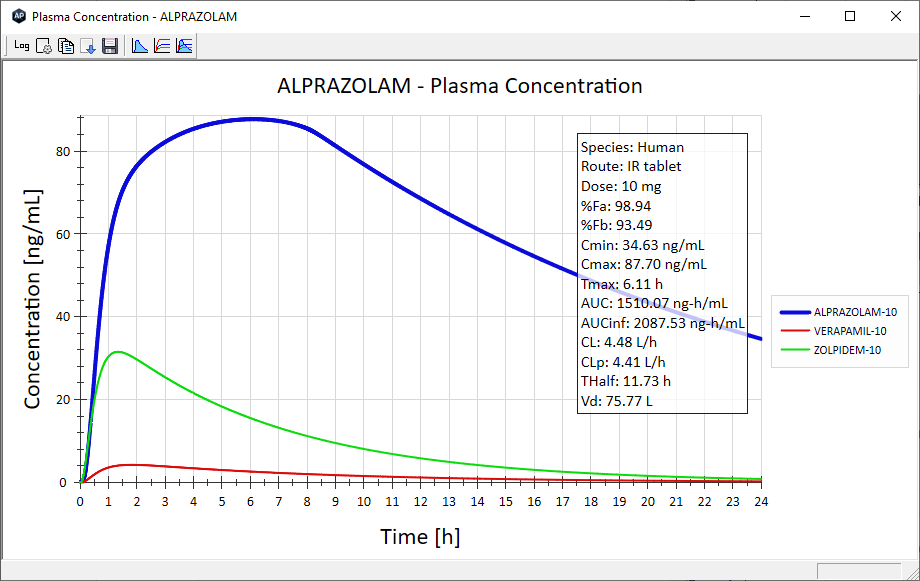
The small box in the upper-right corner of the graph shows basic information and pharmacokinetic parameters for the first series. You can click on a different series label in the legend at the right of the plot to see its corresponding information in the box. The individual items in the box are described elsewhere in this HTPK section of the user manual. Note that CLp refers to the plasma clearance value that includes both hepatic and renal components (e.g., hCLp_HR), while Vd is the volume of distribution used in the simulation, be it ADMET Predictor's statistical prediction, the mechanistic estimate (e.g., S+hVd_PBPK) or a user-defined value.
In addition to plasma concentration, it is possible to display amounts dissolved, absorbed and bioavailable. The display is controlled by three buttons, as shown highlighted in the image below. The first displays plasma concentration, the second displays amounts dissolved, absorbed and bioavailable, while the third displays all four profiles simultaneously. The figure below corresponds to the second of these three options. In the legend at the right, D corresponds to dissolved, A to absorbed and SC to systemic circulation (bioavailable).
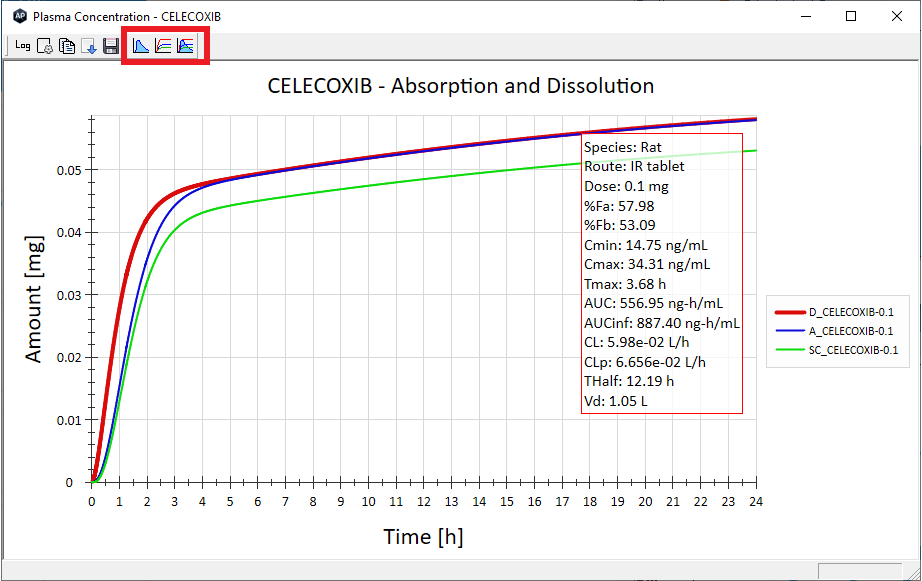
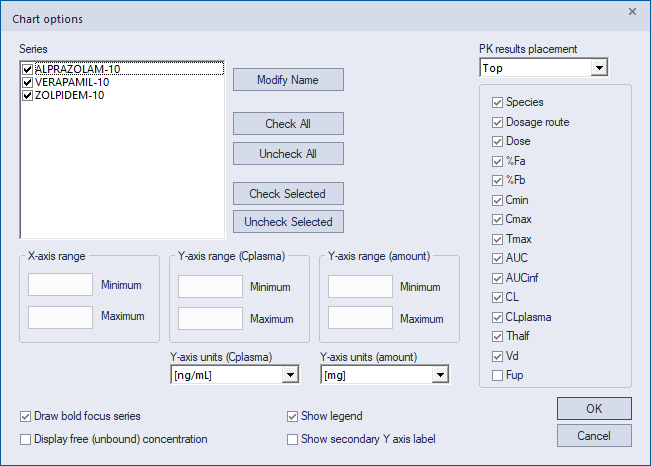
Clicking the Chart Options button (gear icon) on the toolbar allows you to hide one or more of the series or change their names, change the concentration units on the Y axis, specify axis ranges or modify the contents of the information box.
There are situations where it's useful to generate a Cp-time curve and display it in an existing Cp-time window rather than in a newly created one. This makes it easier to visualize the results of a parameter change, for example. When you launch the Cp-time feature when a previously generated Cp-time window is still available (i.e., has not been closed), a dialog option will appear that allows the selection of an existing window. The new button, called Display curves in existing Cp-time profile window, is illustrated below.
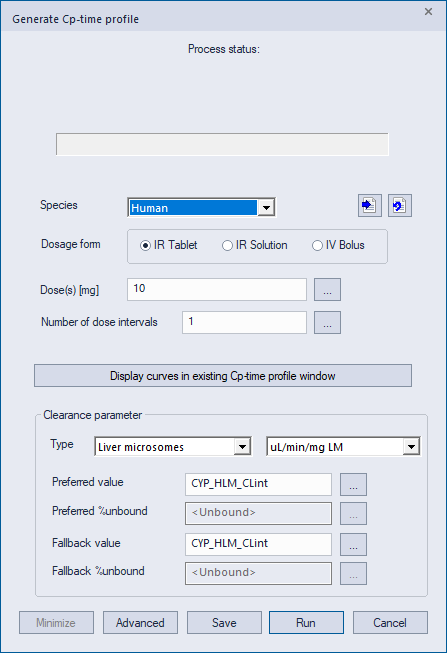
Clicking this button will allow you to select the name of an existing Cp-time window. After clicking Run, the new curve(s) will be added to the selected window. Note that this option is available only when you have selected a single compound for the simulation.