

6.4. Parameter Sensitivity Analysis
Parameter Sensitivity Analysis (PSA) assesses the sensitivity of predicted absorption or pharmacokinetic responses to critical input parameters. For example, if a particular compound indicates a relatively high sensitivity of absorption to estimated solubility but a relatively low sensitivity to estimated permeability, you will know that improvements to solubility could have a substantial payoff, while higher permeability would not. You would also know that it is important to accurately measure solubility by experiment, but that any reasonable estimate for permeability is probably sufficient. If the solubility used in the simulation was actually determined by experiment (not an in silico estimate), and predicted absorption was poor, you would know to direct efforts toward formulating the compound in order to accommodate the low solubility until the trade-off between dissolution (limited by low solubility) and permeability was more balanced, or to move on to another candidate compound.
To begin a PSA, select a single compound in the Compounds tab and use either the menu item TOOLS >> PK Simulation >> Parameter Sensitivity Analysis (2), or the corresponding toolbar button (1).

The resulting dialog Perform parameter sensitivity analysis dialog is similar in appearance and behavior to the one used for estimating %Fa and %Fb, but has a new section as shown highlighted below:
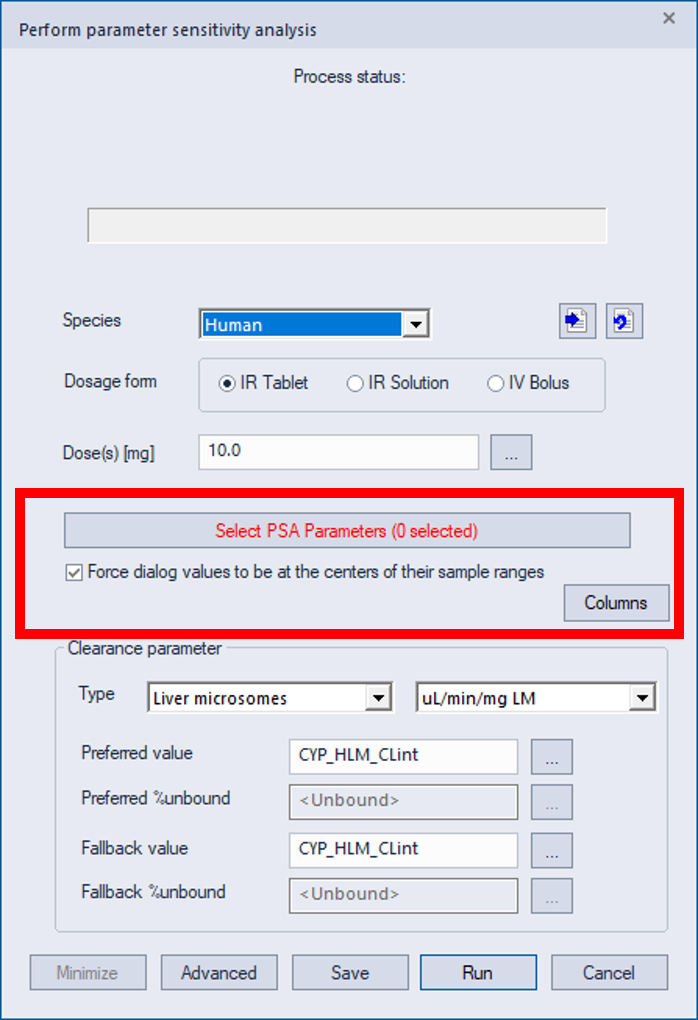
Clicking the Select PSA Parameters button will open a secondary dialog for choosing the PSA parameters. The example below shows how this dialog appears by default after selecting the parameters solubility, permeability, Fup and clearance.
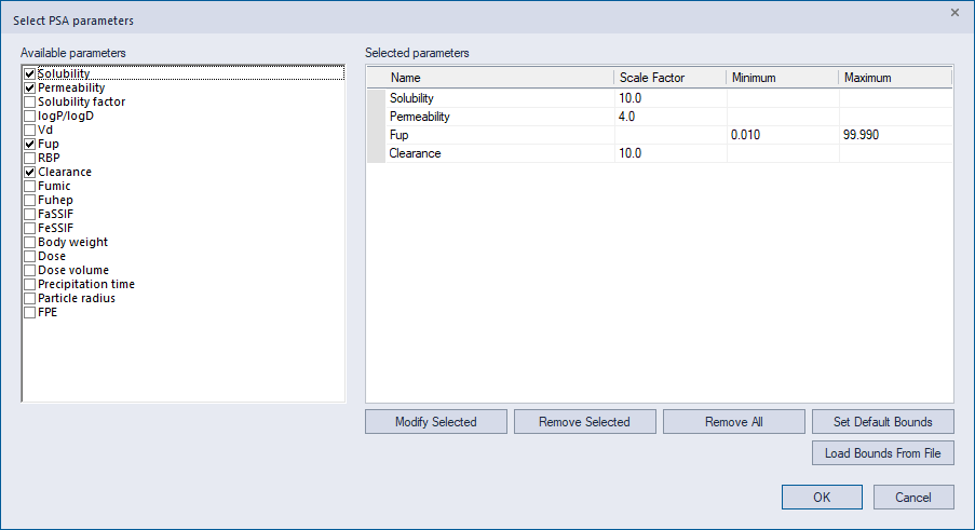
The numbers on the right determine how each input parameter will be varied during the course of the PSA. For each parameter you must choose either a scale factor or a minimum/maximum pair. When using a scale factor, the upper limit of the parameter will be the base value (the one entered on the HTPK dialog) multiplied by the scale factor, while the lower limit will be the base value divided by the scale factor. For example, if the base solubility (e.g., the predicted value of the S+Sw model) is 0.5 mg/mL, then the scale factor of 10.0 shown above will vary the solubility between 0.05 and 5.0 mg/mL. When using a minimum/maximum pair, you are able to control the upper and lower bounds directly. This is most useful for parameters with strict bounds, like fraction unbound in plasma (Fup). By double clicking on a parameter's row in the Selected parameters window, you are able to change the bounds settings for the parameter. As of ADMET Predictor version 14 you can load bounds from a file using the “Load Bounds From File” button; see the example file PSAParamBounds.txt.
The second PSA option on the original dialog is labeled Force dialog values to be at the centers of their sample ranges. When this option is checked, parameters that are varied using a minimum and maximum (rather than a scale factor) will have the minimum or maximum adjusted so that the value entered in the dialog will be at the center of the range. If the option is not checked, no adjustments to minimum or maximum will be made, so the dialog value might not be at the center of the range. The option is on by default, since the centering tends to produce plots that are easier to interpret.
Before staring the PSA, be sure that you have chosen appropriate starting values for all selected input parameters. Most inputs will be ADMET Predictor models by default, but you can specify other models or experimental values if desired. Please recall that some parameters, like solubility and permeability, are displayed on the Advanced dialog, which you can display by clicking the Advanced button.
To begin the PSA, click the Run button. This will initiate a series of simulations in which the input values are varied independently. The first set of simulations will vary the first input (solubility in this example) while keeping the other inputs fixed at the user-specified values, while the second set of simulations will vary the second input, and so on.
When the PSA is complete, you will see a chart similar to the one below. Note that the Y axis has been changed from %Fa to %Fb, as described later.
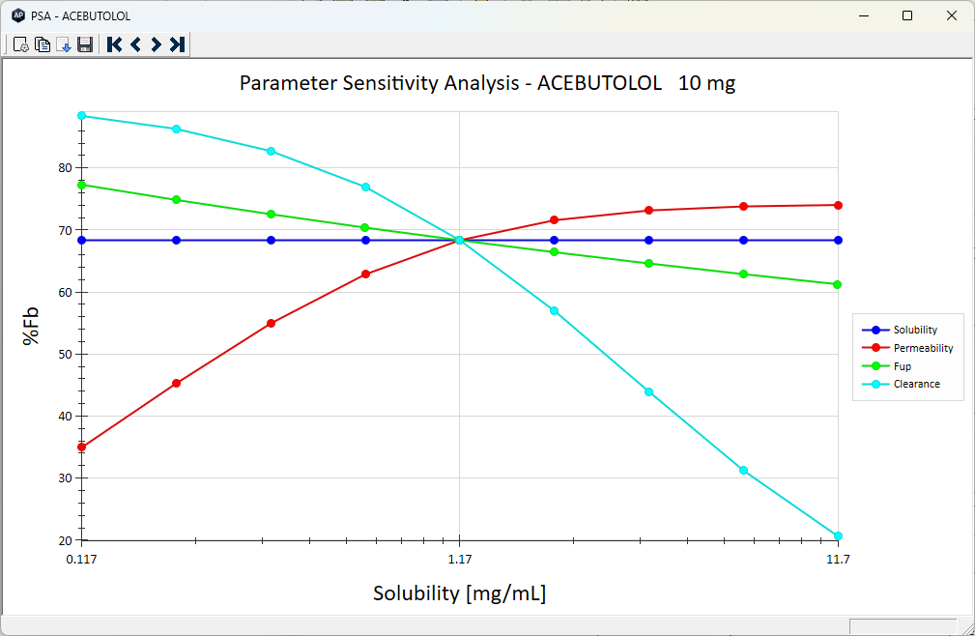
The blue set of points correspond to varying solubility with all other inputs fixed, the red set to varying permeability with all other inputs fixed, etc.
The Y axis value can be toggled between fraction absorbed (%Fa), fraction bioavailable (%Fb), Cmax, Tmax and AUC using the four navigation arrow buttons on the toolbar. Clicking on an item in the legend at the right will change the parameter shown on the X axis. If you hold the Control key while clicking a legend item, a secondary X axis will be placed at the top of the chart. The example below shows permeability added as a secondary X axis.
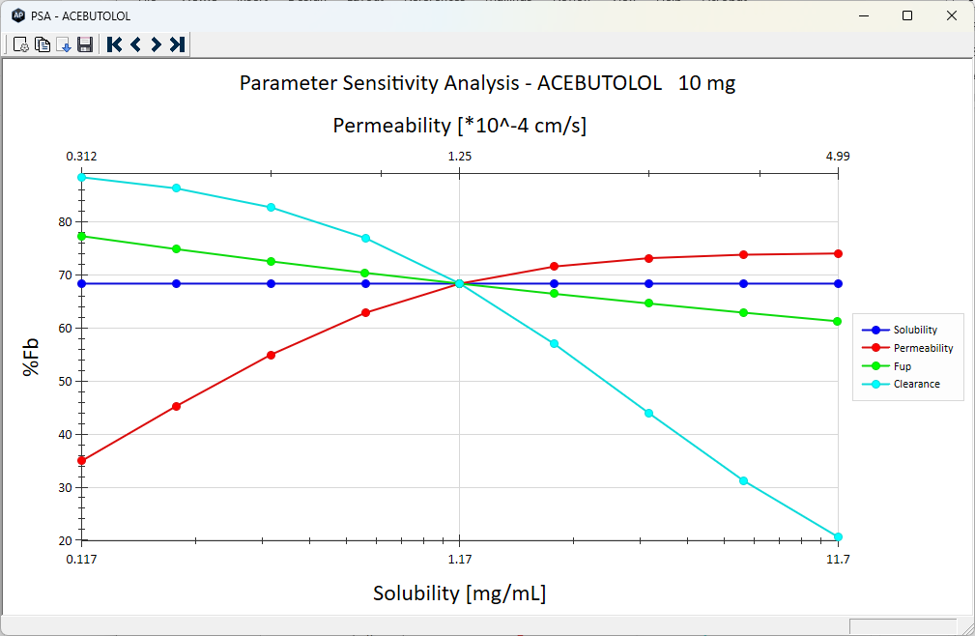
By clicking the Chart Options button (with a gear icon) you can change additional settings, as shown below.
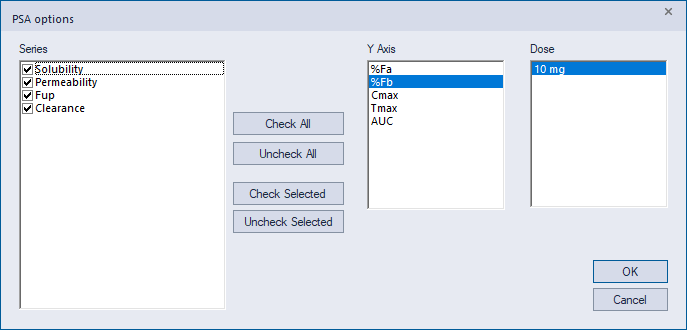
Starting in ADMET Predictor 14.0, PSA calculations can be run simultaneously on more than one compound. Such multi-compound runs, however, do not display a chart like the one described above. Instead, new spreadsheet columns are added that quantitatively describe the sensitivities of the endpoints (%Fa, %Fb, Cmax, Tmax and AUC) to the chosen input parameters (e.g., solubility, permeability, etc.). For each combination of endpoint and parameter, a sensitivity score is computed equal to the change in the endpoint value around the midpoint of the sample range. Quantitatively, the sensitivity is the endpoint value at the point immediately to the right of the midpoint minus the endpoint value at the point immediately to the left of the midpoint. Looking at the chart above, which shows the endpoint %Fb, the score for permeability would be roughly 9, while for clearance it would -20. The sensitivity is the slope of the line, it is negative for clearance, indicating that the higher the clearance, the lower %Fb. The sensitivity values are stored as new compound attributes named PSA_%Fb_Perm and PSA_%Fb_CL, respectively. They indicate that %Fb has the most positive sensitivity to permeability at the midpoint (e.g., %Fb increases with permeability) and the most negative sensitivity to clearance, and thus nicely summarize the trends shown in the chart.
It is important to note that the sensitivity calculations do not include a denominator. This reflects the assumption that all input parameters are already on the same scale, such that the denominators are the same. Thus, it is important that the user selects the parameter bounds carefully in the initial setup. With the current form of the sensitivity calculations, the values should exactly match the slopes of the chart lines at the midpoint.
Rather than display these new sensitivity attributes in the spreadsheet, ADMET Predictor hides them and instead summarizes them in new graphical columns similar to the star plots described elsewhere in this manual. The image below shows the plots generated for the run described above.
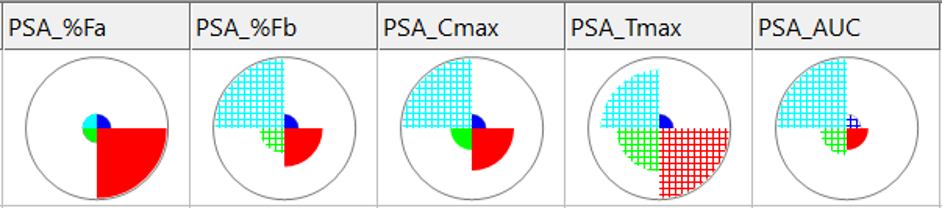
The colors of the wedges match those shown in the chart legend, so blue is solubility, red is permeability, and so on. Looking at the second column (PSA_%Fb), which represents the %Fb endpoint, the wedge for clearance is the longest, indicating that the influence of clearance on %Fb is largest among the four parameters, and its hatched texture indicates that its influence is negative. Meanwhile the red permeability wedge indicates a smaller influence than clearance, and a positive one. Hovering over a wedge with the mouse displays the actual sensitivity score.
The graphical columns become more valuable once a PSA has been performed on more than one compound. The length of a given wedge reflects the maximum (absolute) value of the corresponding sensitivity score among all compounds having undergone a PSA. Because the wedges are normalized in this way, it is easy to compare compounds and see which has the highest sensitivity of an endpoint (e.g., %Fb) to a given parameter.
Note that the quantitative columns showing individual scores (e.g., PSA_%Fb_Perm) are hidden by default. You can display them using the menu item VIEW >> Arrange Columns. If you want to suppress the generation of sensitivity attributes altogether, activate the Simulation preferences page using FILE >> Preferences >> Simulation, then uncheck the box related to PSA star plots. When this box is unchecked, PSA will not work if more than one compound is selected, because no results would be generated. If you would like to suppress individual star plot columns (e.g., PSA_Cmax), you can click the Columns button on the HTPK dialog (shown above) and uncheck the corresponding item before running the calculation.