2.6.2. Transporter Km Models
ADMET Predictor provides prediction of Michaelis constant (KM) for six uptake transporters. The data used to construct them was obtained from various public and commercial databases as well as extensive reference to the primary literature and reviews. Data from every source was subject to careful curation to ensure its relevance and reliability.
Many researchers opt to use one of a few common substrates for their transporter inhibition assays, and generally need to characterize their cell line with respect to that substrate's affinity for the transporter being expressed in that cell line. p-Aminohippuric acid, for example, is often used as a substrate when assaying for OAT1 transporter inhibition, while estrone-3-sulfate is commonly chosen to be an OATP1B1 inhibition "victim." Hence Km values are available for relatively few substrates within the open literature, and most have several different reported values. In those cases, median values of valid data (e.g., data not from mutated transporters or obtained using inside-out membrane vesicles) were used. The final data set sizes ranged from 64 to 90 compounds.
Most of the data used in building our Km models were obtained from human enzymes, but the limited amount available prompted us to find a way to augment that with data for the corresponding rat enzymes where possible. Median values for replicate rat transporters were converted to human Km values using a non-linear regression model based on overlapping rat and human data sets. The technique employed is a variant on DELTA models. Where both rat and human values were available, the geometric mean of the human and the adjusted rat Km median values was used for the final analysis.
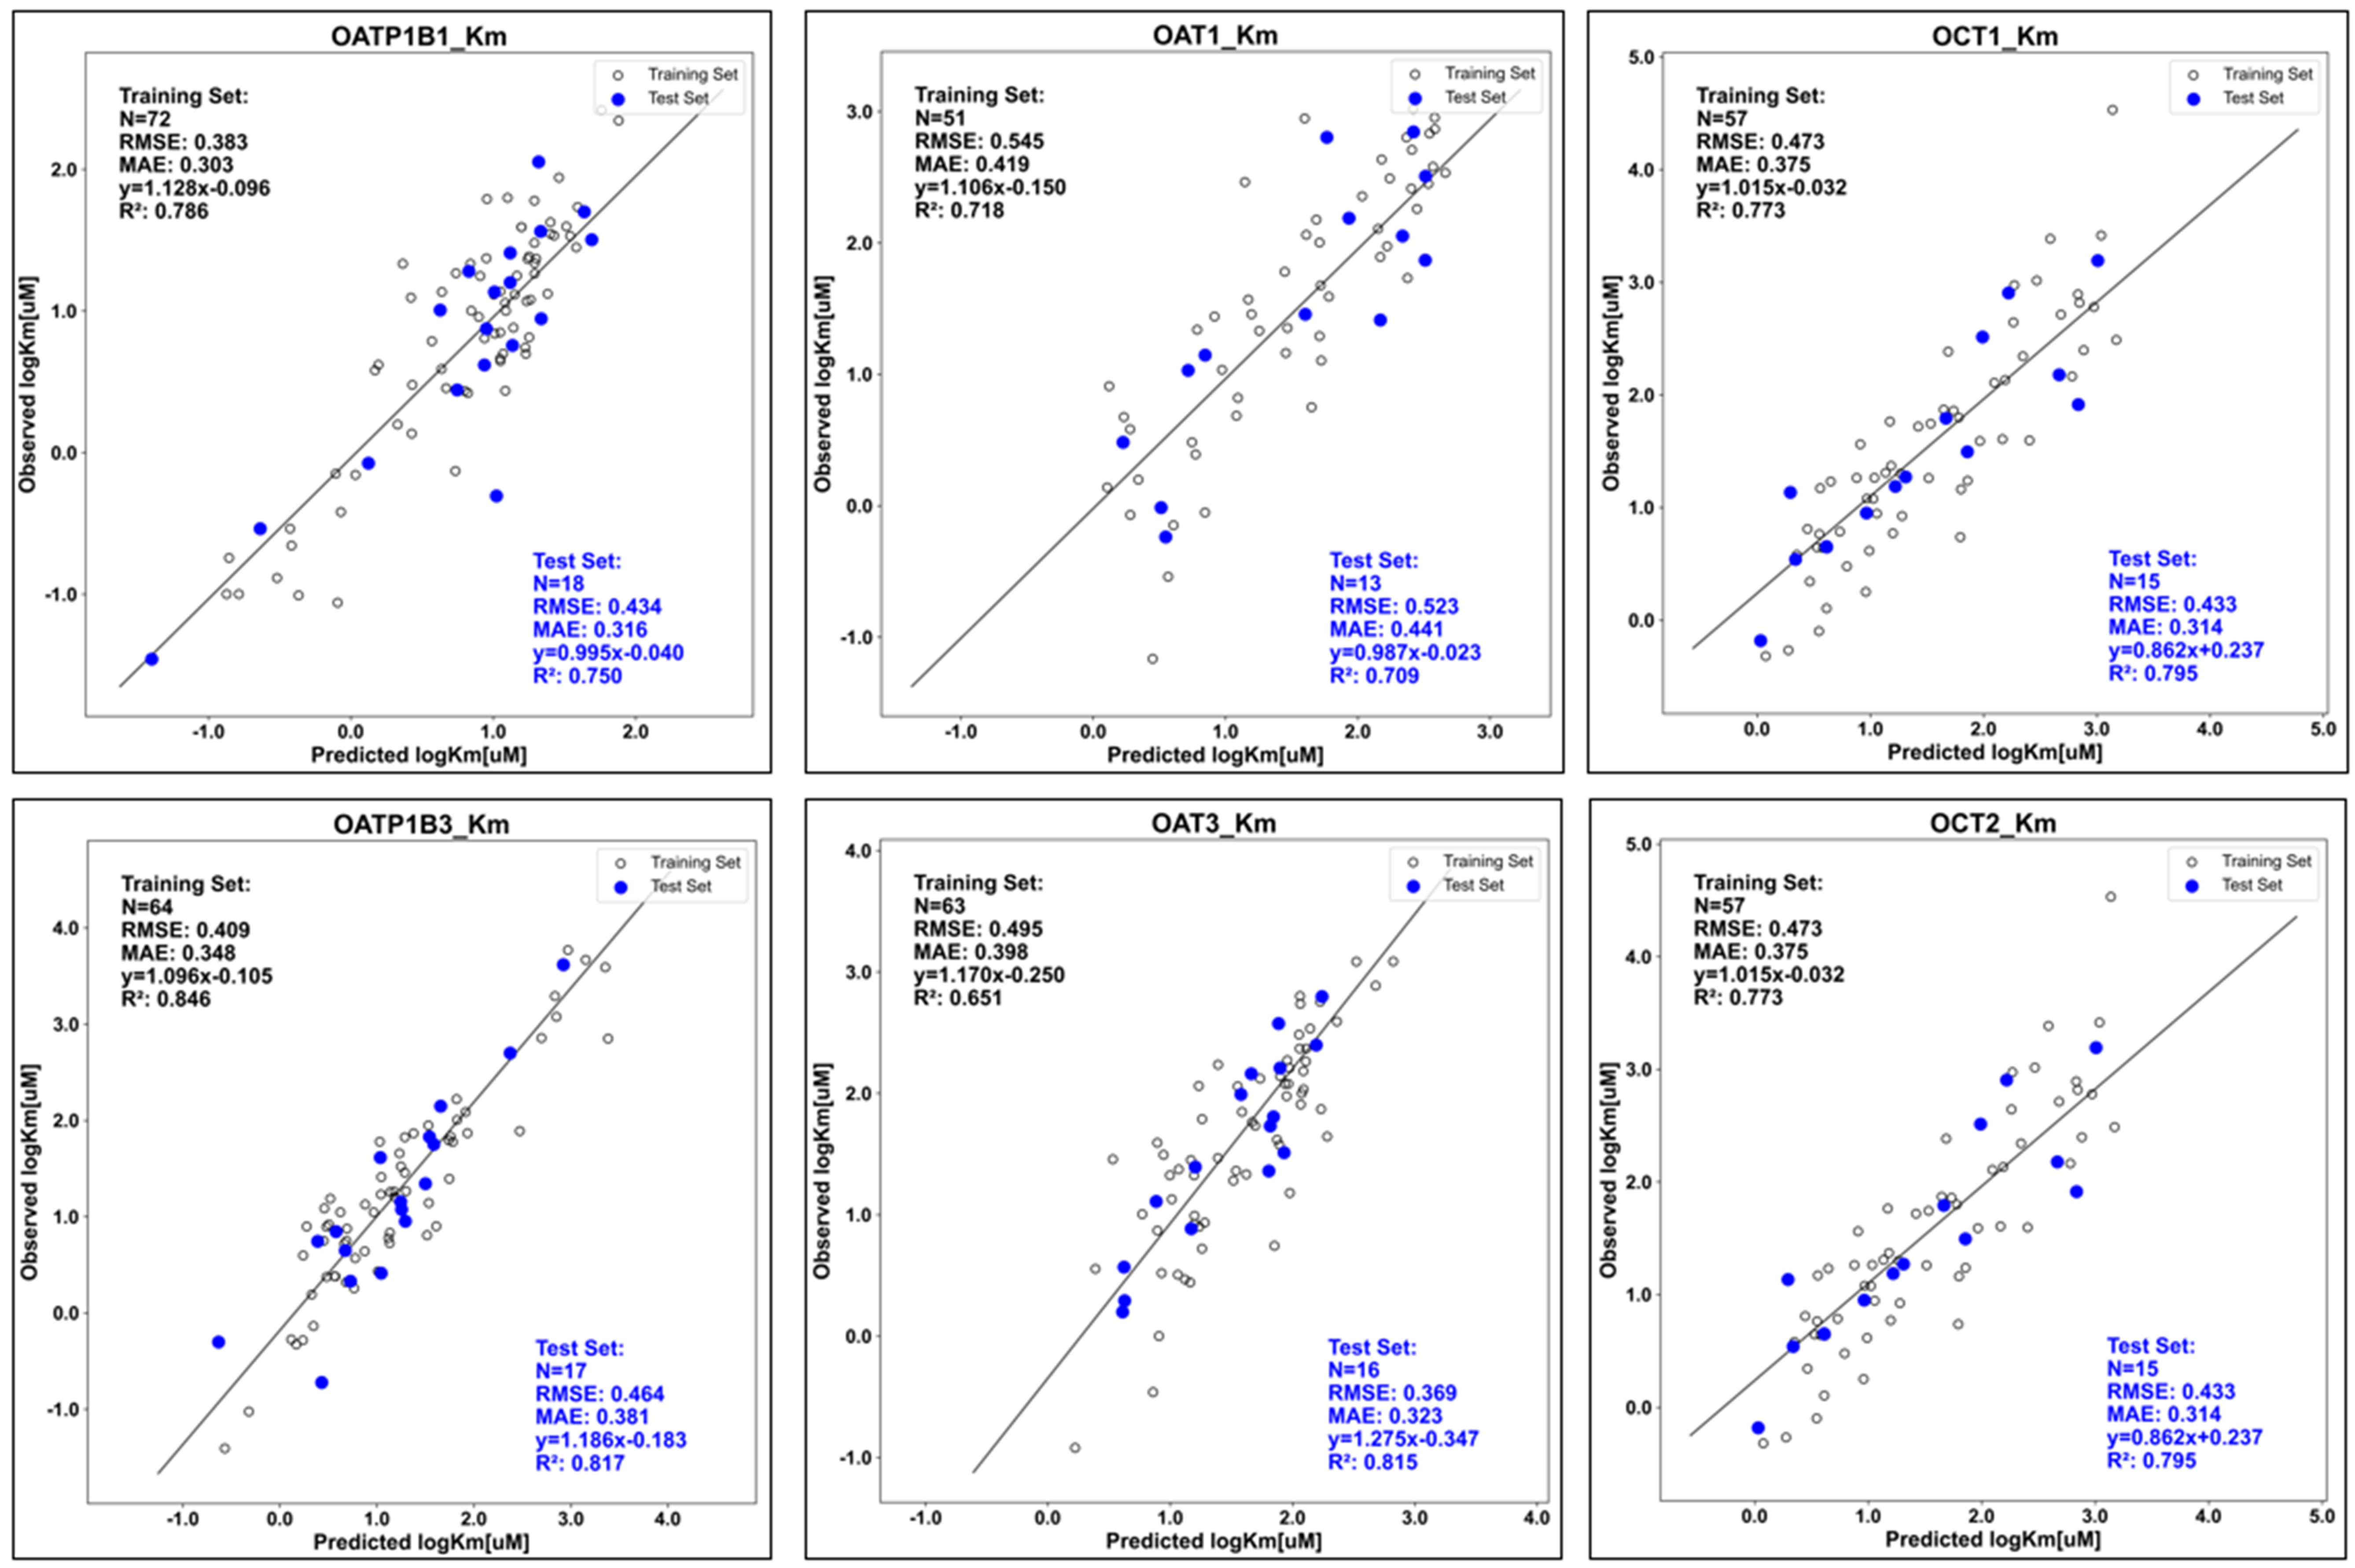
Twenty percent of the dataset was kept aside as an external test set and remaining compounds were used to train the regression models. The models were built in log space for Km. The overall RMSE, of models, for corresponding test sets ranged from 0.39 to 0.56. The figure below shows the experimental Km plotted against predicted Km. The solid lines in the plots are regression lines for test set while the dotted line represents the line of unity.
These models were built primarily for converting inhibitory IC50s to Ki's to aid in inhibitor / non-inhibitor categorization. Some care needs to be used in applying them, bearing in mind the potential for complicated kinetic phenomena such as trans inhibition occurring once transported substrates get inside a cell (Shitara & Sugiyama 2017; Tatrai 2019).