2.6.3. Transporter Inhibition Models
Inhibition of membrane transport of a medication already on the market by a newly introduced drug can lead to overdosing or loss of efficacy, depending on whether it is an efflux or an uptake transporter that is inhibited. One example is atorvastatin's ability to trigger accumulation of digoxin to cardiotoxic levels by inhibition of P-gp. Similarly, one drug's inhibition of renal transport by OAT1 or OCT2 may slow the excretion of another into the urine. This is why the FDA and the EMA recommend that any new drug be tested for its ability to inhibit key transporters as part of the approval process.
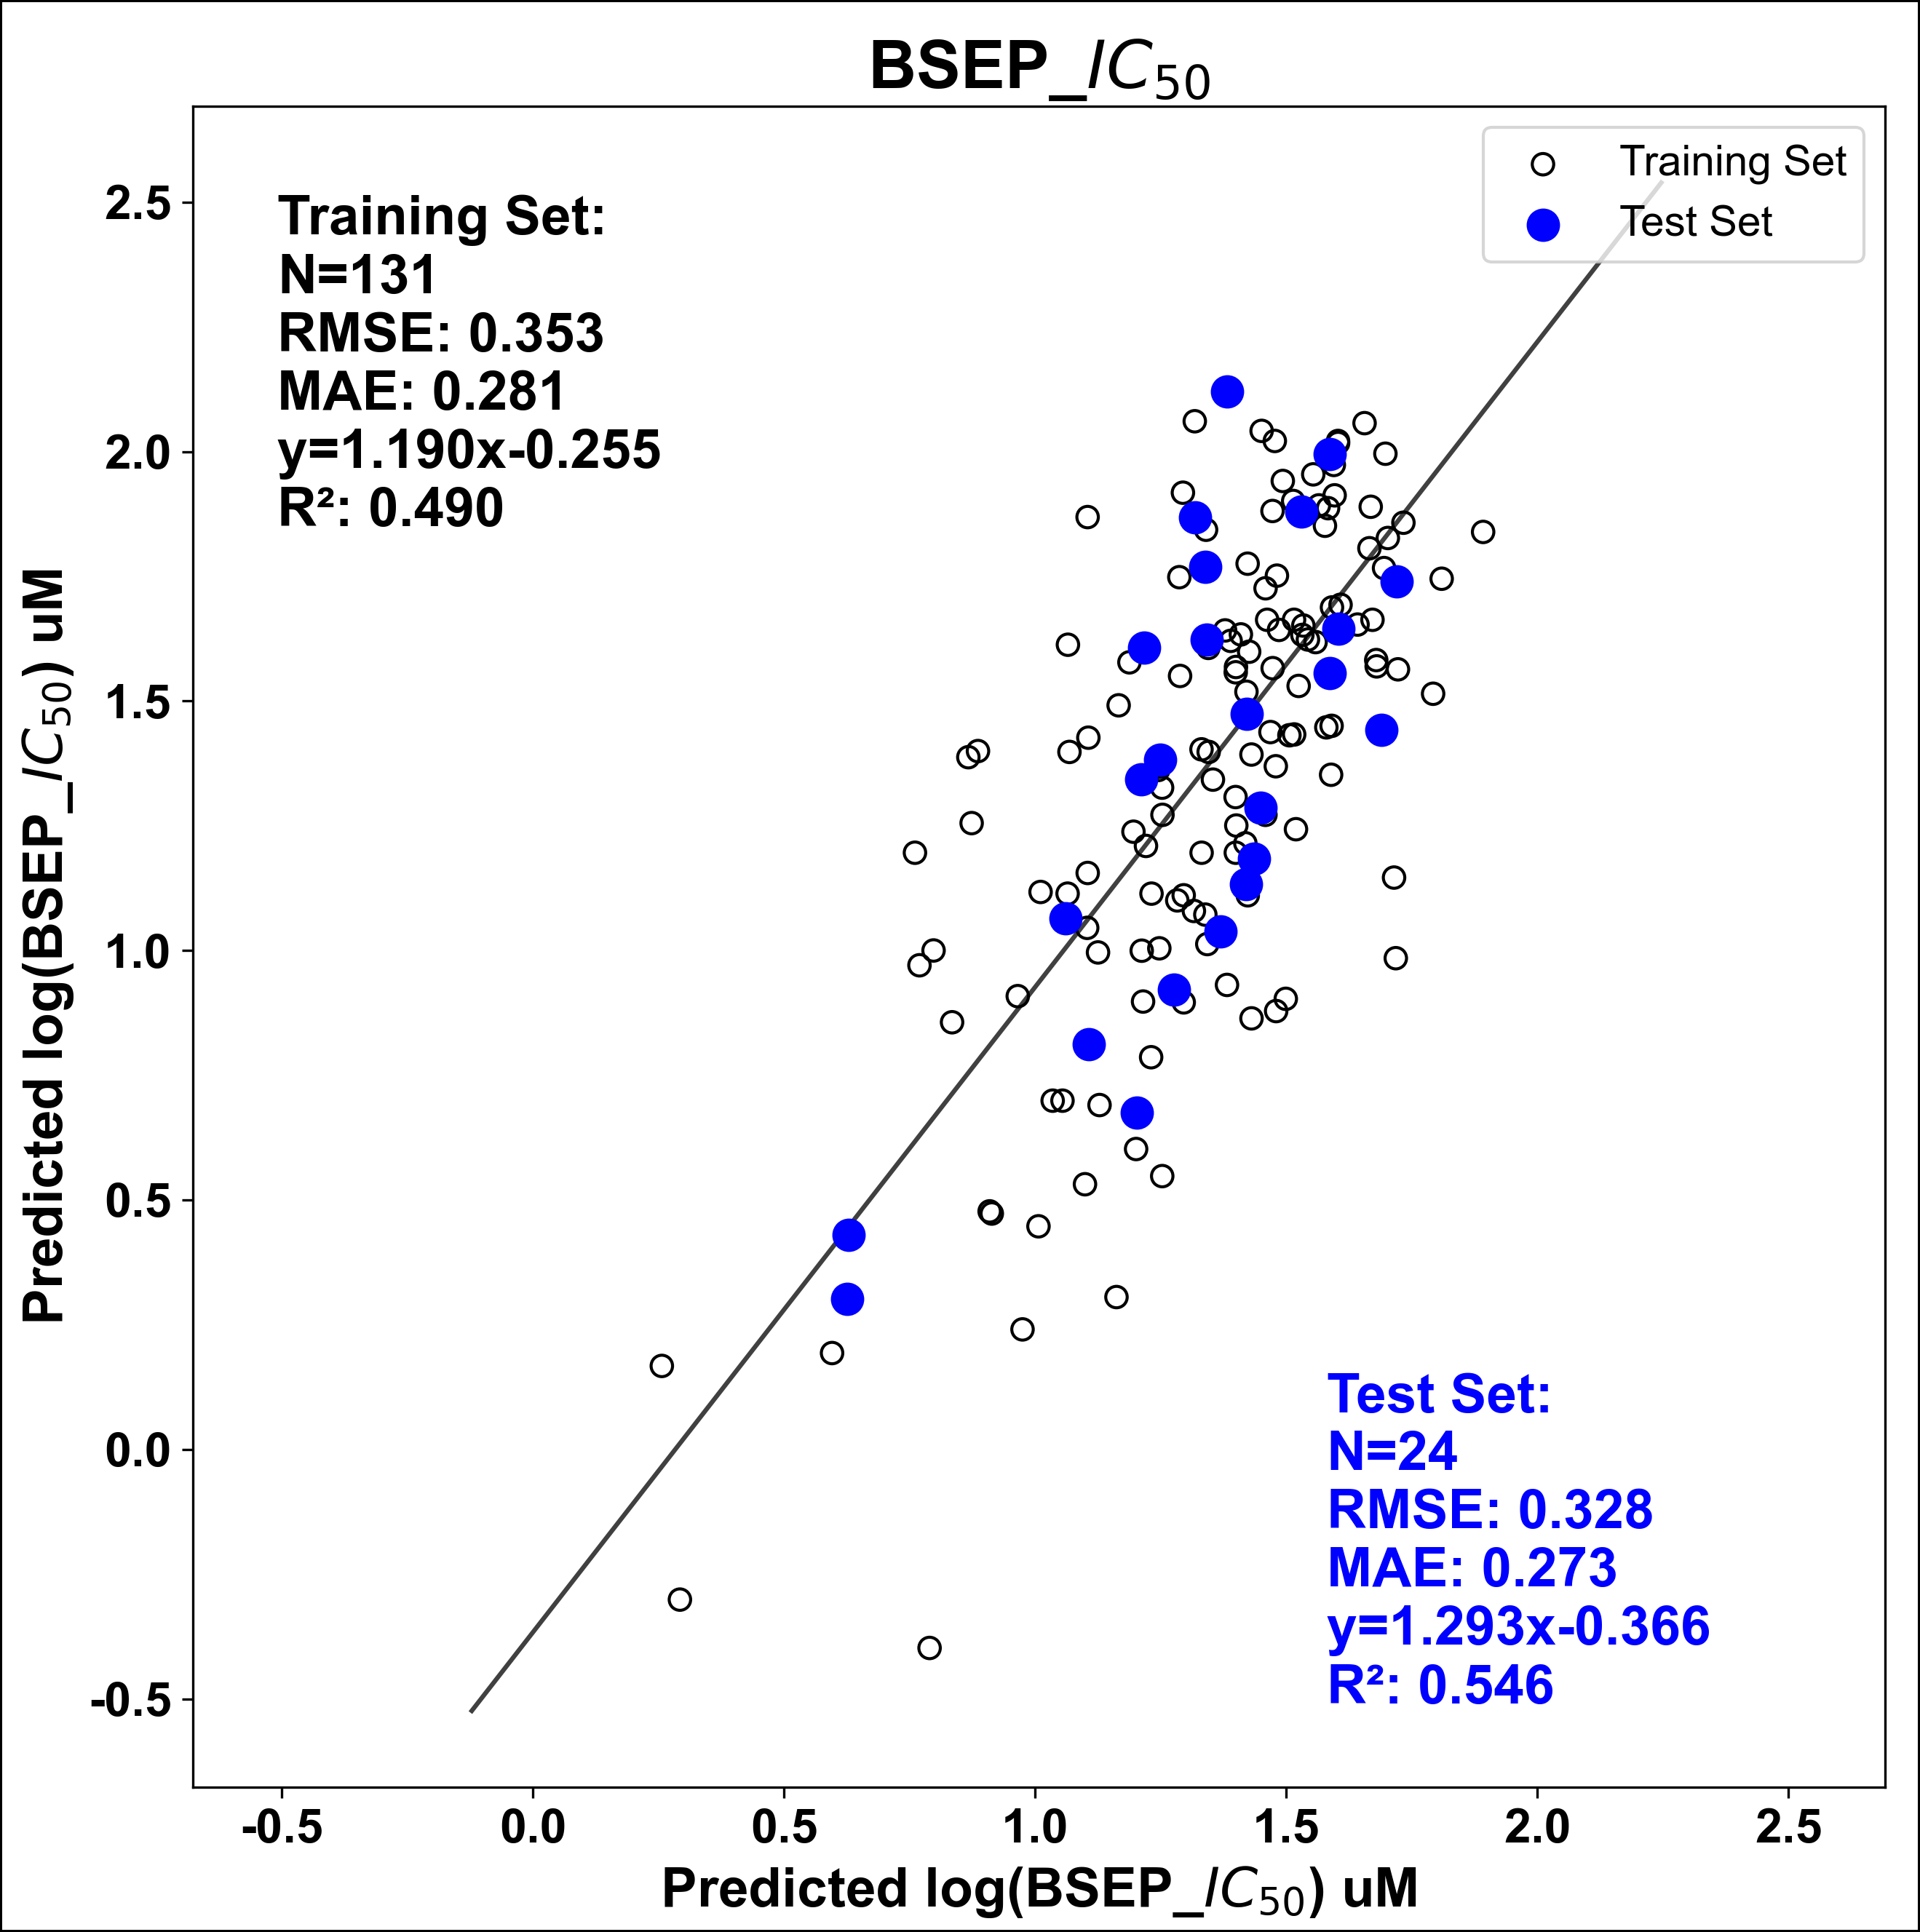
ADMET Predictor offers nine different classification models for predicting how likely a compound is to inhibit a transporter that has been identified as having regulatory significance. They cover two efflux transporters (P-gp and BCRP) and seven uptake transporters: OATP1B1, OATP1B3, OAT1, OAT3, OCT1, OCT2, and BSEP. A regression model - [BSEP_IC50] - provides quantitative estimates of inhibitory potency for BSEP.
Efflux Inhibitors
Several data compilations are available for compounds that inhibit P-gp and BCRP. One way to evaluate inhibition is to measure the ability of a test compound to reduce the differential permeability (i.e., the "efflux ratio") of a probe substrate across monolayers of Caco-2 cells (which have relatively high expression levels of P-gp) or of MDCK cells transfected with genes for one or the other transporter. Another way is to look for enhanced net uptake of substrate into transfected cells. The existing data sets were further augmented with the data that we compiled from open literature. It bears noting that careful curation of these data was essential.
As noted above, getting Km's for efflux substrates is generally not practical because the critical substrate concentration is that inside the cell, which is only indirectly related to the concentration of substrate in the incubation medium. That means that IC50's cannot readily be converted to Ki's, which complicates curation. Another complication is that the binding cavity in these proteins is rather large and promiscuous by nature, which can lead to alternative binding modes for substrates and inhibitors. When that happens, whether a compound gets categorized as an inhibitor or not may depend to some extent on the substrate used to test it.
Pgp_Inh: We started with data on 1214 compounds taken from the publication of Broccatelli et al. (2011), who collected them from the open literature and from the NIHM Psychoactive Drug Screening Program (PDSP). We re-curated it, correcting ~4% of the structures found therein. We also made use of a data set compiled by Chen et al (2011) and data from a book chapter by Yurong Lai (2013).
These data sets were merged and redundant entries were eliminated. Conflicting categorizations were found for 29 compounds, which were set aside and not included in the model building process. The consolidated data set consisted of 1310 P-gp inhibitors and 785 non-inhibitors. Performance statistics for the Pgp_Inh model are shown in the table below.
BCRP_Inh: Literature data for compounds for which titration data were available were curated and used to categorize compounds as inhibitors or non-inhibitors based on whether their Ki or IC50 fell below or above 10 µM, respectively. This in-house compilation was merged with data for 978 compounds compiled by Montanari et al., who provide an excellent overview of the technical challenges involved in curating the literature on the topic. In this case, data for 30 compounds with conflicting categorizations were set aside, leaving 991 inhibitors and 745 non-inhibitors in the consolidated data set. Performance statistics for the BCRP_Inh model are shown in the table below.
Uptake Inhibitors
For uptake inhibition, we collected titration data on Ki and IC50 as well as single point %inhibition data on transporters of interest. The latter two were converted to Ki values based on the concentration of the substrate whose transport was being inhibited and its affinity for the transporter (i.e., its Km). We used the Cheng-Prusoff equation to estimate the Ki:
where S is the substrate concentration and IC50 was determined directly or calculated from the single point %inhibition values I:
When no experimental Km was available for the substrate, we used the Km values predicted by the models described above.
OATP1B1 and OATP1B3
Among the more notorious of the OATP1B1 inhibitors is cyclosporine A, which is the "perpetrator" in several significant adverse drug-drug interactions (DDIs). The AUC of pravastatin (a DDI "victim"), for example, increases 890% when it is co-administered with cyclosporine A.
Our earlier OATP1B1 inhibition model was based on data from Karlgren et al. (2012) and a group from Chongqing Medical University and Center South University that included 136 natural products (Wu et al. 2012). We had dropped silymarin from the data set because the experimental results varied widely (94.5% at 20 μM compared with 29.9% at 100 μM). Morin was retained. The data sets used to construct our current models included these plus several hundred more from the open literature, including IC50 values reported by De Bruyn et al. (2013). They provided single point inhibition data for many more compounds as well; unfortunately, we were unable to reconcile those values with Ki's and IC50's from other sources, so those data were not used here.
As described above, we used the Cheng-Prusoff equation to calculate Ki's from IC50's where necessary. When no experimental Km was available, we predicted Km using our own Km models. The compounds were classified as inhibitors and non-inhibitors using a categorization threshold of 20 µM.
The final OATP1B1 data set included 330 inhibitors and 290 non-inhibitors, whereas the final OATP1B3 data set consisted of 219 inhibitors and 249 non-inhibitors. An artificial neural network ensemble classification (ANNC) model was built for each with 20% of the compounds held out as a test set. Performance statistics for the models obtained are shown in the table below.
OAT1 and OAT3
We compiled the data for OAT1 and OAT3 inhibition from open literature as well as from the DIDB database hosted by the University of Washington. Ki or IC50 values were collected for 870 OAT1 inhibitors and 833 OAT3 inhibitors. Values obtained from assays against mutant and non-human proteins were discarded. Meta-data regarding the probe substrate used, its concentration and the concentration of the test compound were extracted manually. Where titration data was not available, single point %inhibition data was used to calculate IC50 as described above, and IC50 values were converted to Ki values using the Cheng-Prusoff equation. A threshold of 20 µM was used to differentiate inhibitors from non-inhibitors.
The final OAT1 data set included 106 inhibitors and 199 non-inhibitors, whereas the final OAT3 data set was comprised of 138 inhibitors and 170 non-inhibitors. Performance statistics for the models obtained are shown in the table below.
OCT1 and OCT2
We compiled OCT1 inhibitor data on 816 compounds from the open literature as well as from the DIDB. The data was processed to remove compounds that had been assayed against mutant or non-human proteins. IC50 values were converted to Ki values using the Cheng-Prusoff equation. Compounds were then categorized as inhibitors or non-inhibitors based on a threshold Ki of 20 µM. The final dataset was made up of 147 inhibitors and 108 non-inhibitors. Performance statistics for the OCT1_Inh that resulted are given in the table below.
Kido et al. (2011) performed OCT2 inhibition experiments using uptake of the OCT2 model substrate (4-(4-(dimethylamino)styryl)- N-methyl-pyridinium, ASP+) into intact HEK293 cells stably expressing human OCT2. They screened 910 drugs and drug-like molecules in triplicate and reported the mean %inhibition of ASP+ uptake. The 244 compounds that showed more than 50% inhibition when tested at 20 μM were characterized as inhibitors by the authors.
We used the single point %inhibition data to calculate IC50 values as described above, then calculated Ki's from those using the Cheng-Prusoff equation. The compounds were categorized as inhibitors or non-inhibitors based on a threshold of 20 µM, which corresponds to 47% inhibition. Next, we set aside compounds with %inhibition between 47±11 as being within experimental error of the threshold we were using - i.e., as being in a “gray area.” Other data points were removed because they were not statistically significant from 0 (e.g., with an SD at least twice as large as the mean %inhibition).
The final data set consisted of 615 compounds. Of these, 89 (17%) were set aside as a test set. The remaining 526 compounds were used to train the OCT2_Inh model, which exhibited the performance statistics shown in the table below.
|
Model |
Set |
Negatives |
Positives |
Total |
Correct |
Concordance |
Sensitivity |
Specificity |
|---|---|---|---|---|---|---|---|---|
|
BCRP_Inh |
Training |
605 |
783 |
1387 |
1218 |
87.8% |
88.3% |
87.2% |
|
Test |
140 |
208 |
349 |
300 |
86.0% |
85.4% |
86.7% |
|
|
PGP_Inh |
Training |
635 |
1041 |
1676 |
1485 |
88.7% |
89.0% |
88.0% |
|
Test |
150 |
269 |
419 |
364 |
86.9% |
88.5% |
84.0% |
|
|
OATP1B1_Inh |
Training |
232 |
264 |
496 |
463 |
93.3% |
93.2% |
93.5% |
|
Test |
58 |
66 |
124 |
113 |
91.1% |
87.9% |
94.8% |
|
|
OATP1B3_Inh |
Training |
192 |
182 |
374 |
320 |
85.6% |
85.7% |
85.4% |
|
Test |
57 |
37 |
94 |
83 |
88.3% |
86.5% |
89.5% |
|
|
OCT1_Inh |
Training |
86 |
118 |
204 |
169 |
82.8% |
86.4% |
77.9% |
|
Test |
22 |
29 |
51 |
45 |
88.2% |
86.2% |
90.9% |
|
|
OCT2_Inh |
Training |
367 |
159 |
526 |
473 |
89.9% |
90.6% |
89.6% |
|
Test |
63 |
26 |
89 |
78 |
87.6% |
88.5% |
87.3% |
|
|
OAT1_Inh |
Training |
159 |
85 |
244 |
215 |
88.1% |
91.8% |
86.2% |
|
Test |
40 |
21 |
61 |
55 |
90.2% |
90.5% |
90.0% |
|
|
OAT3_Inh |
Training |
136 |
110 |
246 |
214 |
87.0% |
86.4% |
87.5% |
|
Test |
34 |
28 |
62 |
55 |
88.7% |
89.3% |
88.2% |
|
|
BSEP_Inh |
Training |
415 |
108 |
523 |
472 |
90.2% |
89.8% |
90.4% |
|
Test |
73 |
19 |
92 |
80 |
87.0% |
89.5% |
86.3% |
BSEP
Data from Morgan et al. was used to build a bile salt export pump classification model that predicts whether or not a compound will inhibit taurocholate transport by BSEP with an IC50 less than 60 µM. The 615 compounds it contained covered a tremendous dynamic range: 450 had an IC50 value above 133 µM, whereas pioglitazone - the most potent inhibitor in the data set - had an IC50 of only 0.4 µM. The data set was also rather unbalanced, in that it contained only 127 positives versus 488 negatives; only 21% were BSEP inhibitors.
An examination of the distribution of inhibitory activity across S+logP showed that it was skewed to higher hydrophobicities for BSEP inhibitors: the average S+logP for the 127 BSEP inhibitors was 3.9 whereas the S+logP of the non-inhibitors was 1.6. Hence S+logP was included in the descriptor pool. An ANNE model was built with 15% of the compounds in the test set. The performance of the BSEP_Inh model obtained is shown in the table above.
A companion BSEP_IC50 regression model for IC50 was created using the 155 compounds with IC50 values less than 133 µM. The model was trained on 131 of those compounds, with 24 held out as an external test set. A plot of the log of the observed versus predicted BSEP IC50 values is shown below.