

4.3.2. Data Spreadsheet
In addition to the depiction column, the following columns are available within the R Tables tab spreadsheet:
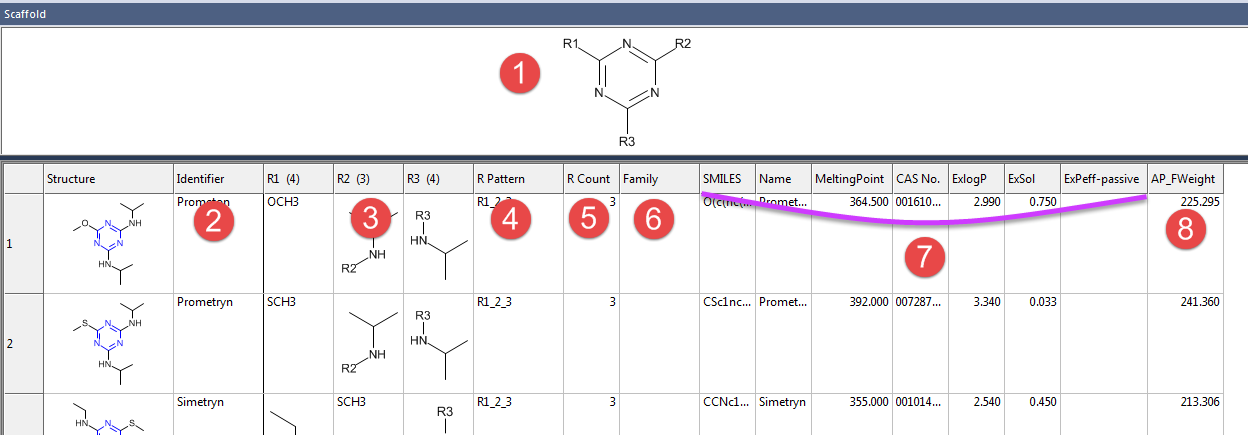
(1) Scaffold [Separate window, not a column] displays the R table scaffold with designated attachment points.
(2) Identifier is the name of the molecule.
(3) R Group. Designated Rn, where n is the one-offset index of the R group. This column shows either a graphical depiction of the R group or its text representation, the latter being reserved only for simple groups such as CH3. A value of “---“ indicates a missing group, which can occur, for example, when an atom in one of the molecules has an unusual valence state.
(4) R Pattern indicates which of a molecule’s R groups contain at least one heavy atom. For example, “R1_3_6” indicates that the molecule has substitutions at the R1, R3 and R6 positions, while all other positions either have Hydrogen atoms or are empty positions. Sorting on this column provides a convenient way to partition the molecules into groups based on similar structures.
(5) R Count is the number of the molecule’s R groups containing at least one heavy atom. Sorting on this column provides a convenient way to partition the molecules into groups based on similar structures, particularly since ties in the R count are broken by R pattern.
(6) Family is the index of the family assigned to the molecule using the [RTABLES>>Generate R Group Families] menu item.
(7) User-Defined Attributes. If you have loaded molecule attributes, these attributes can be displayed in the spreadsheet using this selection.
(8) AP_FWeight is the compound's formula weight, which is equal to the molecular weight for single component compounds.