

4.3.5. The R Group Analyzer
The R Group Analyzer allows you to visualize the unique substituents at each R position and the average molecule properties that are associated with those substituents. This can be extremely useful for determining which R substituents are the most promising. To launch a new R Group Analyzer window, use the menu item R TABLES>>Display R Group Analyzer
This window can also be launched by clicking the icon shown below, which is available only if the R Tables tab is currently active.

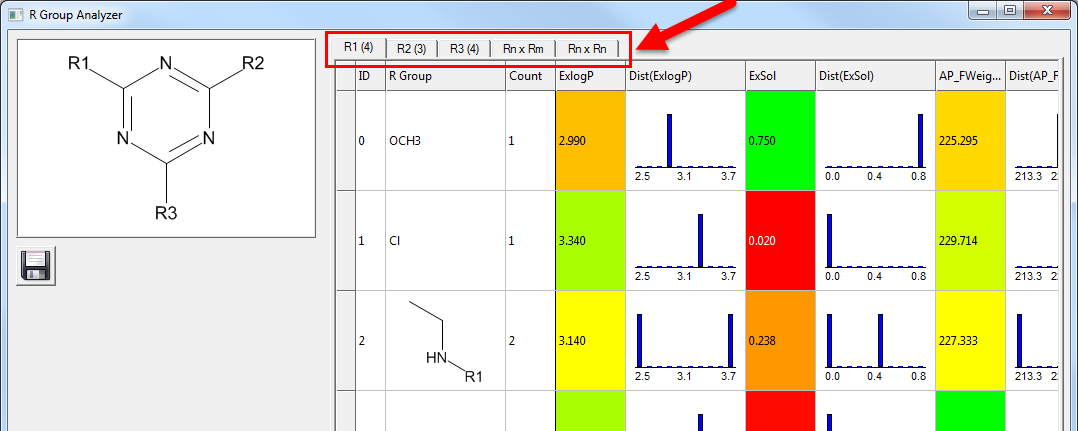
The newly generated window contains multiple tabs (indicated with a solid red arrow in the figure), one for each of the R groups and the last two for matrices. The spreadsheet in each of the R-based tabs displays the unique substituents at the relevant R position. Each row contains the substituent depiction, the number of molecules that contain that substituent, and the average value of various numeric properties associated with the substituent. Spreadsheet cells containing attribute values are colored, the default convention being that high values are green and low ones red. Each property column is followed by one showing a graphical distribution of properties for the molecules containing the particular R group.Note that coloring can be performed on a log scale, but that option must be selected on an attribute-by-attribute basis prior to launching the R Group Analyzer.
The second-to-last tab in this window allows you to visualize an R table as a series of Ri×Rj matrices (e.g., R1×R2), with matrix rows and columns comprised of the observed Ri and Rj substituents, and the matrix interior comprised of color-coded information about the molecules containing those substituents. This type of display can be particularly useful for observing the effects of substituent changes on activity or other properties. An example of these tabs is shown below.
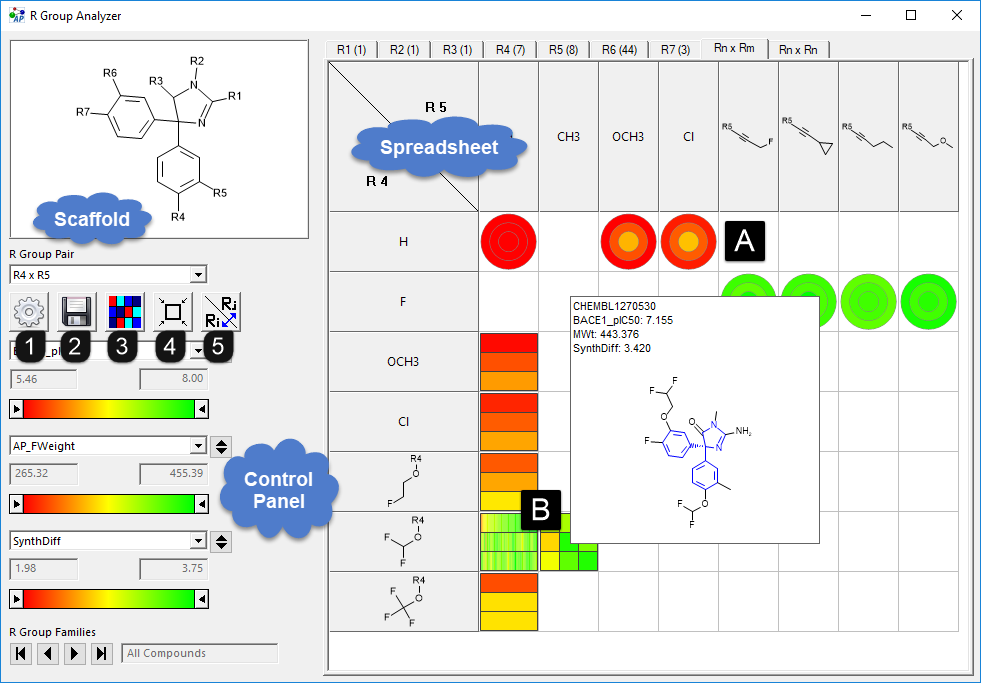
The Rn x Rm tab in the R Group Analyzer view has three main sections.
-
A Scaffold field in the top left corner shows the R table scaffold with substituent attachment points.
-
A Control panel at the lower left is used to perform common tasks related to the spreadsheet. The drop-down list at the top of the window is used to select individual R-group pairs. The contents of the spreadsheet change each time a new pair is selected. Below this list are buttons to change display settings (1), save the selected compounds as SD or SMILES files (2), toggle the grid cells from (A) “circle plots” to (B) “tile plots” (3), adjust spreadsheet row heights and column widths such that the entire spreadsheet fits within the window (4), and swap the positions of the grid rows and columns (5).
The middle left section of the window contains three sets of controls used to specify up to three molecule properties, with the first one chosen automatically. Each additional property that is specified adds a new concentric circle to the circle plots in the spreadsheet. The convention is that the outer-most “ring” of each circle plot corresponds to the first property specified in the control window, the next ring to the next property, and so on. The slider bar below each drop-down list can be used to hide molecules that fall outside of a specified property range. The small button to the right of each property box sorts the spreadsheet by that property. The first click will perform an ascending sort, the second click a descending sort and the third click a return back to the original ordering. Note that sorting will generally rearrange both rows and columns of the spreadsheet.
The bottom of the control panel has buttons to navigate over families. A family is defined as a set of compounds that are identical at all R positions except those shown in the top-left cell of the spreadsheet. As you navigate through the families, all compounds not belonging to the current family will become hidden in the spreadsheet. This allows you to analyze the influence of those R positions not depicted in the upper-left spreadsheet cell. Note that in the case of a markush scaffold, this feature also lets you analyze the influence of the different scaffold structures.
Because the Rn x Rm page shows two R positions in the top-left cell, its definition of a family differs from the one used in the main R Tables tab of ADMET Predictor. In the R Tables tab, a family is a set of compounds that are identical at all R positions except a single one selected by the user. These two types of family are therefore similar, but not identical.
-
A Spreadsheet on the right represents a single pair of R groups (R4 and R5 in the figure above). All observed substituents at these two positions are displayed in the first column and first row of the spreadsheet. In the spreadsheet interior, each circle represents one or more molecules that contain a particular combination of R groups; if more than one molecule has the combination, the circle is partitioned into the appropriate number of wedges. Arcs (or wedges, if appropriate) are colored according to the molecule property value(s) selected in the control window, with green indicating higher property values and red indicating lower values. Note that coloring can be performed on a log scale, but that option must be selected on an attribute-by-attribute basis prior to launching the R Group Analyzer.(Disclaimer: You cannot see "Tile plots" and "circle plots" within same window. This figure has been modified for best illustration purpose.)
The rows and columns can be rearranged by drag-and-drop using your mouse, whereas clicking in the Rn or Rm triangle at the top left corner of the spreadsheet will sort the substituents by molecular weight. The grid can be saved to an SD, SMILES or Excel file by clicking on the save file icon.
Hovering over a circle or wedge using the mouse causes the associated molecule to appear in a temporary pop-up window, whereas double clicking on a cell pops up a separate window displaying the compounds in that cell.
The final Rn×Rn tab in the R Group Analyzer displays a matrix similar to that of the Rn x Rm tab, but it requires selection of only a single R group rather than a pair of them. The rows and columns of the spreadsheet are therefore identical, each showing the unique substituents of the single selected group. For purposes of this discussion, assume that these substituents are labeled a, b, c, etc. The interior of the matrix is different from that of the Rn ×Rm tab, in that each cell represents pairs of compounds rather than individual compounds. Focusing on the upper triangle first, cell (a,b) contains compound pairs in which the first compound has substituent “a” at the selected R group and the second compound has substituent “b”, with the substituents at all other (non-selected) R groups being identical. In this way it is possible to see the effect on compound properties of changing a single R group from one substituent to another. From the above explanation, it should be clear that the diagonal of the matrix will be empty, while the lower triangle will be the mirror image of the upper triangle.
Hovering over a circle or wedge using the mouse causes the associated pair of molecules to appear in a temporary pop-up window, whereas double clicking on a cell pops up a separate window displaying all the compound pairs in that cell. Right-clicking provides a context menu that lets you opt to post a pop-up histogram showing the distribution of property differences between members of each pair. When there are multiple molecular pairs that differ only at substituent Rn, this provides an indication of the range of effect that particular change has across different molecular contexts.
This provides a form of focused molecular pair analysis (MMPA) that allows you to see the effect of substitution changes on measured or predicted properties. It is most useful when applied to matrices that have been generated or augmented using R group explosion, R list explosion or R group replacement.