

2.5.3. BCS/DCS Assignment
BCS classes are defined by their physical properties (Amidon 1995). Class I compounds are highly soluble and highly permeable; class II compounds are poorly soluble and highly permeable compounds; Class III compounds are highly soluble and poorly permeable; and class IV compounds are poorly soluble and poorly permeable. The DCS system (Butler 2010) shifts the dose/solubility boundaries between classes to the right and splits Class II into subclasses IIa and IIb.
BCS and DCS class both depend on solubility and permeability, so we recommend that you estimate these two properties using ADMET Predictor prior to launching the BCS/DCS Explorer window. This step can be skipped if you wish to use experimental values instead of predictions. Once you have the desired properties in the spreadsheet and have selected up to 16 compounds of interest, you can generate classification plots using either TOOLS >> BCS/DCS Explorer or the Shift+C keyboard shortcut. Doing so will launch the BCS/DCS options dialog.
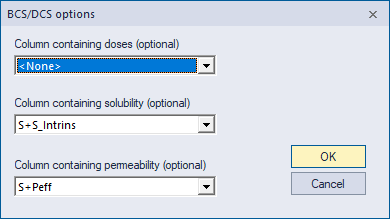
The "Column containing doses" field specifies a column containing one or more dose values. The units are mg and items in a list must be separated by semicolons.
The "Column containing solubility" field specifies the column from which solubility values are to be drawn. The default selection is S+S_Intrins (ADMET Predictor’s prediction of the intrinsic solubility), but you can choose a different ADMET Predictor solubility prediction or a column containing experimental solubilities. The values in that column must be in units of mg/mL.
The "Column containing permeability" field specifies the source of permeability values. The default selection is S+Peff, ADMET Predictor’s prediction of effective human jejunal permeability. Again, you can choose other predictions or experimental values; either way, the values provided must be in units of cm/s x 104.
BCS Chart
Unless you have changed the defaults, a BCS/DCS Explorer window similar to the one shown below will appear after you click OK in the BCS/BDS options dialog. The left side of the window contains a small spreadsheet of the selected compounds and associated doses, solubility and permeability. Double clicking on a cell will allow you to edit its contents interactively, and right-clicking on a column header will let you change the source of the solubility or permeability values – for example, from S+Intrins to S+Sw. The right side of the window will show a four-class BCS chart.
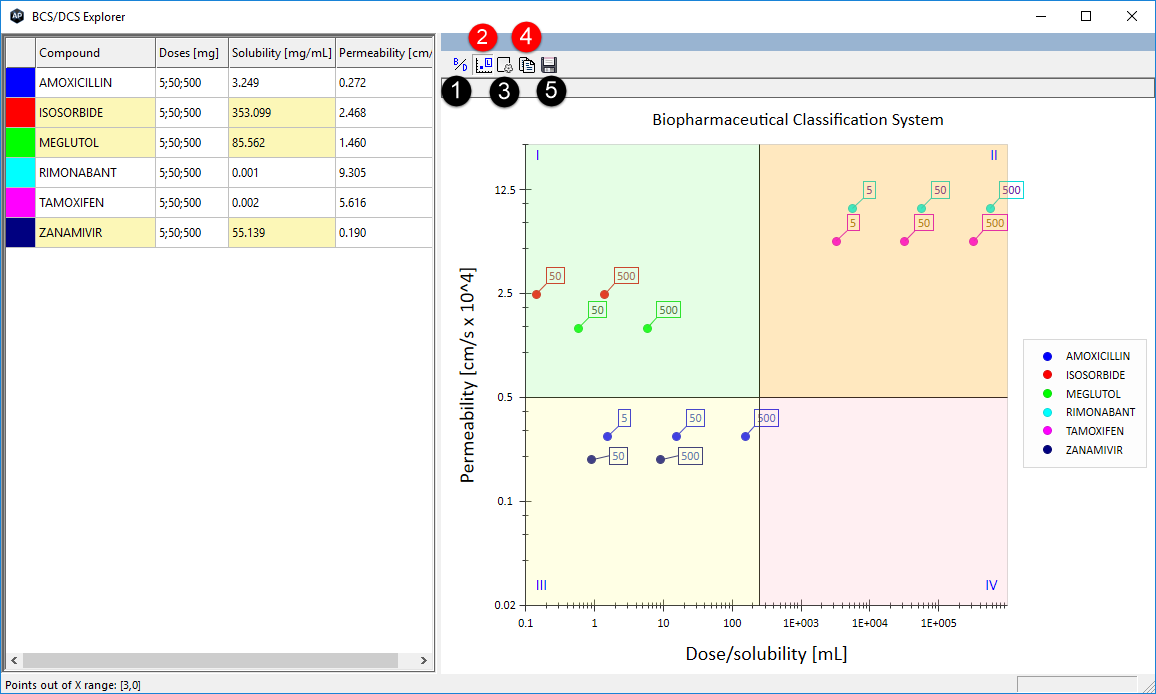
If the \<None> option was specified for doses, the Doses field in the spreadsheet will be populated by the default list of values (here, 5;50;500), which can be modified interactively. Choosing \<None> from the solubility or permeability drop-down lists will populate the corresponding spreadsheet cells with 0's. In that case the plot will be empty until you have supplied non-zero values manually.
The X-axis in the chart is dose divided by solubility, so points representing more soluble compounds at a given dose appear to the left of those representing less soluble compounds. Note that each compound can be represented by more than one point in the chart. The number of points for each compound will be equal to the number of dose values shown in the spreadsheet. In the example shown above, three doses were specified (5, 50 and 500 mg), so each compound is represented by three points. Permeability is not a function of dose, so all points for a given compound will form a horizontal line.
The chart has five toolbar icons at the top.
(1) Toggles from the BCS display shown above to a DCS display DCS display like the one shown below.
(2) Toggles display of dose labels for the points. This is OFF by default.
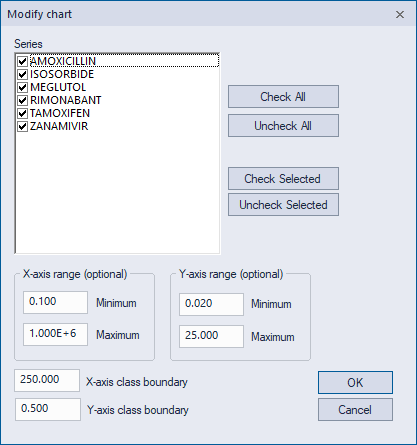
(3) Launches the Modify Chart dialog, which allows you to control whether or not points for a particular compound are displayed in the plot and to change the range of either axis.
(4) Copies the chart as an image for pasting directly into a report.
(5) Saves the chart as an image file in .bmp or .png format.
Points will not show up in the chart if they lie outside the specified axis ranges. When a point cannot be displayed, either the solubility or permeability value in the spreadsheet will have yellow highlighting to indicate that the corresponding property is out of range for some dose. The points for the lowest (5 mg) dose for three compounds (isosorbide, meglutol and zanamavir) are missing from the BCS plot shown above because they fall below the specified X-axis minimum of 0.1.
DCS chart
The B/D icon at the top left of the chart pane lets you toggle from the BCS display to the DCS display shown below.
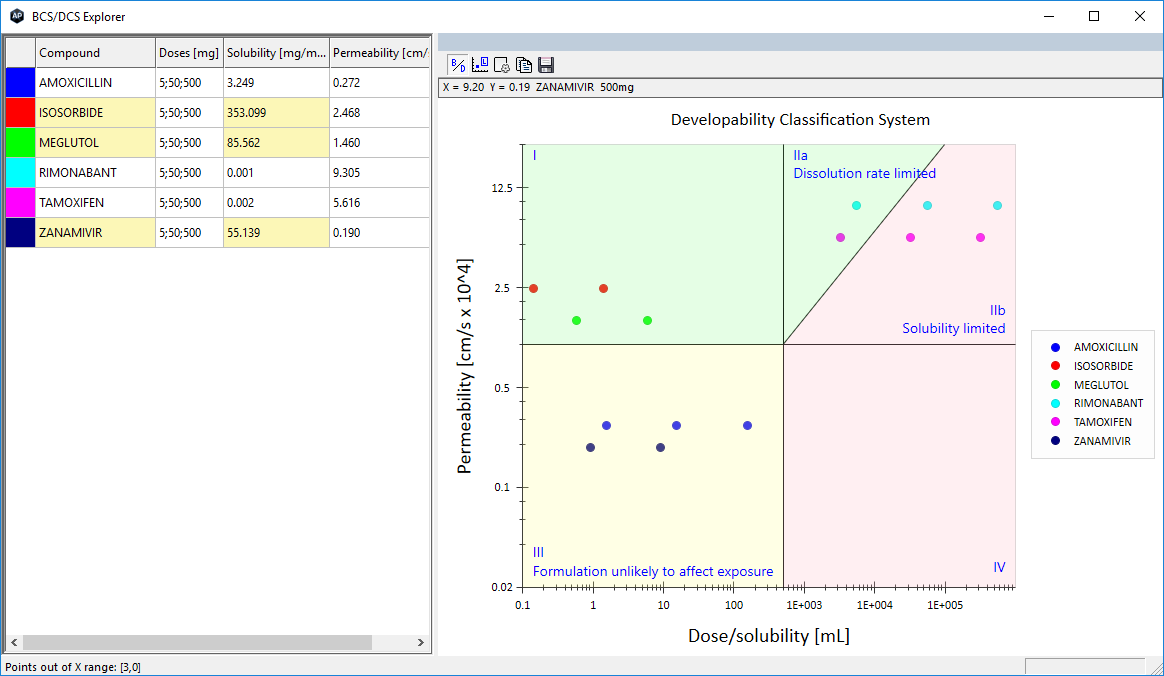
The DCS chart is similar to the BCS chart, but has five classes rather than four, and uses slightly different thresholds. The controls behave the same way for both charts.
Default options
A list of default display options is contained in the file called BCSDCSOptions.txt, which includes a description in the file itself. For example, you can specify whether the BCS or DCS chart is displayed initially, the default solubility and permeability predictions (e.g., S+S_Intrins and S+Peff), default thresholds used to separate classes, and the annotation displayed for the various subclasses.