

2.5.1. Distributional Properties
ADMET Predictor provides models for predicting the amount of drug free in solution under two different physiological conditions: the fraction unbound in human plasma (fup_hum) and the fraction unbound to microsomal membranes (fumic_hum). The latter is used to correct reported values of CYP3A4_HLM_Km, CYP_3A4_HLM_CLint, and CYP_HLM_CLint for microsomal binding. Estimates for the blood:plasma concentration ratio (RBP) and human volume of distribution at the steady state (Vd) are also available.
Fraction unbound in plasma
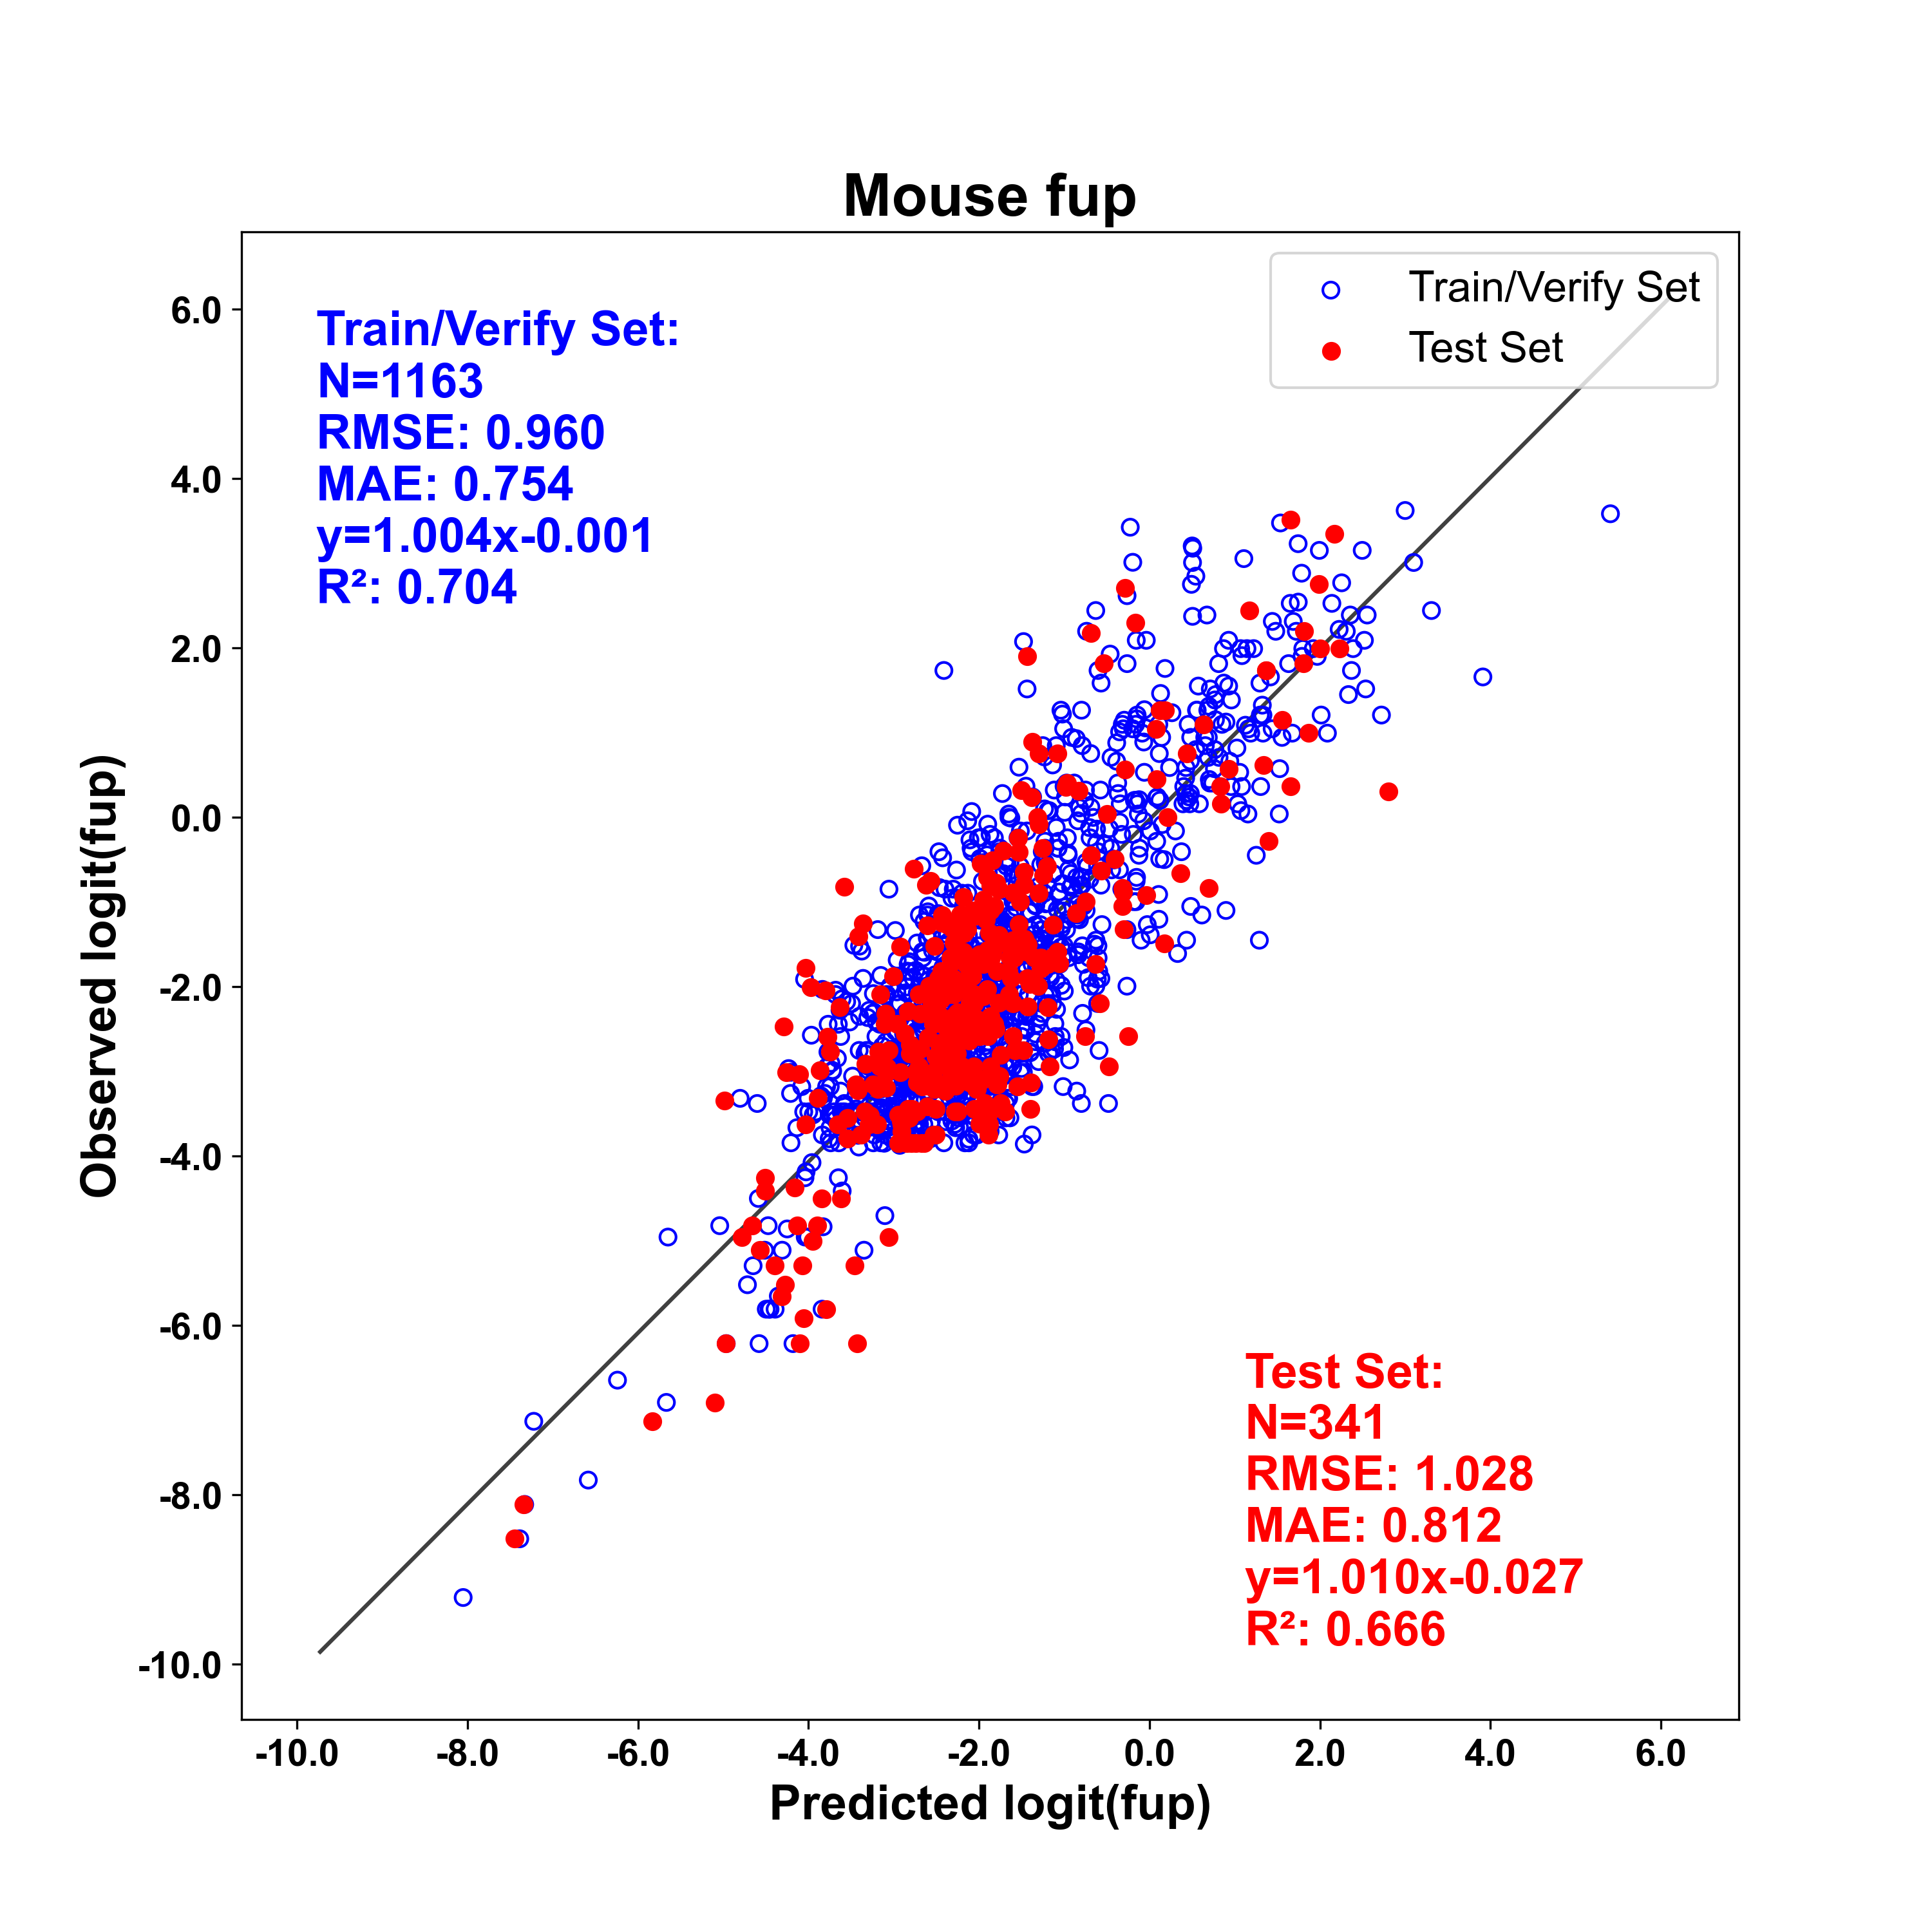
The percentage of drug expected to be free in plasma is a fundamental parameter that influences many aspects of drug distribution and elimination. ADMET Predictor's fraction unbound in plasma (or fup) models estimate this key ratio based on 2D structural descriptors. Fup data was collected from literature sources and ChEMBL, with careful review of each primary literature source to ensure accuracy. The Rat model also contains data for 1264 compounds provided to Simulations Plus by Roche. Compounds from different sources were combined and for compounds that were in more than one dataset, the median value was used. fup_hum, fup_rat, fup_mou, fup_dog, and fup_mky (note that the model names where changed from hum_fup% to fup_hum in ADMET Predictor 14) models were built on the logit transformed values of the data, but predicted values are converted back to linear space in the ADMET Predictor spreadsheet. Note that these models predict percentage unbound in plasma. Subtracting the predicted value from 100% will yield the predicted percentage of drug that is bound – often called plasma protein binding (PPB).
The human model contains 3702 total compounds, of which 773 broke at least one Ro5, including 57 macrocycles and 68 cyclic peptides. The monkey (combined macaca fascicularis and mulatta) model contains 211 total compounds, of which 91 broke at least one Ro5, including 1 macrocycle and 7 cyclic peptides. The dog model contains 562 total compounds, of which 151 broke at least one Ro5, including 2 macrocycles and 4 cyclic peptides. The rat model contains 1794 total compounds, of which 295 broke at least one Ro5, including 22 macrocycles and 7 cyclic peptides. The mouse model contains 1504 total compounds, 521 of which broke at least one Ro5, including 8 PROTACs, 50 macrocycles and 43 cyclic peptides. The number of compounds used for training and test sets, as well as quality metrics are shown in the figures below.
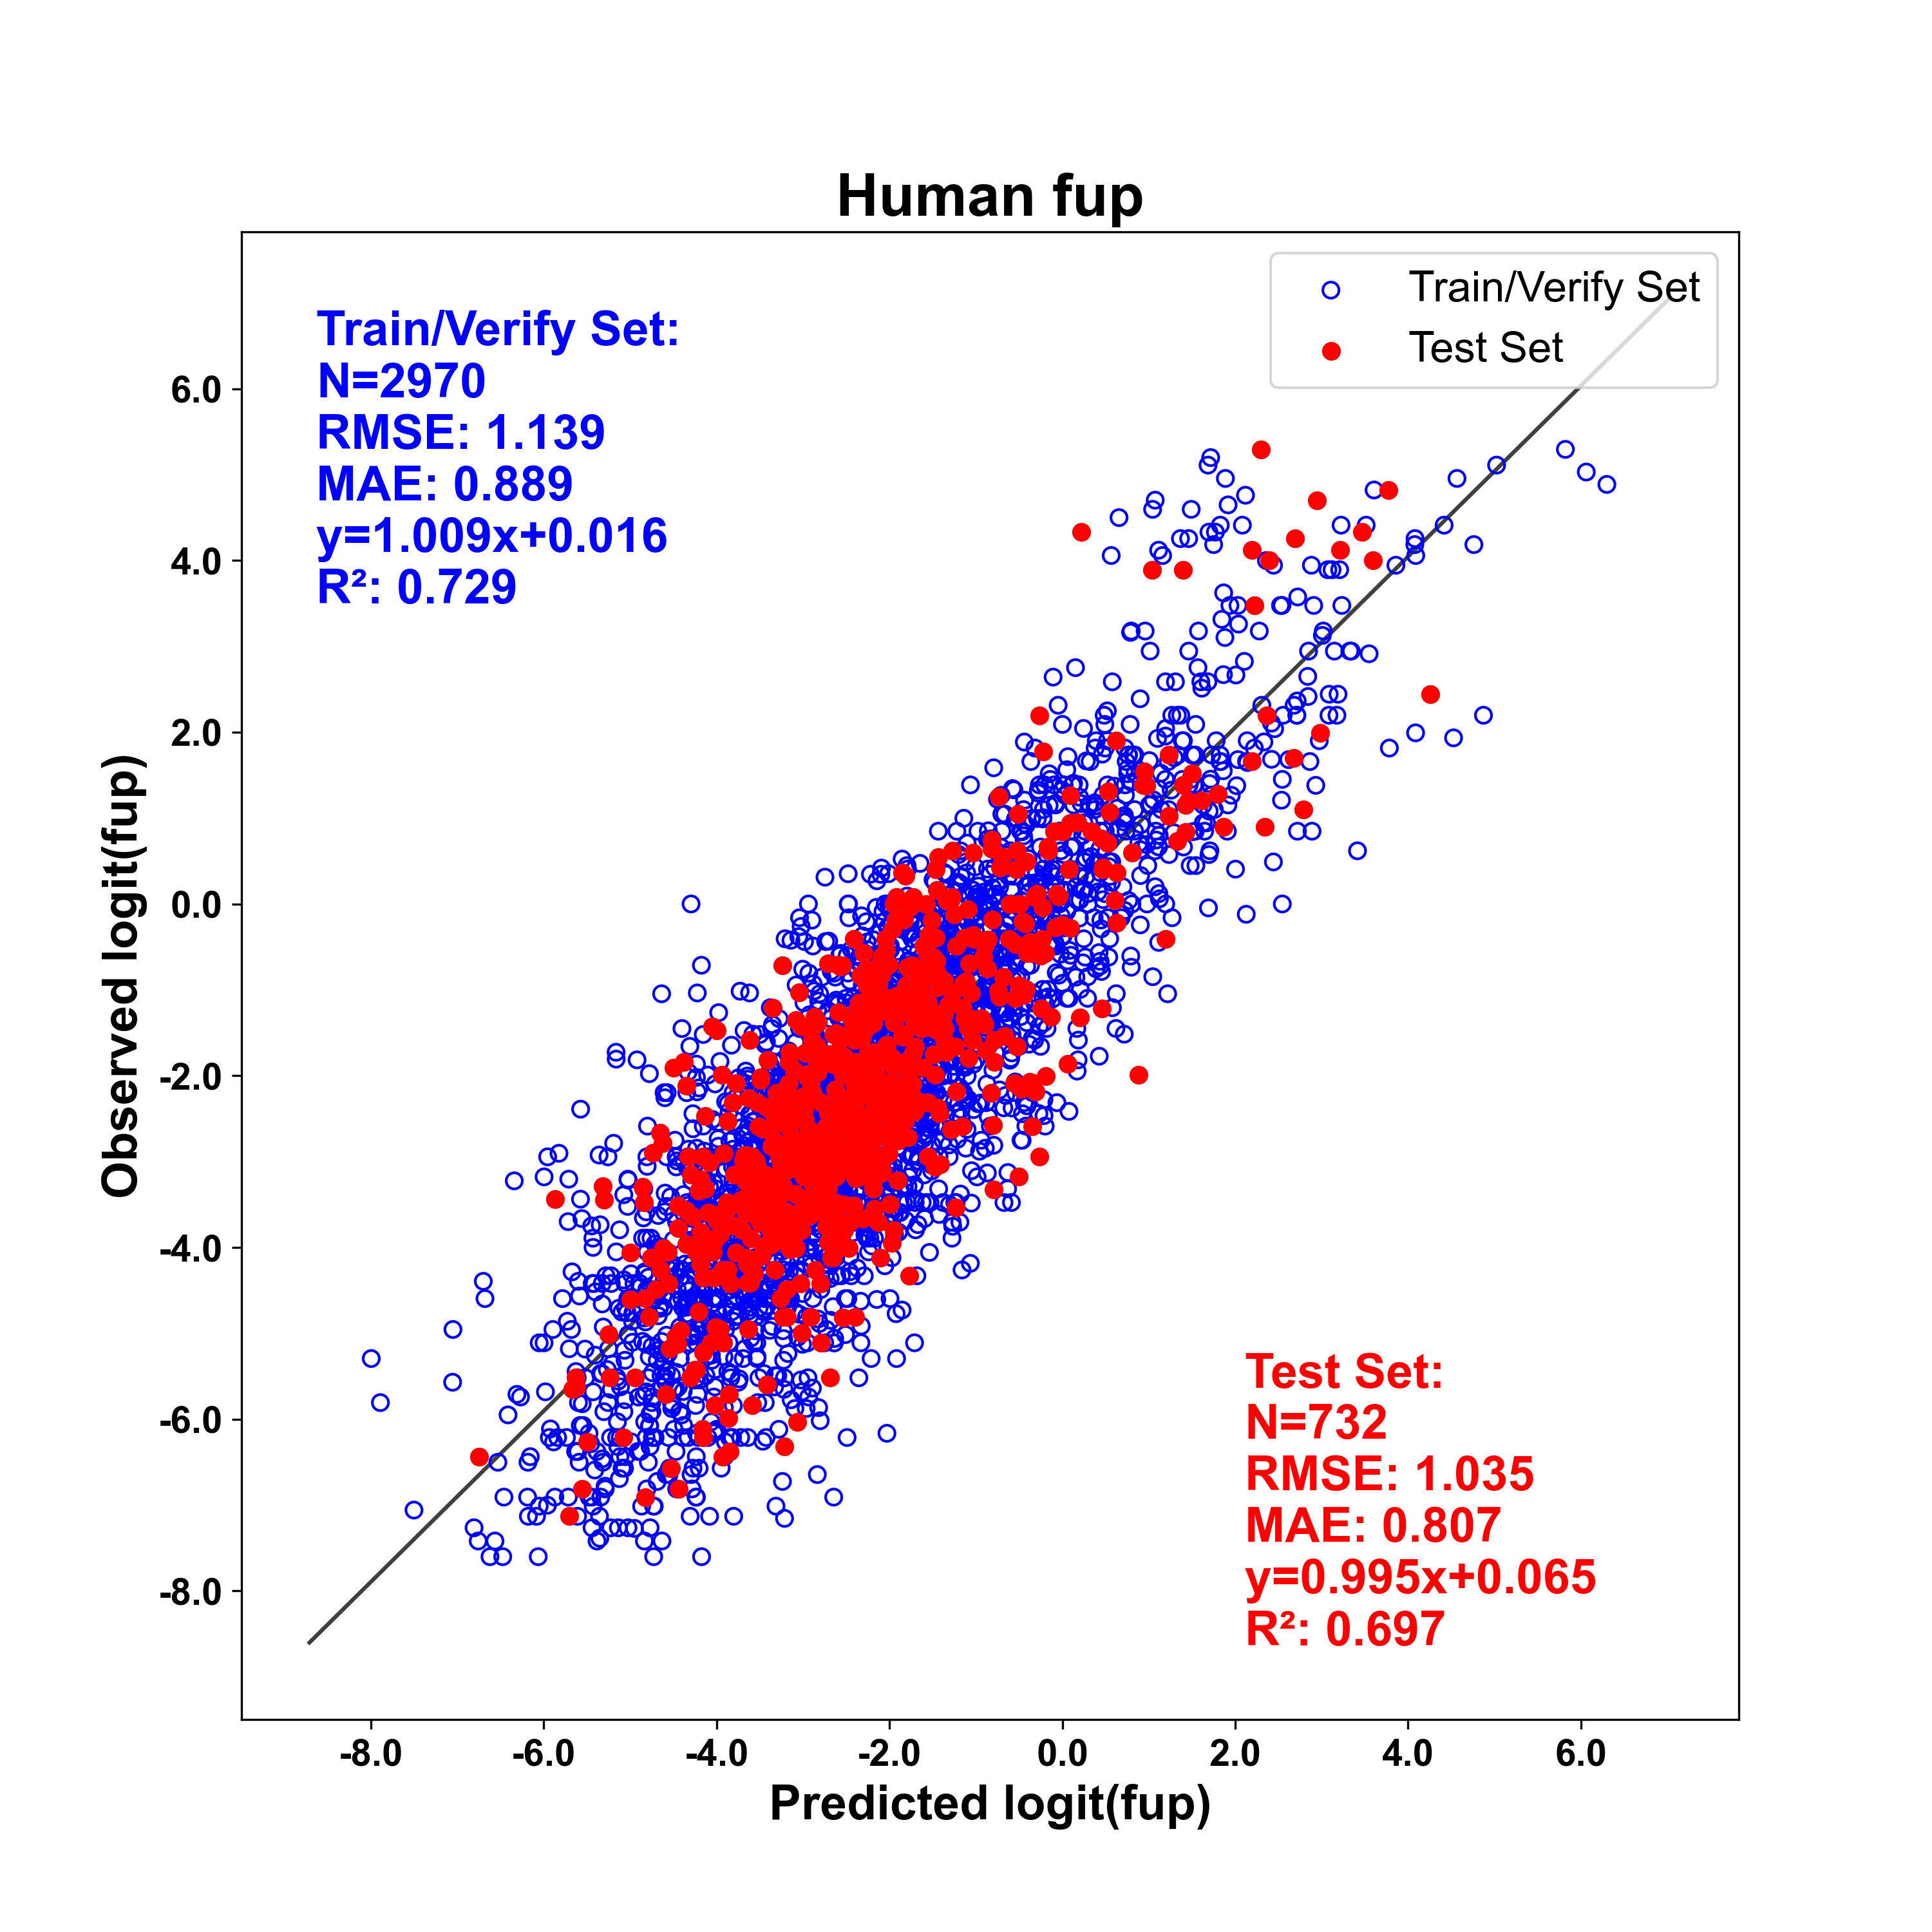
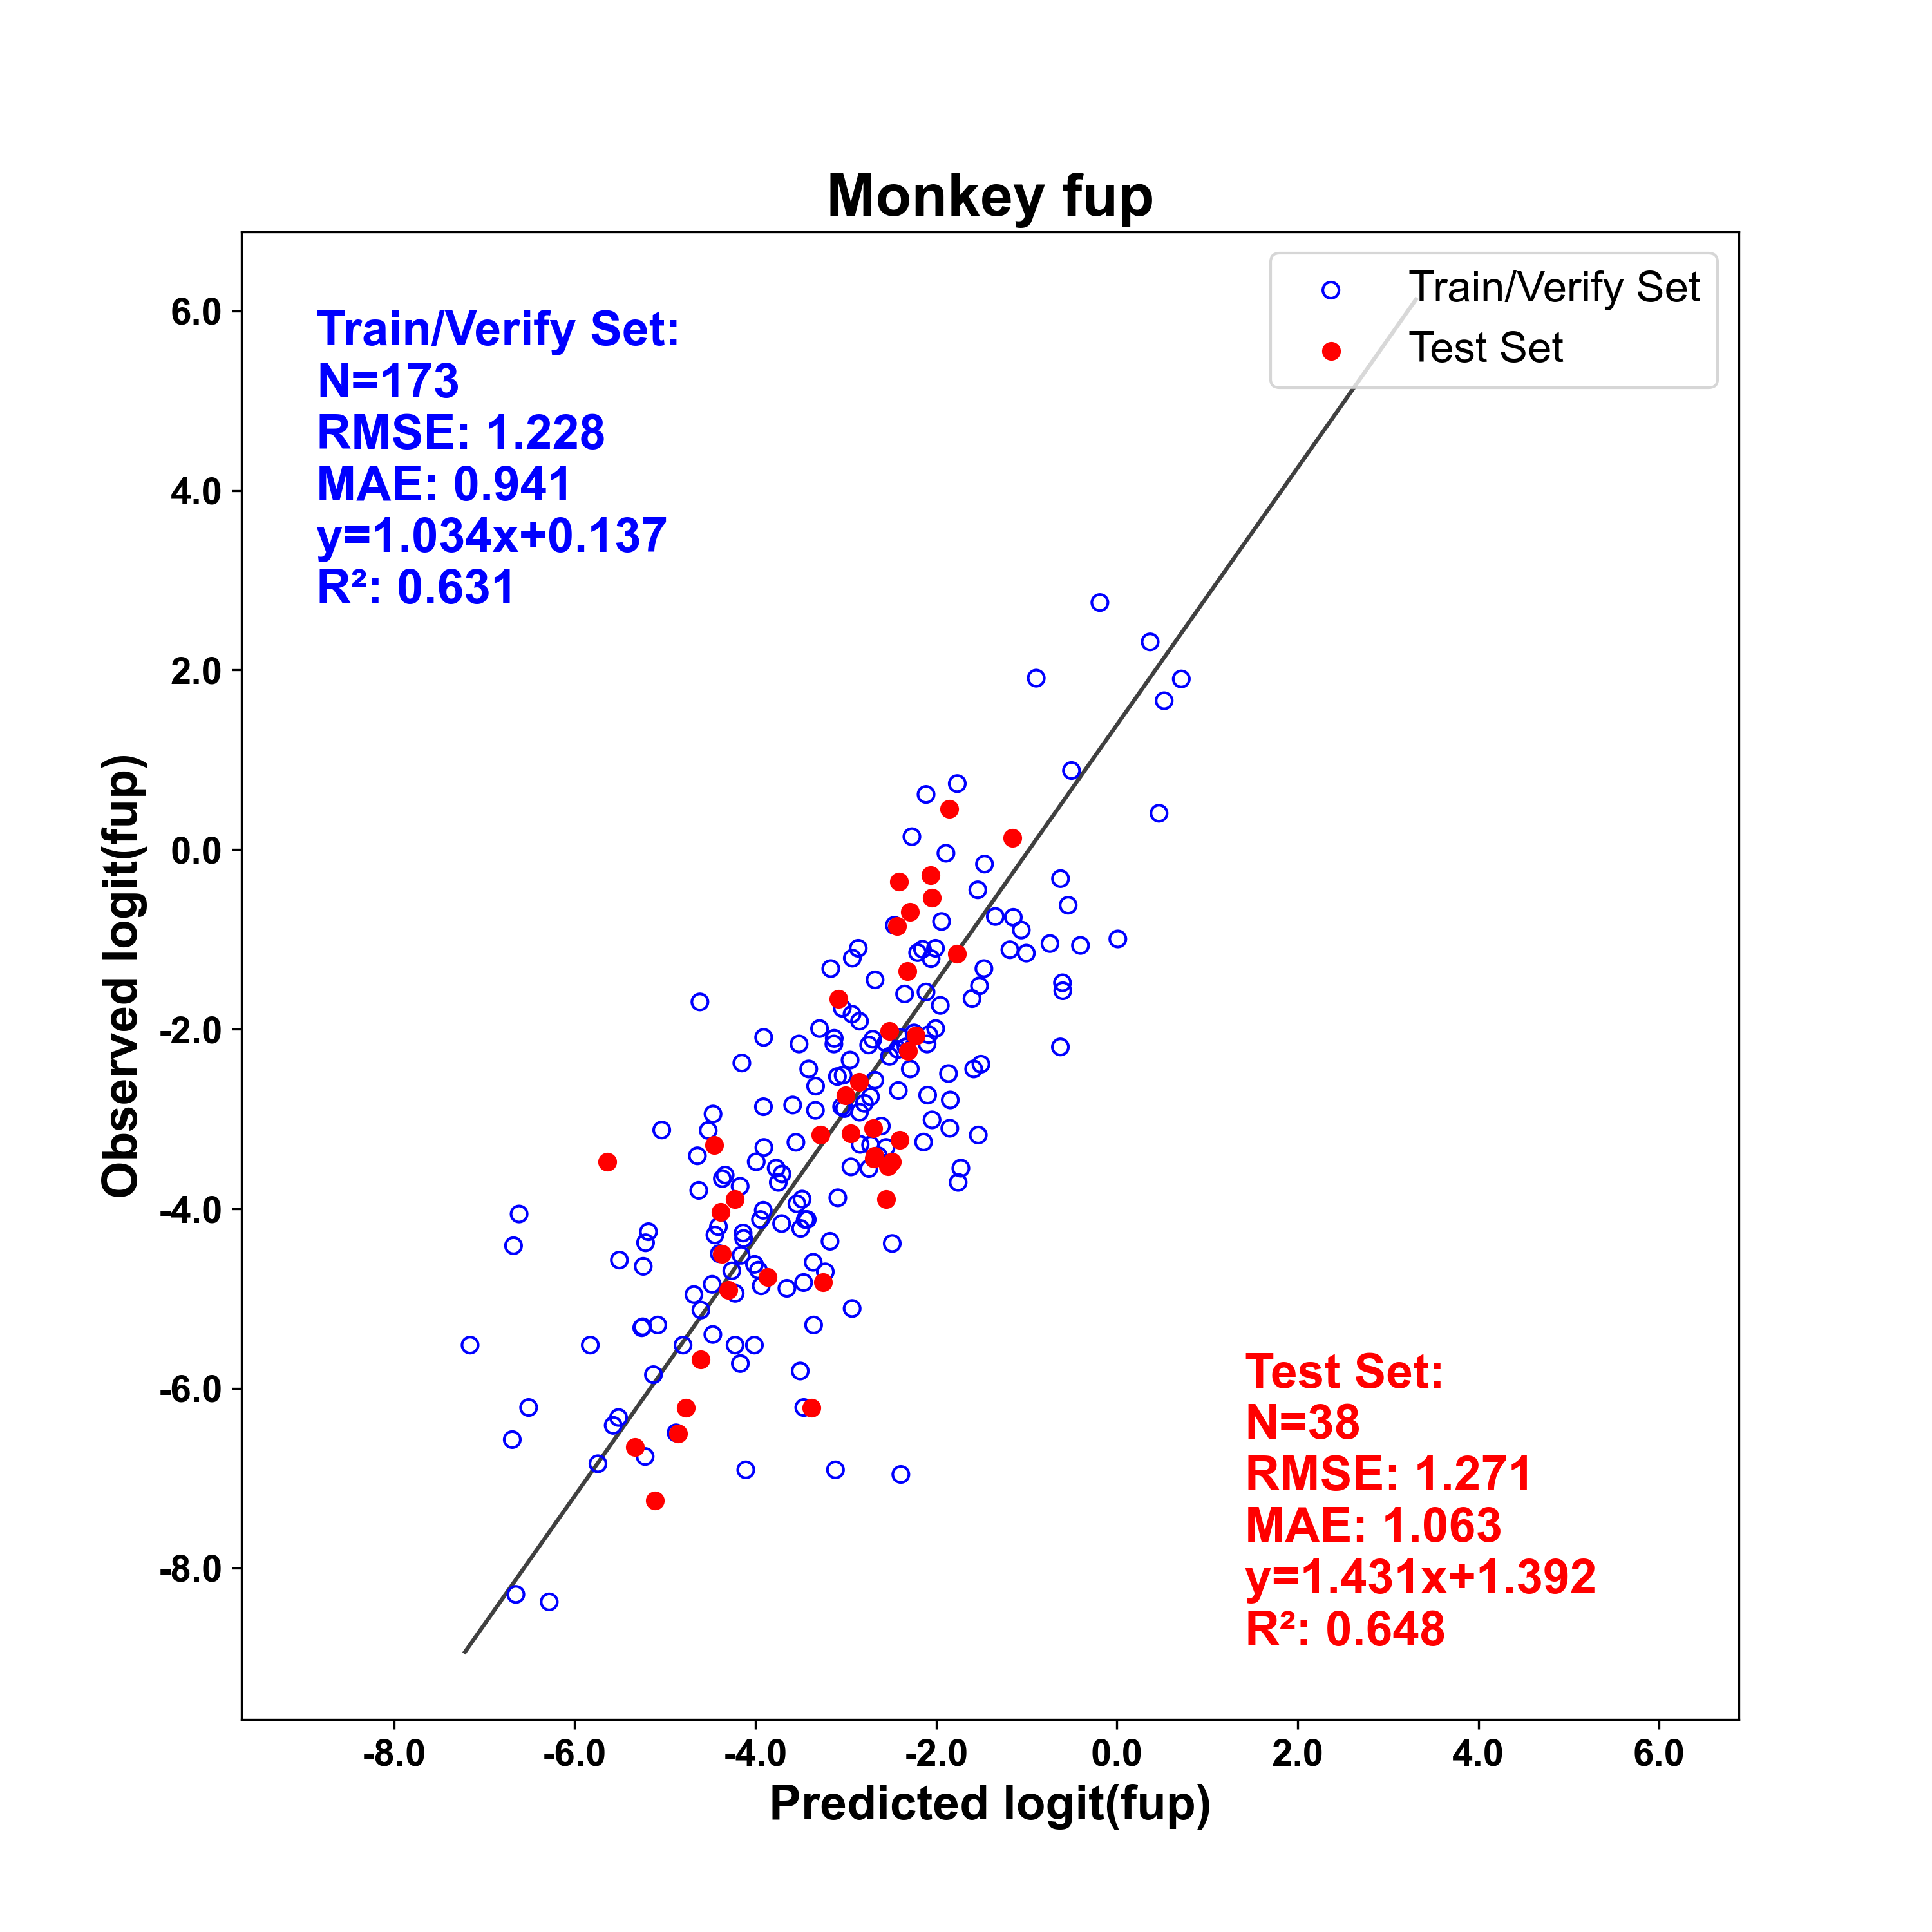
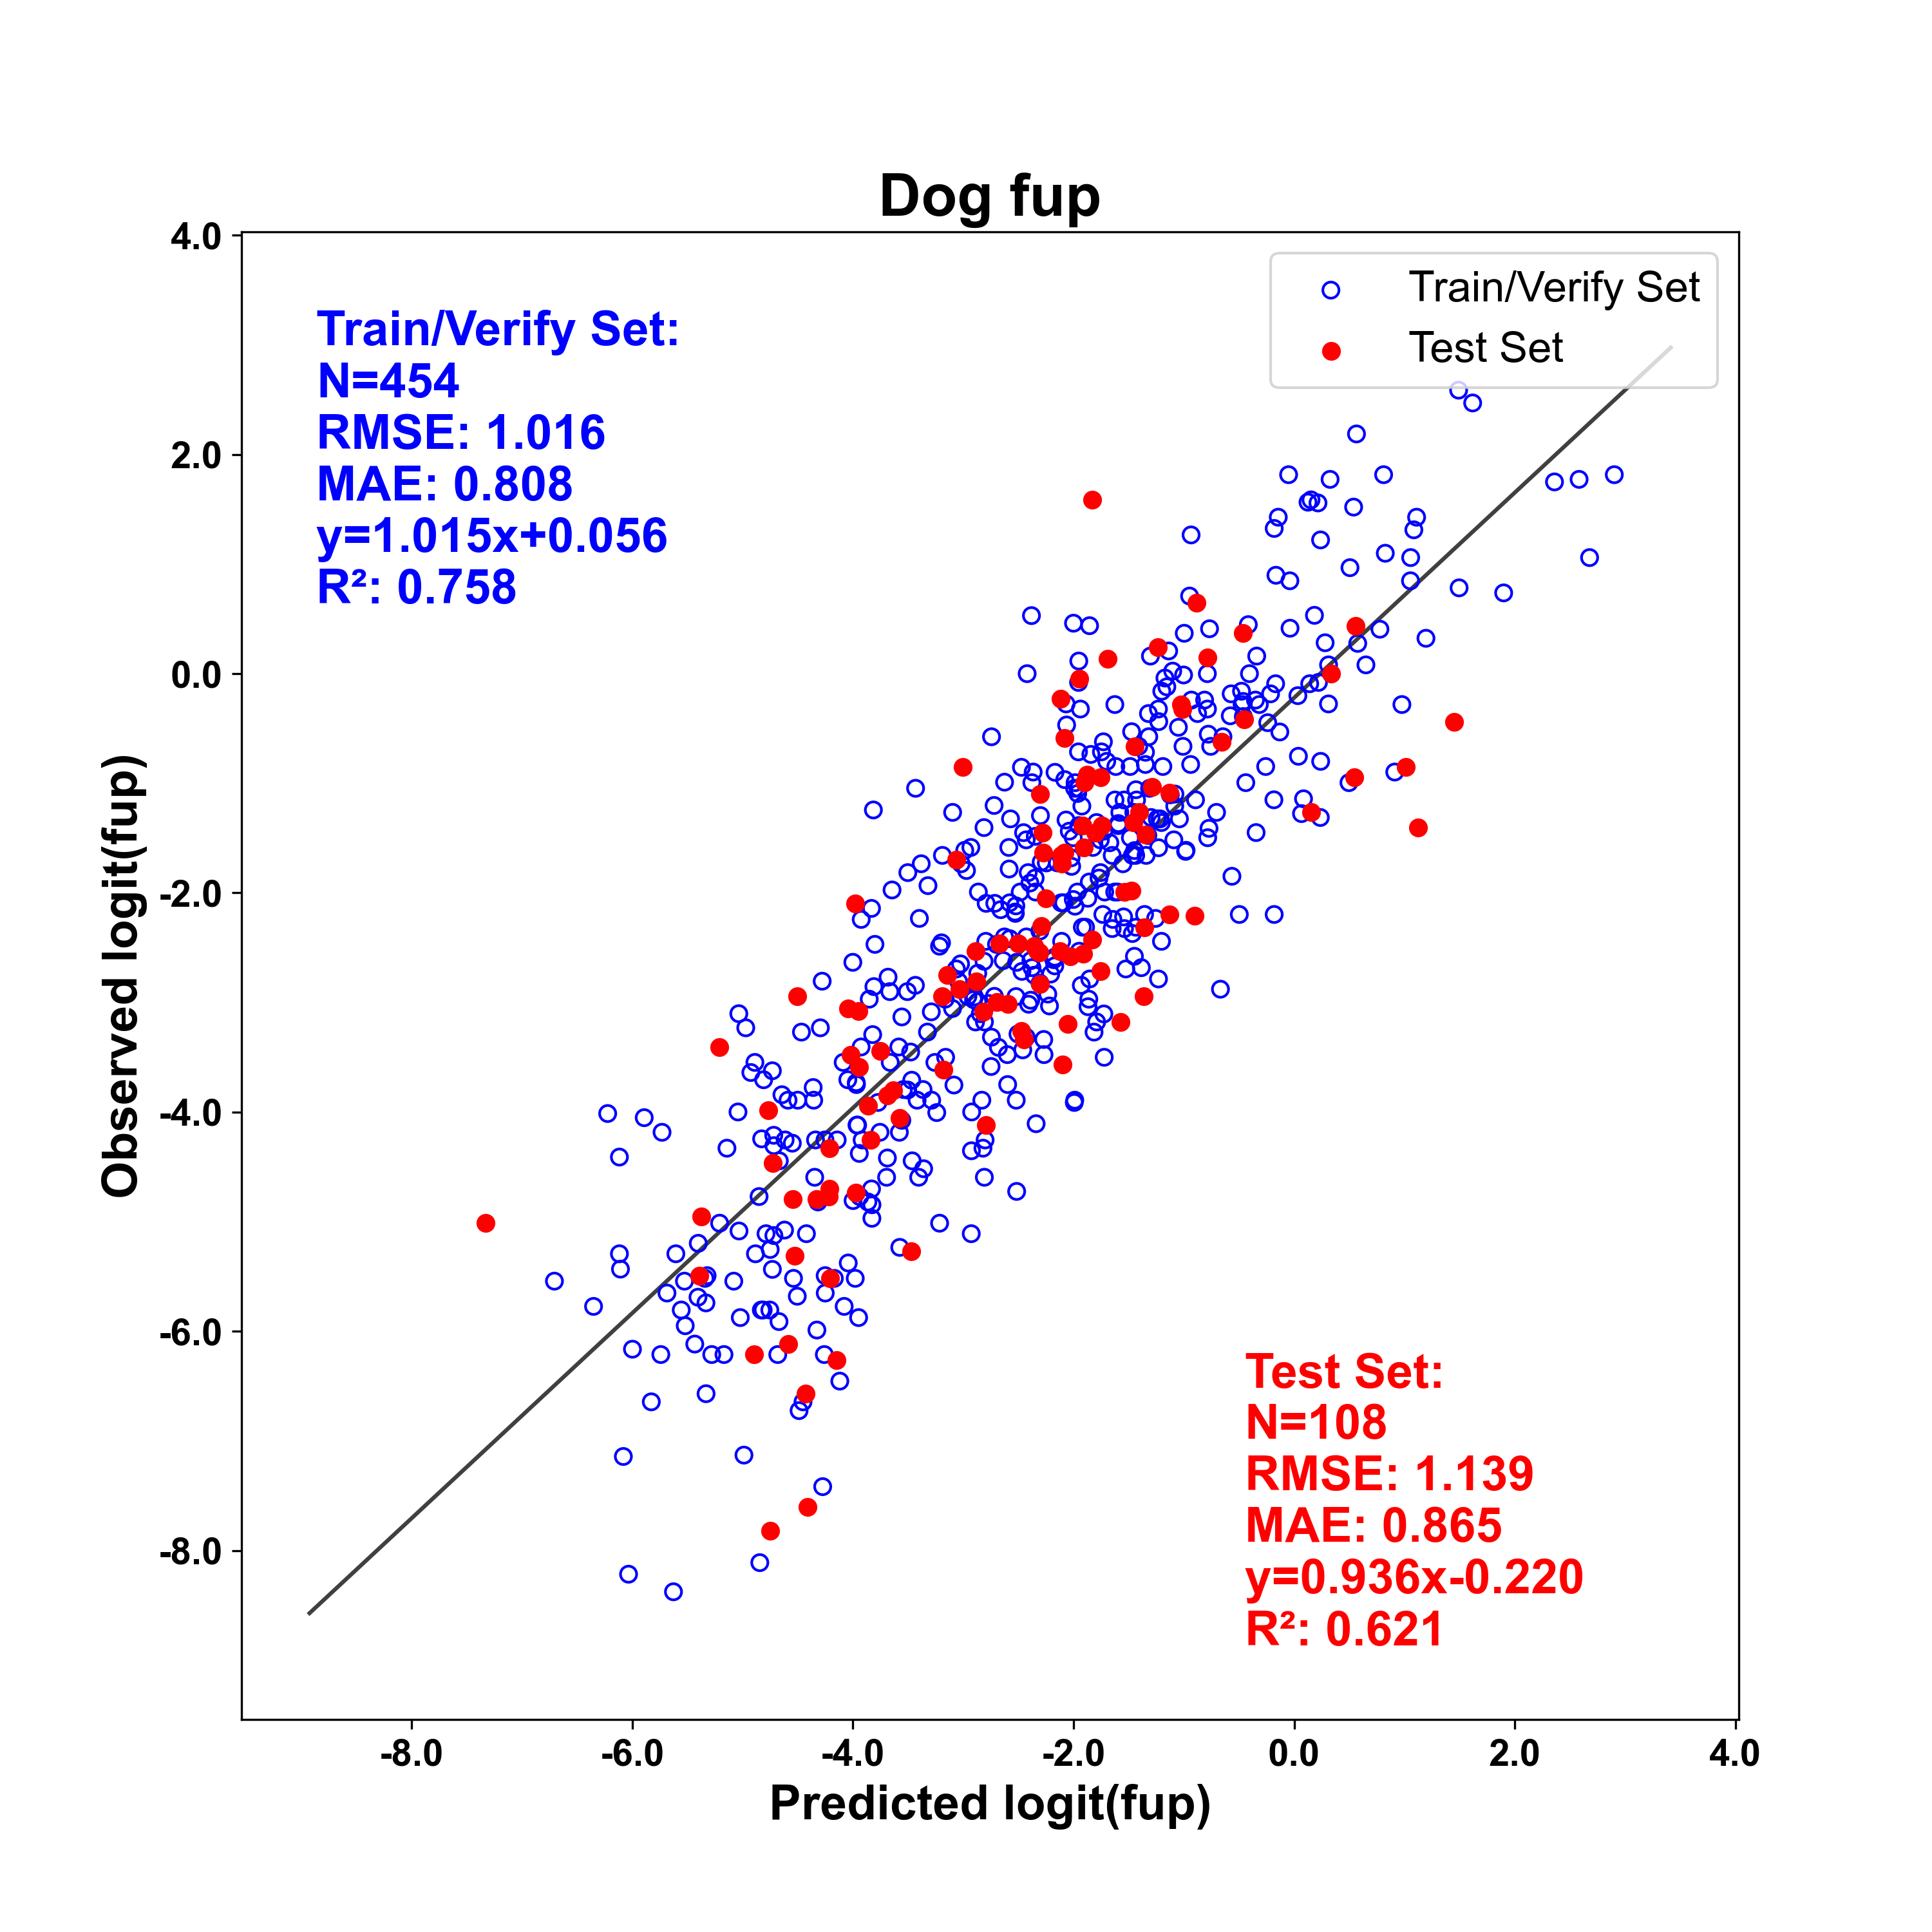
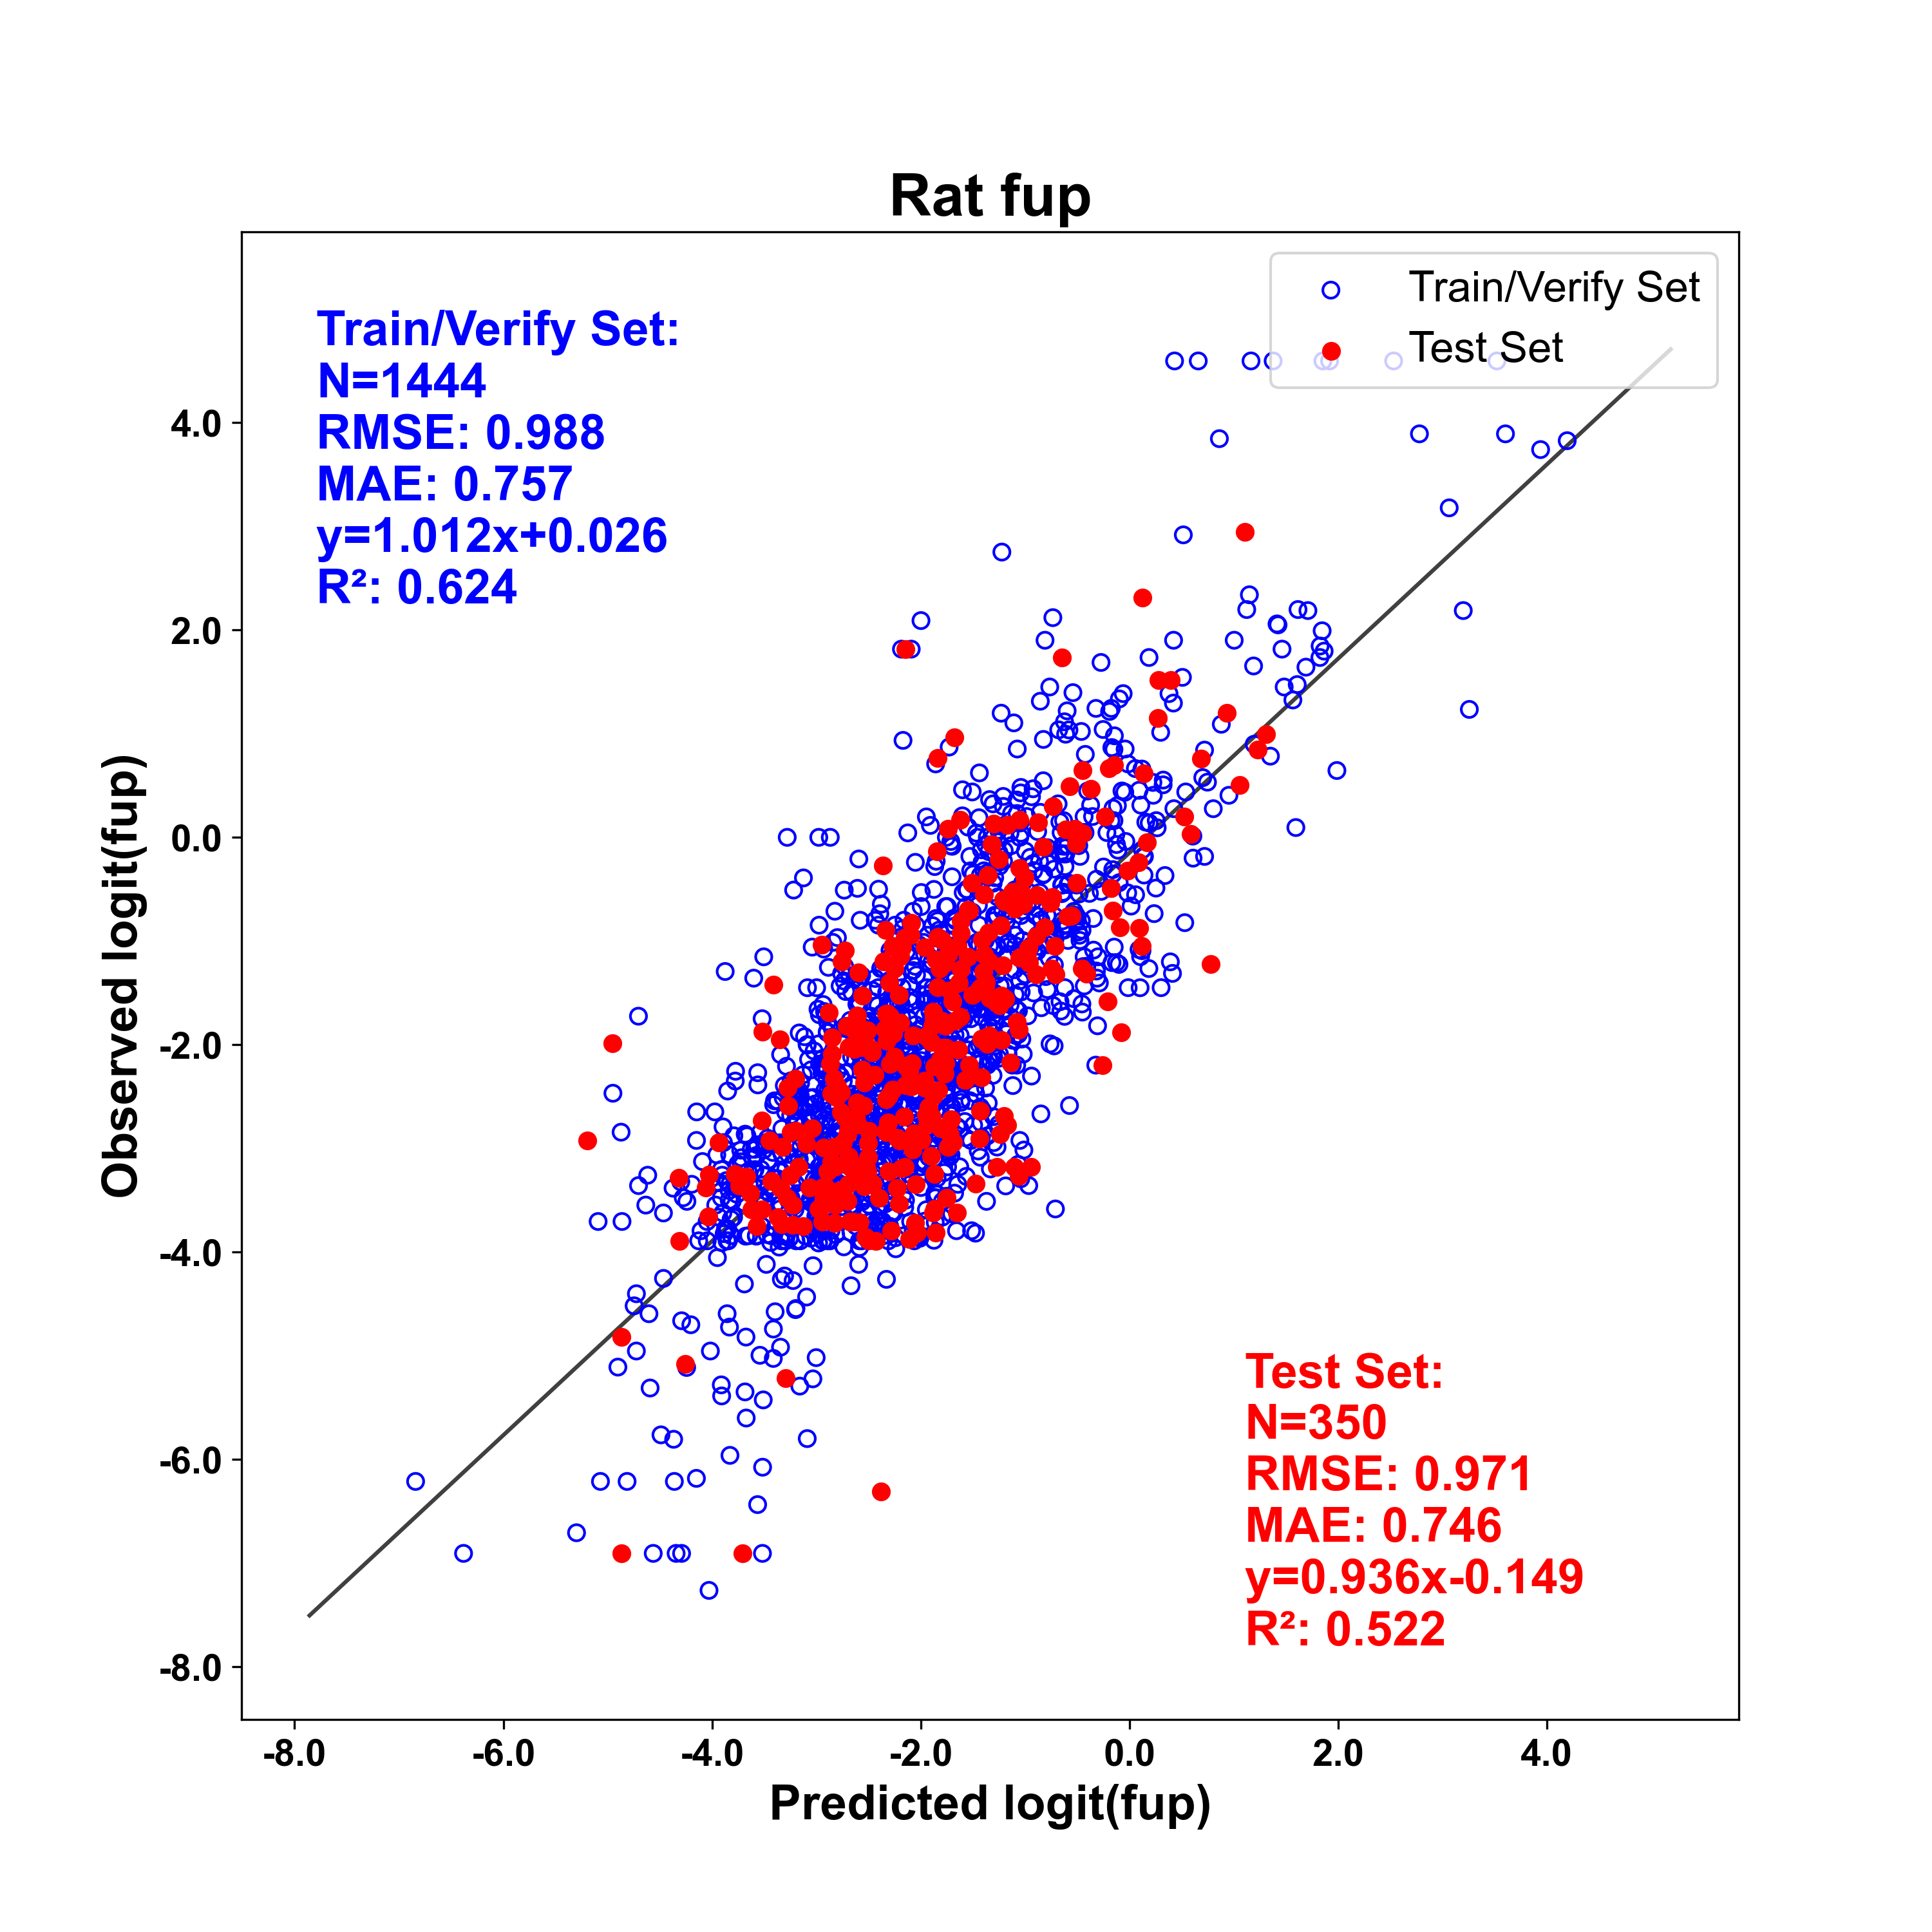
Regulatory agencies recommend using a lower value limit of 0.01 (1%) for fraction unbound in plasma, regardless of measured values, due to uncertainties in accuracy of measurement below this level (unless the assay’s precision and accuracy can be verified). Because the Fup term is used in clearance calculations (e.g. the well-stirred model), the inaccuracy of very low values can have a significant effect on clearance predictions. For this reason, if the Fup is less than 1%, we recommend setting it to 1% in PBPK simulations. To help identify molecules with very low fraction unbound to plasma, we created a classification model, Low_fup, to predict whether a compound will have an fup ≤ 1% ( a “Yes” prediction indicates that the fup may be less than or equal to 1%). Data was used from all five datasets – human, monkey, dog, rat, and mouse – and compounds were removed where there were class discrepancies among species (fewer than 50 such cases). This all-species classification model contains 6144 total compounds, of which 1501 broke at least one Ro5, including 11 PROTACs, 124 macrocycles and 117 cyclic peptides.
|
Model |
Set |
Negatives |
Positives |
Total |
Correct |
Concordance |
Sensitivity |
Specificity |
|
Low_fup |
Training |
444 |
4455 |
4899 |
4246 |
86.7% |
87.1% |
82.7% |
|
Test |
82 |
1163 |
1245 |
1080 |
86.7% |
86.8% |
85.4% |
Blood-to-plasma ratio (RBP)
Blood-to-plasma concentration ratios (RBP):
'%3e%3cg transform='translate(167%2c0)'%3e%3cg transform='translate(-13%2c0)'%3e%3cg transform='translate(0%2c45)'%3e%3cuse xlink:href='%23MJMAIN-52' x='0' y='0'%3e%3c/use%3e%3cuse xlink:href='%23MJMAIN-42' x='736' y='0'%3e%3c/use%3e%3cuse xlink:href='%23MJMAIN-50' x='1445' y='0'%3e%3c/use%3e%3cuse xlink:href='%23MJMAIN-3D' x='2404' y='0'%3e%3c/use%3e%3cg transform='translate(3182%2c0)'%3e%3cg transform='translate(397%2c0)'%3e%3crect stroke='none' width='3394' height='60' x='0' y='220'%3e%3c/rect%3e%3cg transform='translate(60%2c537)'%3e%3cuse transform='scale(0.707)' xlink:href='%23MJMATHI-43' x='0' y='0'%3e%3c/use%3e%3cg transform='translate(505%2c-107)'%3e%3cuse transform='scale(0.5)' xlink:href='%23MJMAIN-77' x='0' y='0'%3e%3c/use%3e%3cuse transform='scale(0.5)' xlink:href='%23MJMAIN-68' x='722' y='0'%3e%3c/use%3e%3cuse transform='scale(0.5)' xlink:href='%23MJMAIN-6F' x='1279' y='0'%3e%3c/use%3e%3cuse transform='scale(0.5)' xlink:href='%23MJMAIN-6C' x='1779' y='0'%3e%3c/use%3e%3cuse transform='scale(0.5)' xlink:href='%23MJMAIN-65' x='2058' y='0'%3e%3c/use%3e%3cuse transform='scale(0.5)' xlink:href='%23MJMAIN-62' x='3002' y='0'%3e%3c/use%3e%3cuse transform='scale(0.5)' xlink:href='%23MJMAIN-6C' x='3558' y='0'%3e%3c/use%3e%3cuse transform='scale(0.5)' xlink:href='%23MJMAIN-6F' x='3837' y='0'%3e%3c/use%3e%3cuse transform='scale(0.5)' xlink:href='%23MJMAIN-6F' x='4338' y='0'%3e%3c/use%3e%3cuse transform='scale(0.5)' xlink:href='%23MJMAIN-64' x='4838' y='0'%3e%3c/use%3e%3c/g%3e%3c/g%3e%3cg transform='translate(642%2c-425)'%3e%3cuse transform='scale(0.707)' xlink:href='%23MJMATHI-43' x='0' y='0'%3e%3c/use%3e%3cg transform='translate(505%2c-107)'%3e%3cuse transform='scale(0.5)' xlink:href='%23MJMAIN-70' x='0' y='0'%3e%3c/use%3e%3cuse transform='scale(0.5)' xlink:href='%23MJMAIN-6C' x='556' y='0'%3e%3c/use%3e%3cuse transform='scale(0.5)' xlink:href='%23MJMAIN-61' x='835' y='0'%3e%3c/use%3e%3cuse transform='scale(0.5)' xlink:href='%23MJMAIN-73' x='1335' y='0'%3e%3c/use%3e%3cuse transform='scale(0.5)' xlink:href='%23MJMAIN-6D' x='1730' y='0'%3e%3c/use%3e%3cuse transform='scale(0.5)' xlink:href='%23MJMAIN-61' x='2563' y='0'%3e%3c/use%3e%3c/g%3e%3c/g%3e%3c/g%3e%3c/g%3e%3c/g%3e%3c/g%3e%3c/g%3e%3c/g%3e%3c/svg%3e)
are fundamental pharmacokinetic parameters that go unreported for many drug candidates. ADMET Predictor's RBP models estimate this key ratio based on 2D structural descriptors. Models are available for human (RBP_hum), rat (RBP_rat), mouse (RBP_mou), dog (RBP_dog), and monkey (RBP_mky) species. The model names were changed starting in ADMET Predictor 14.
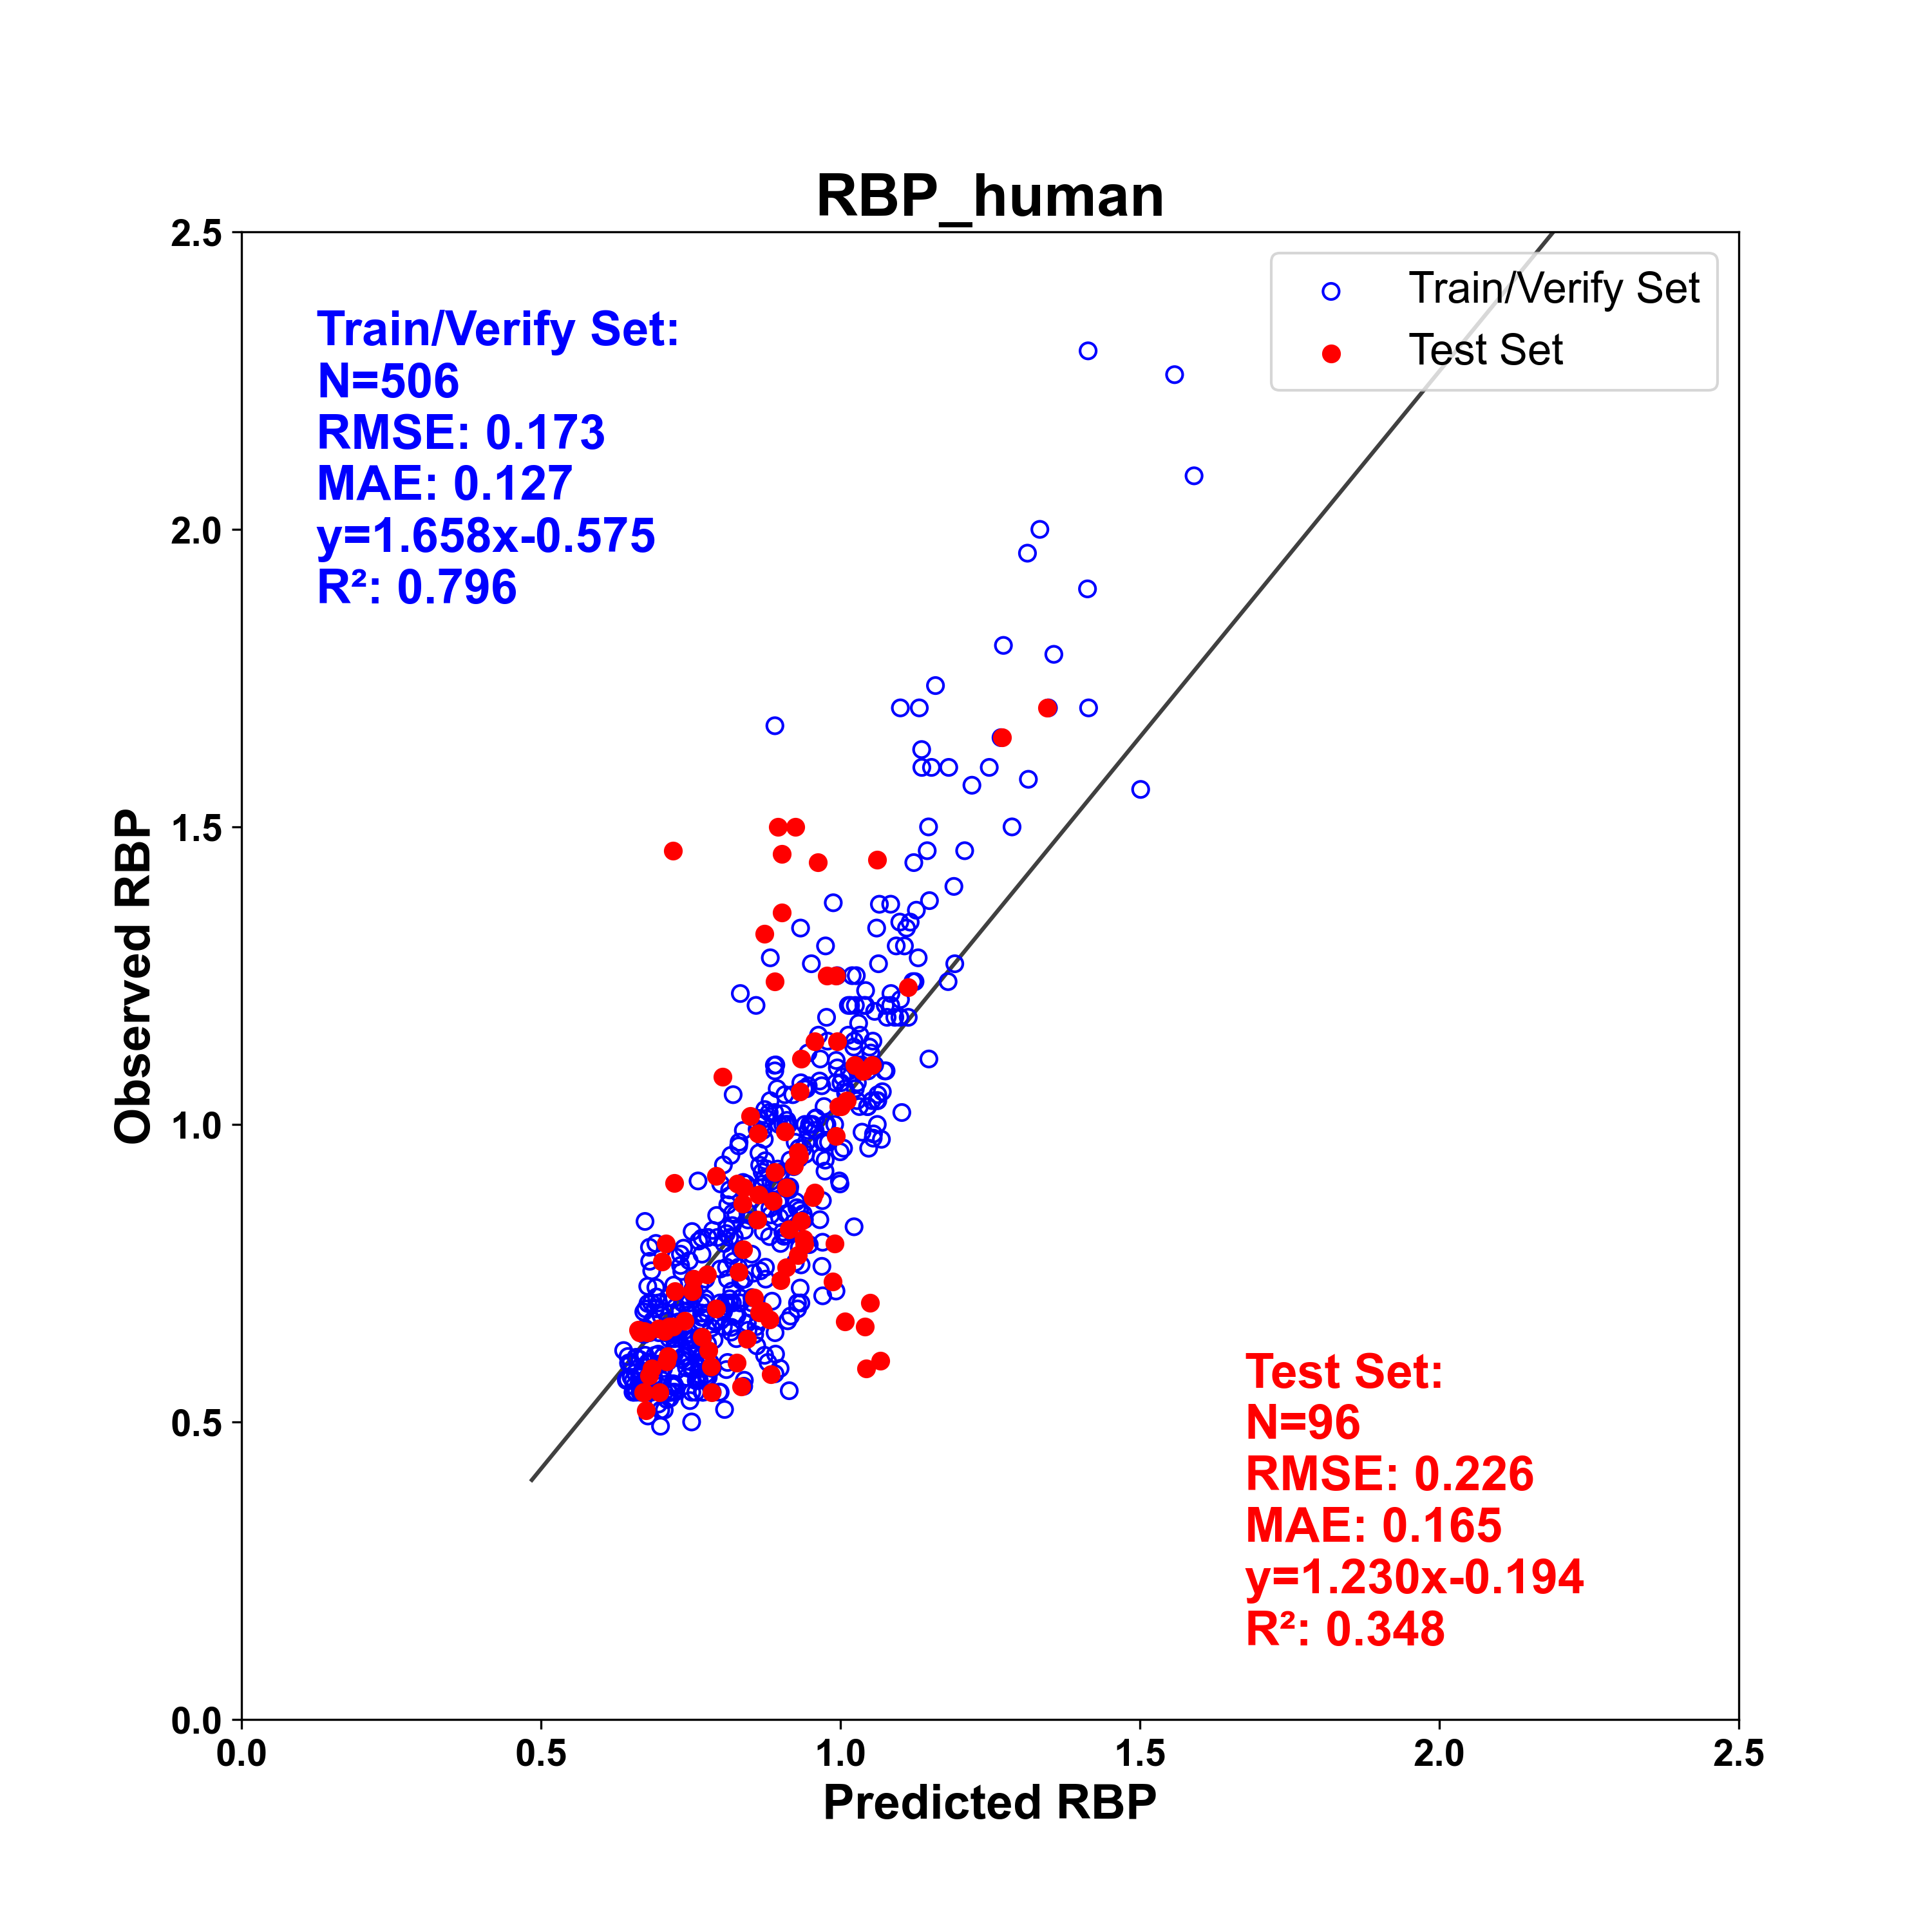
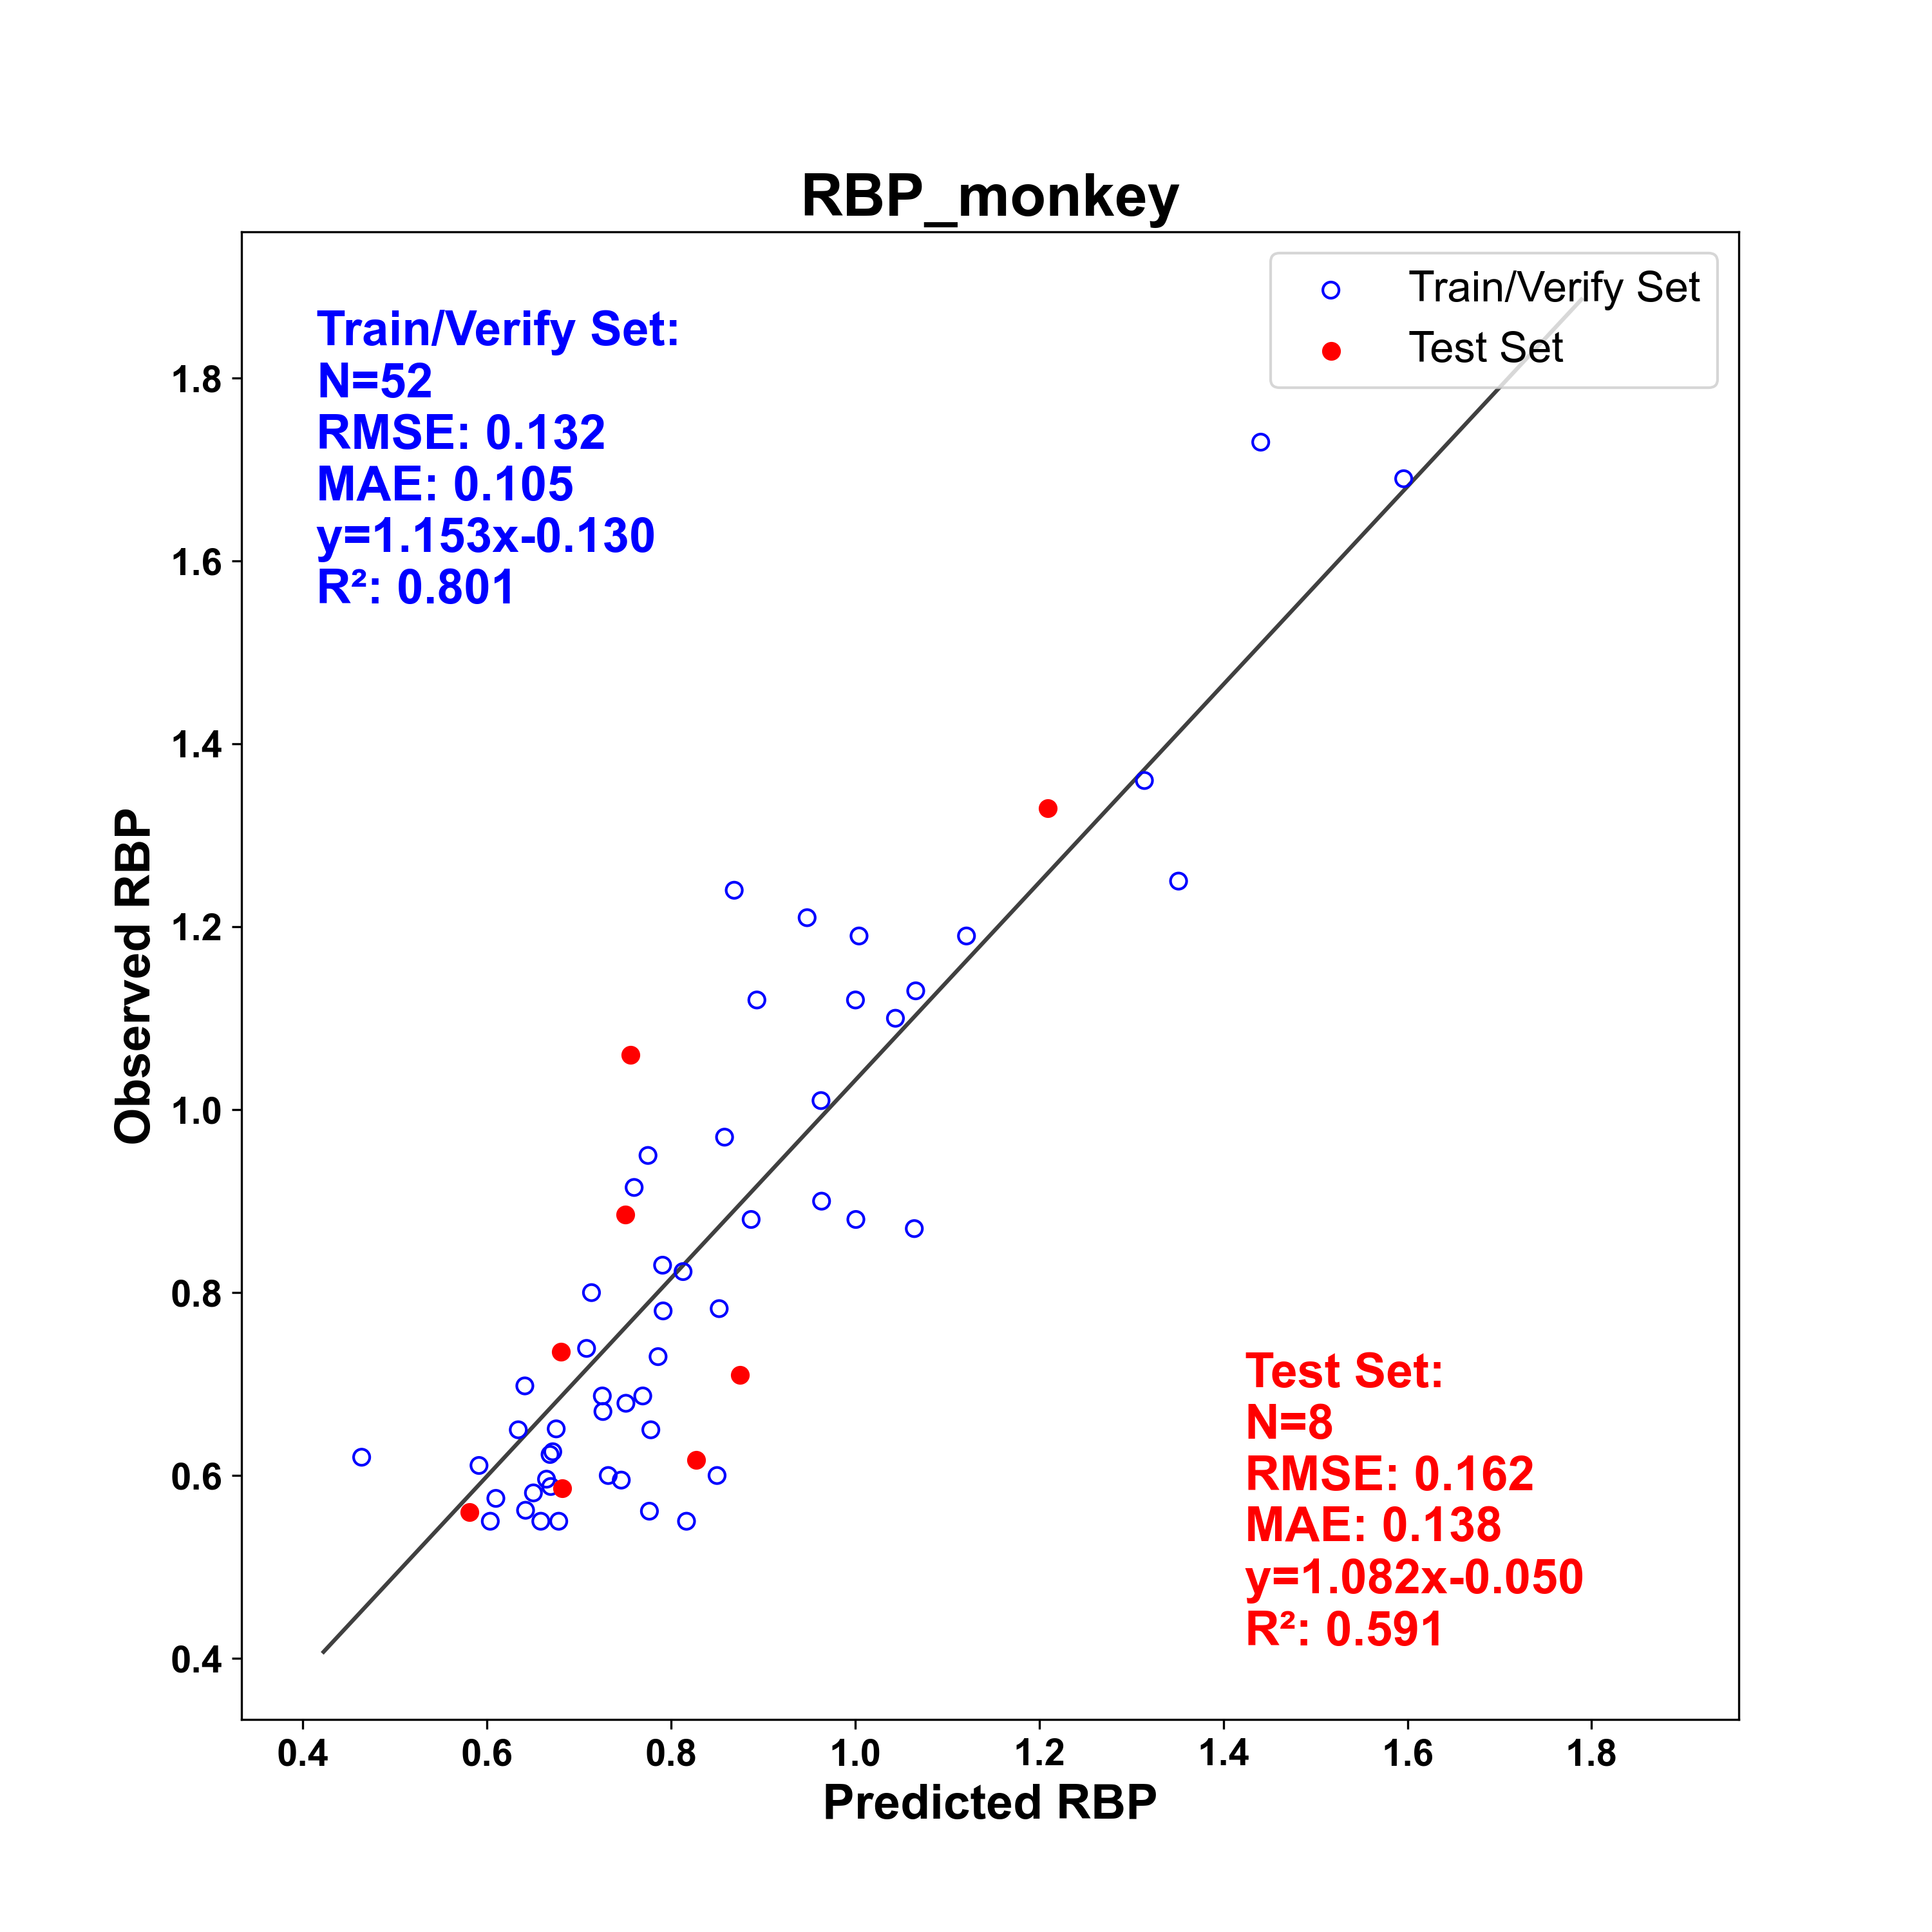
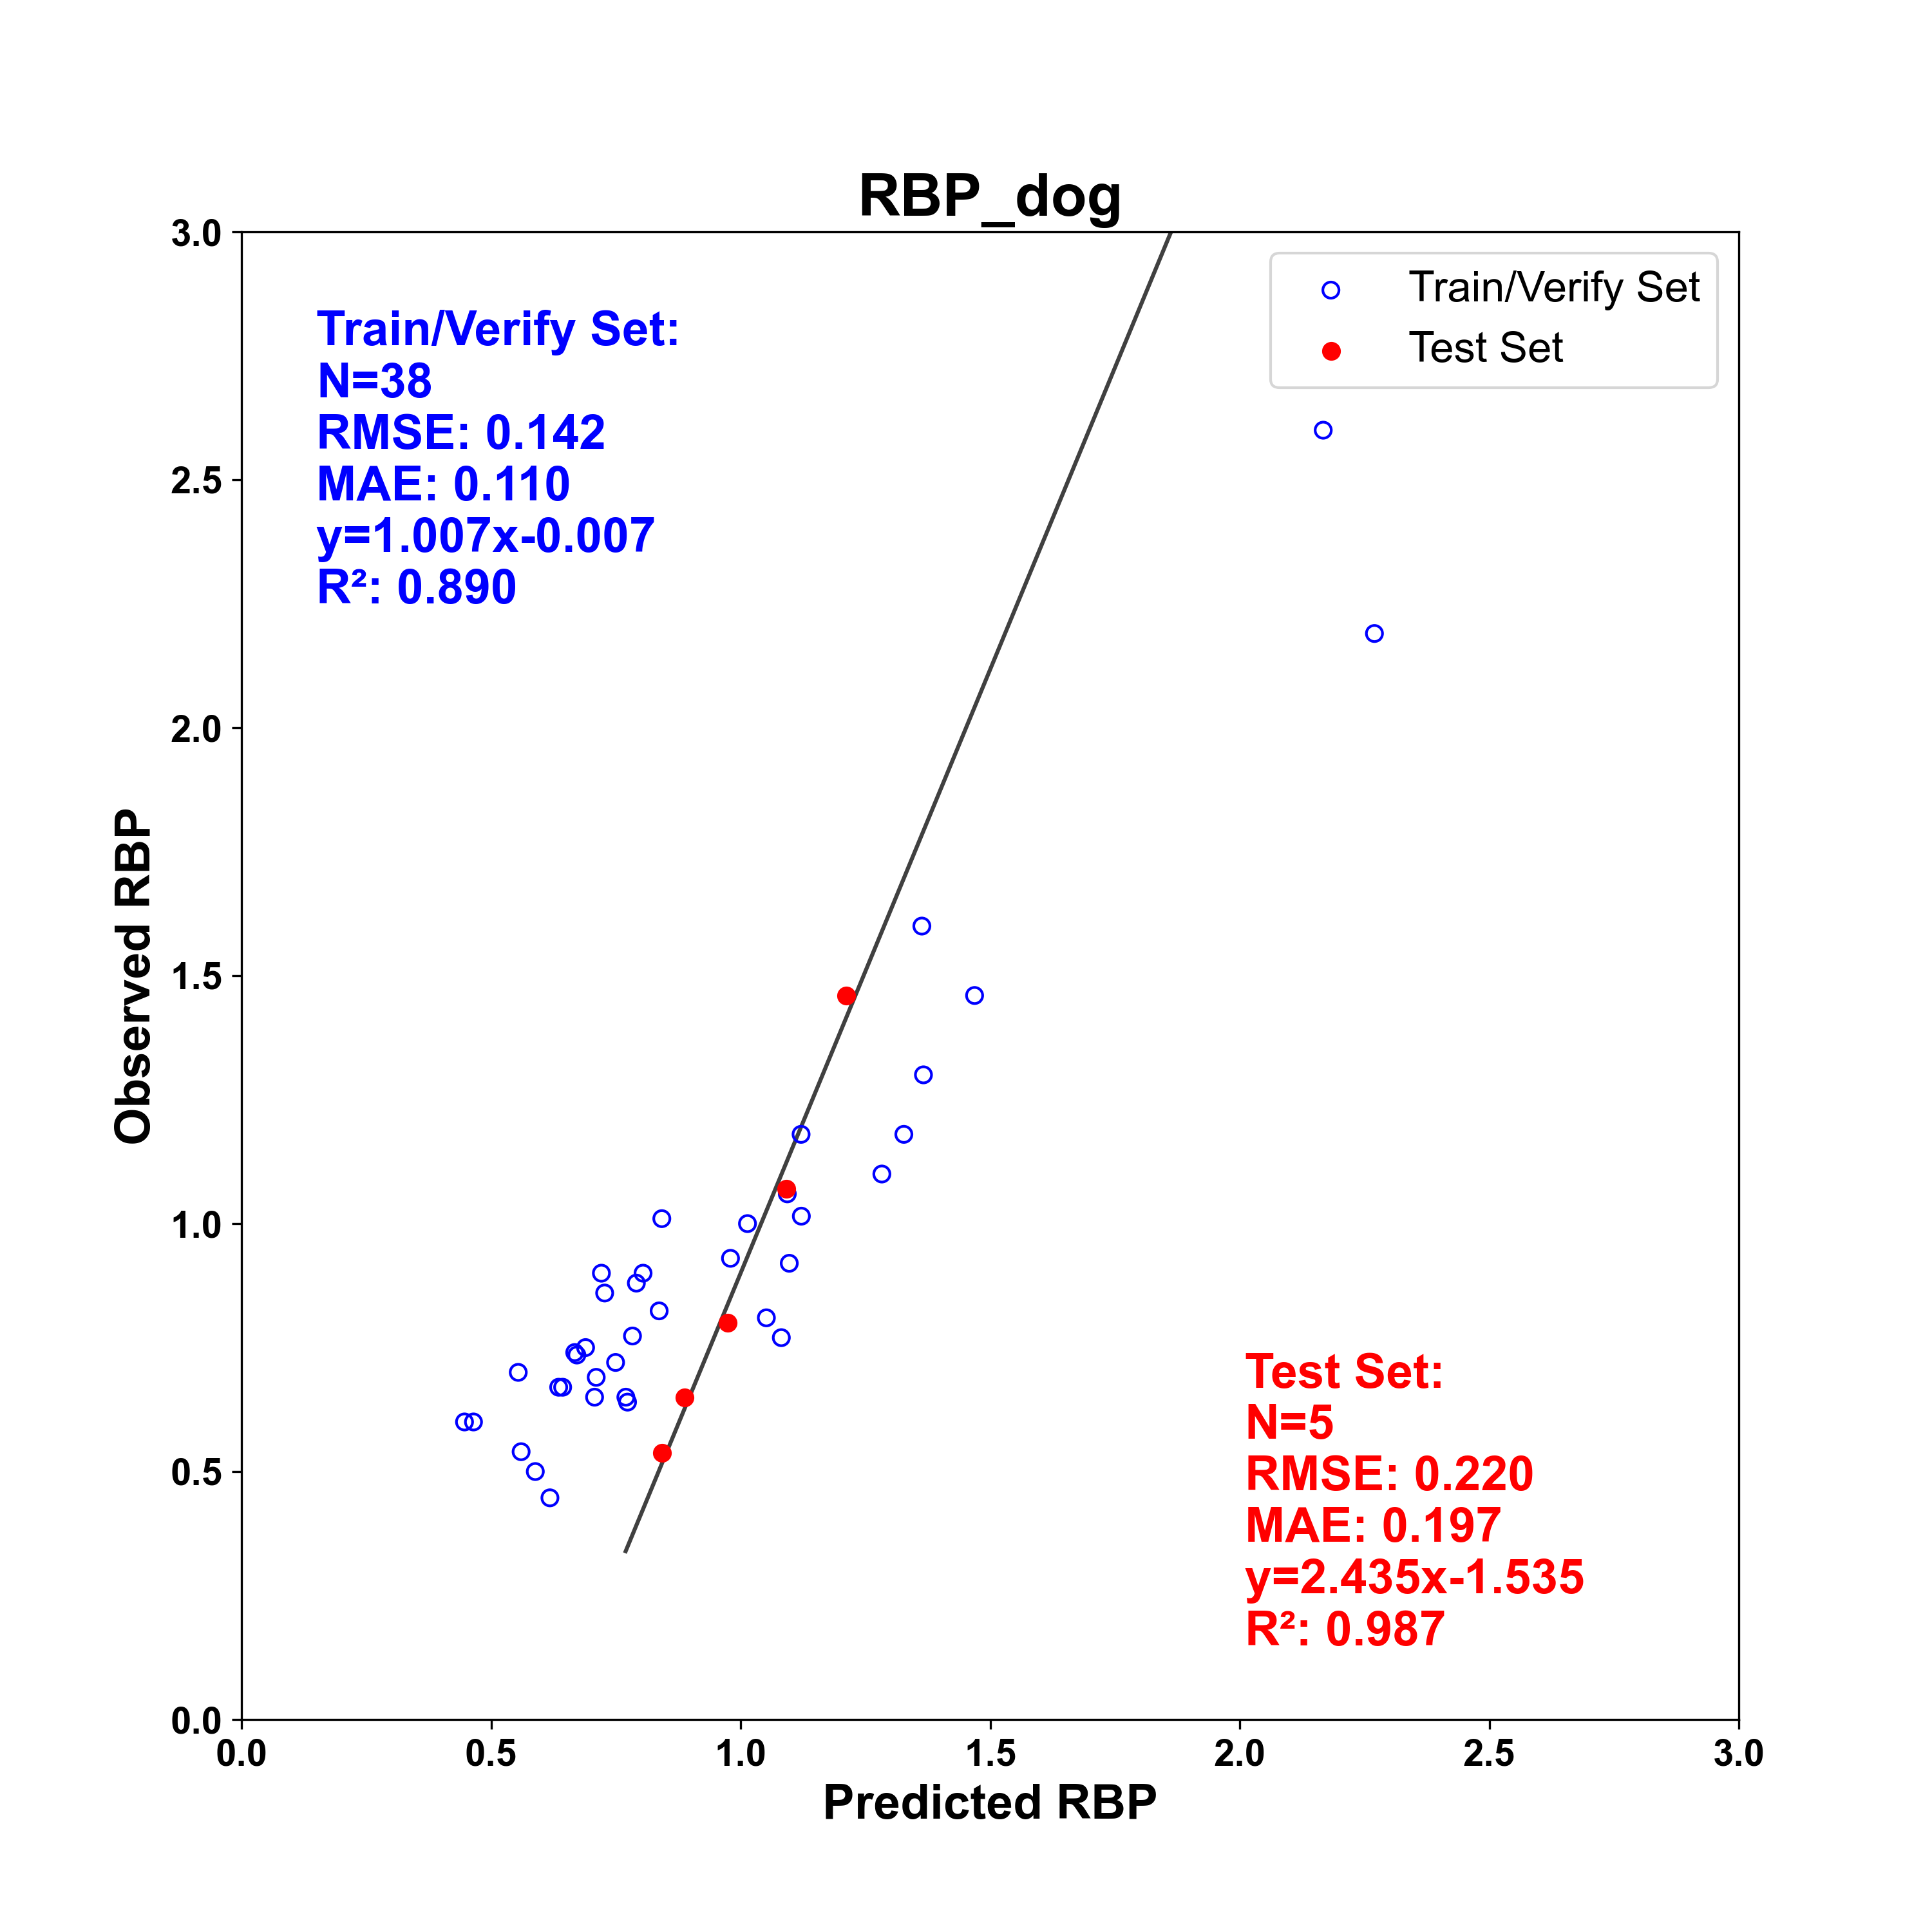
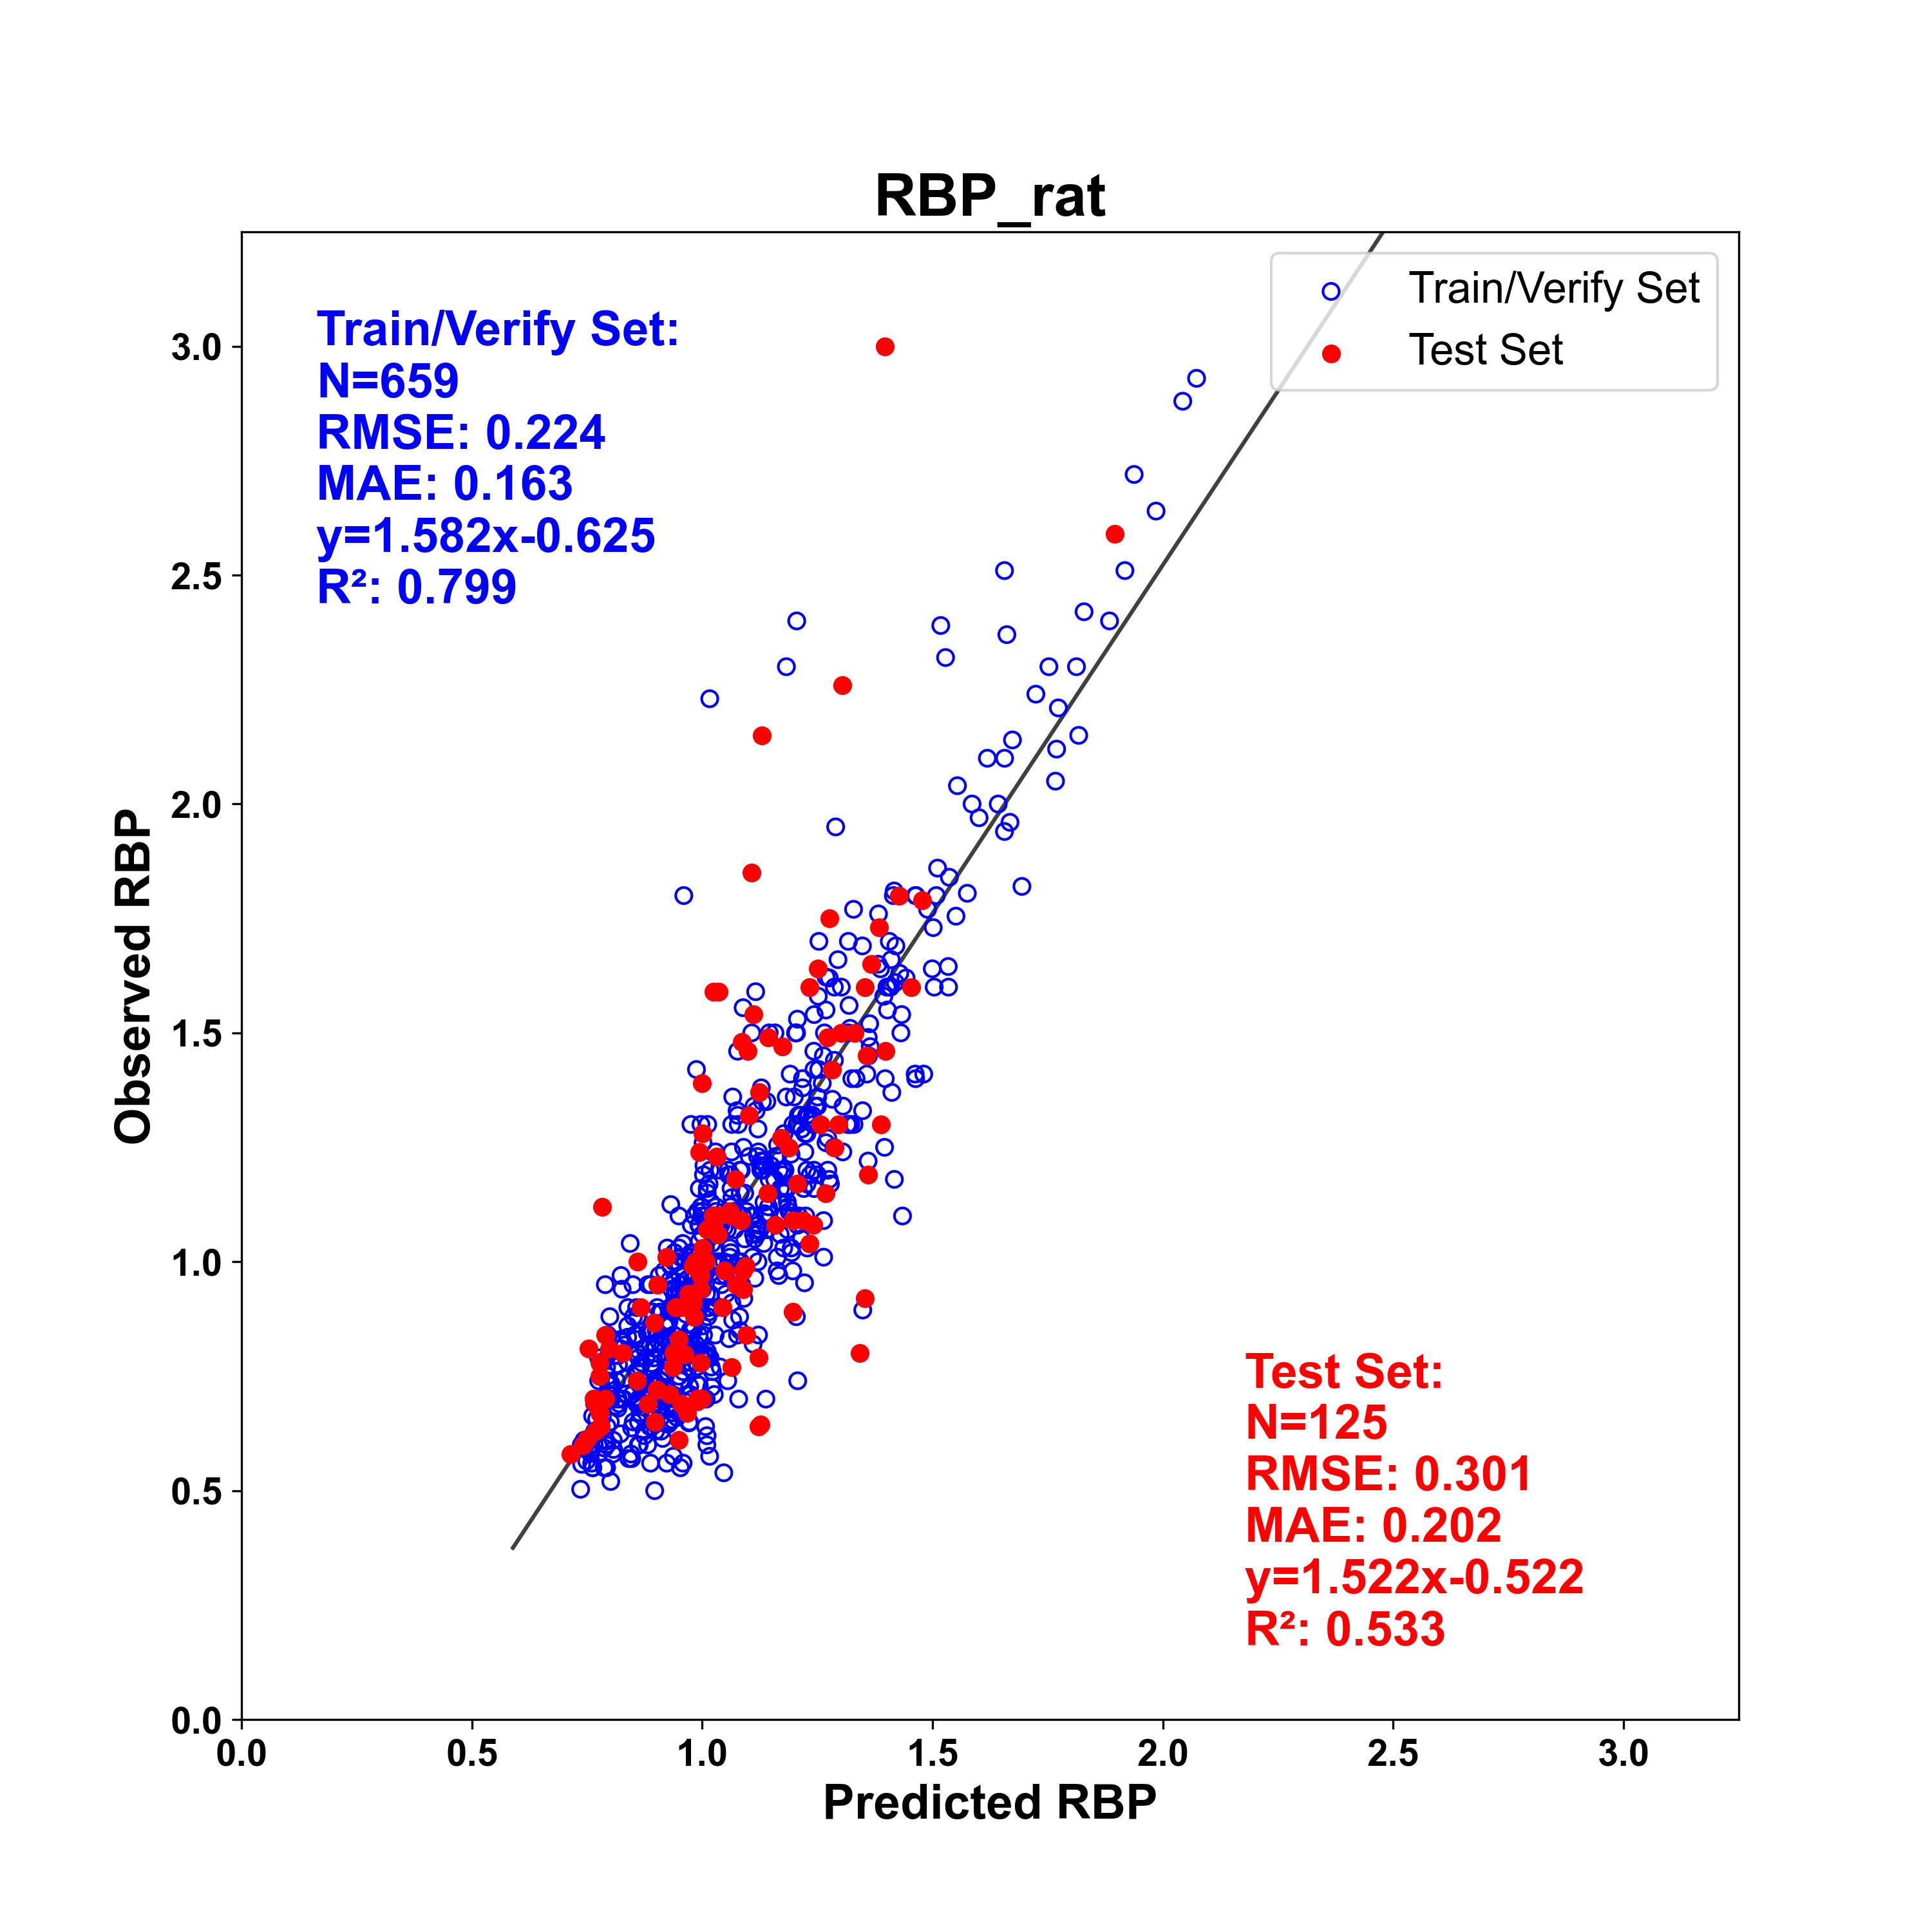
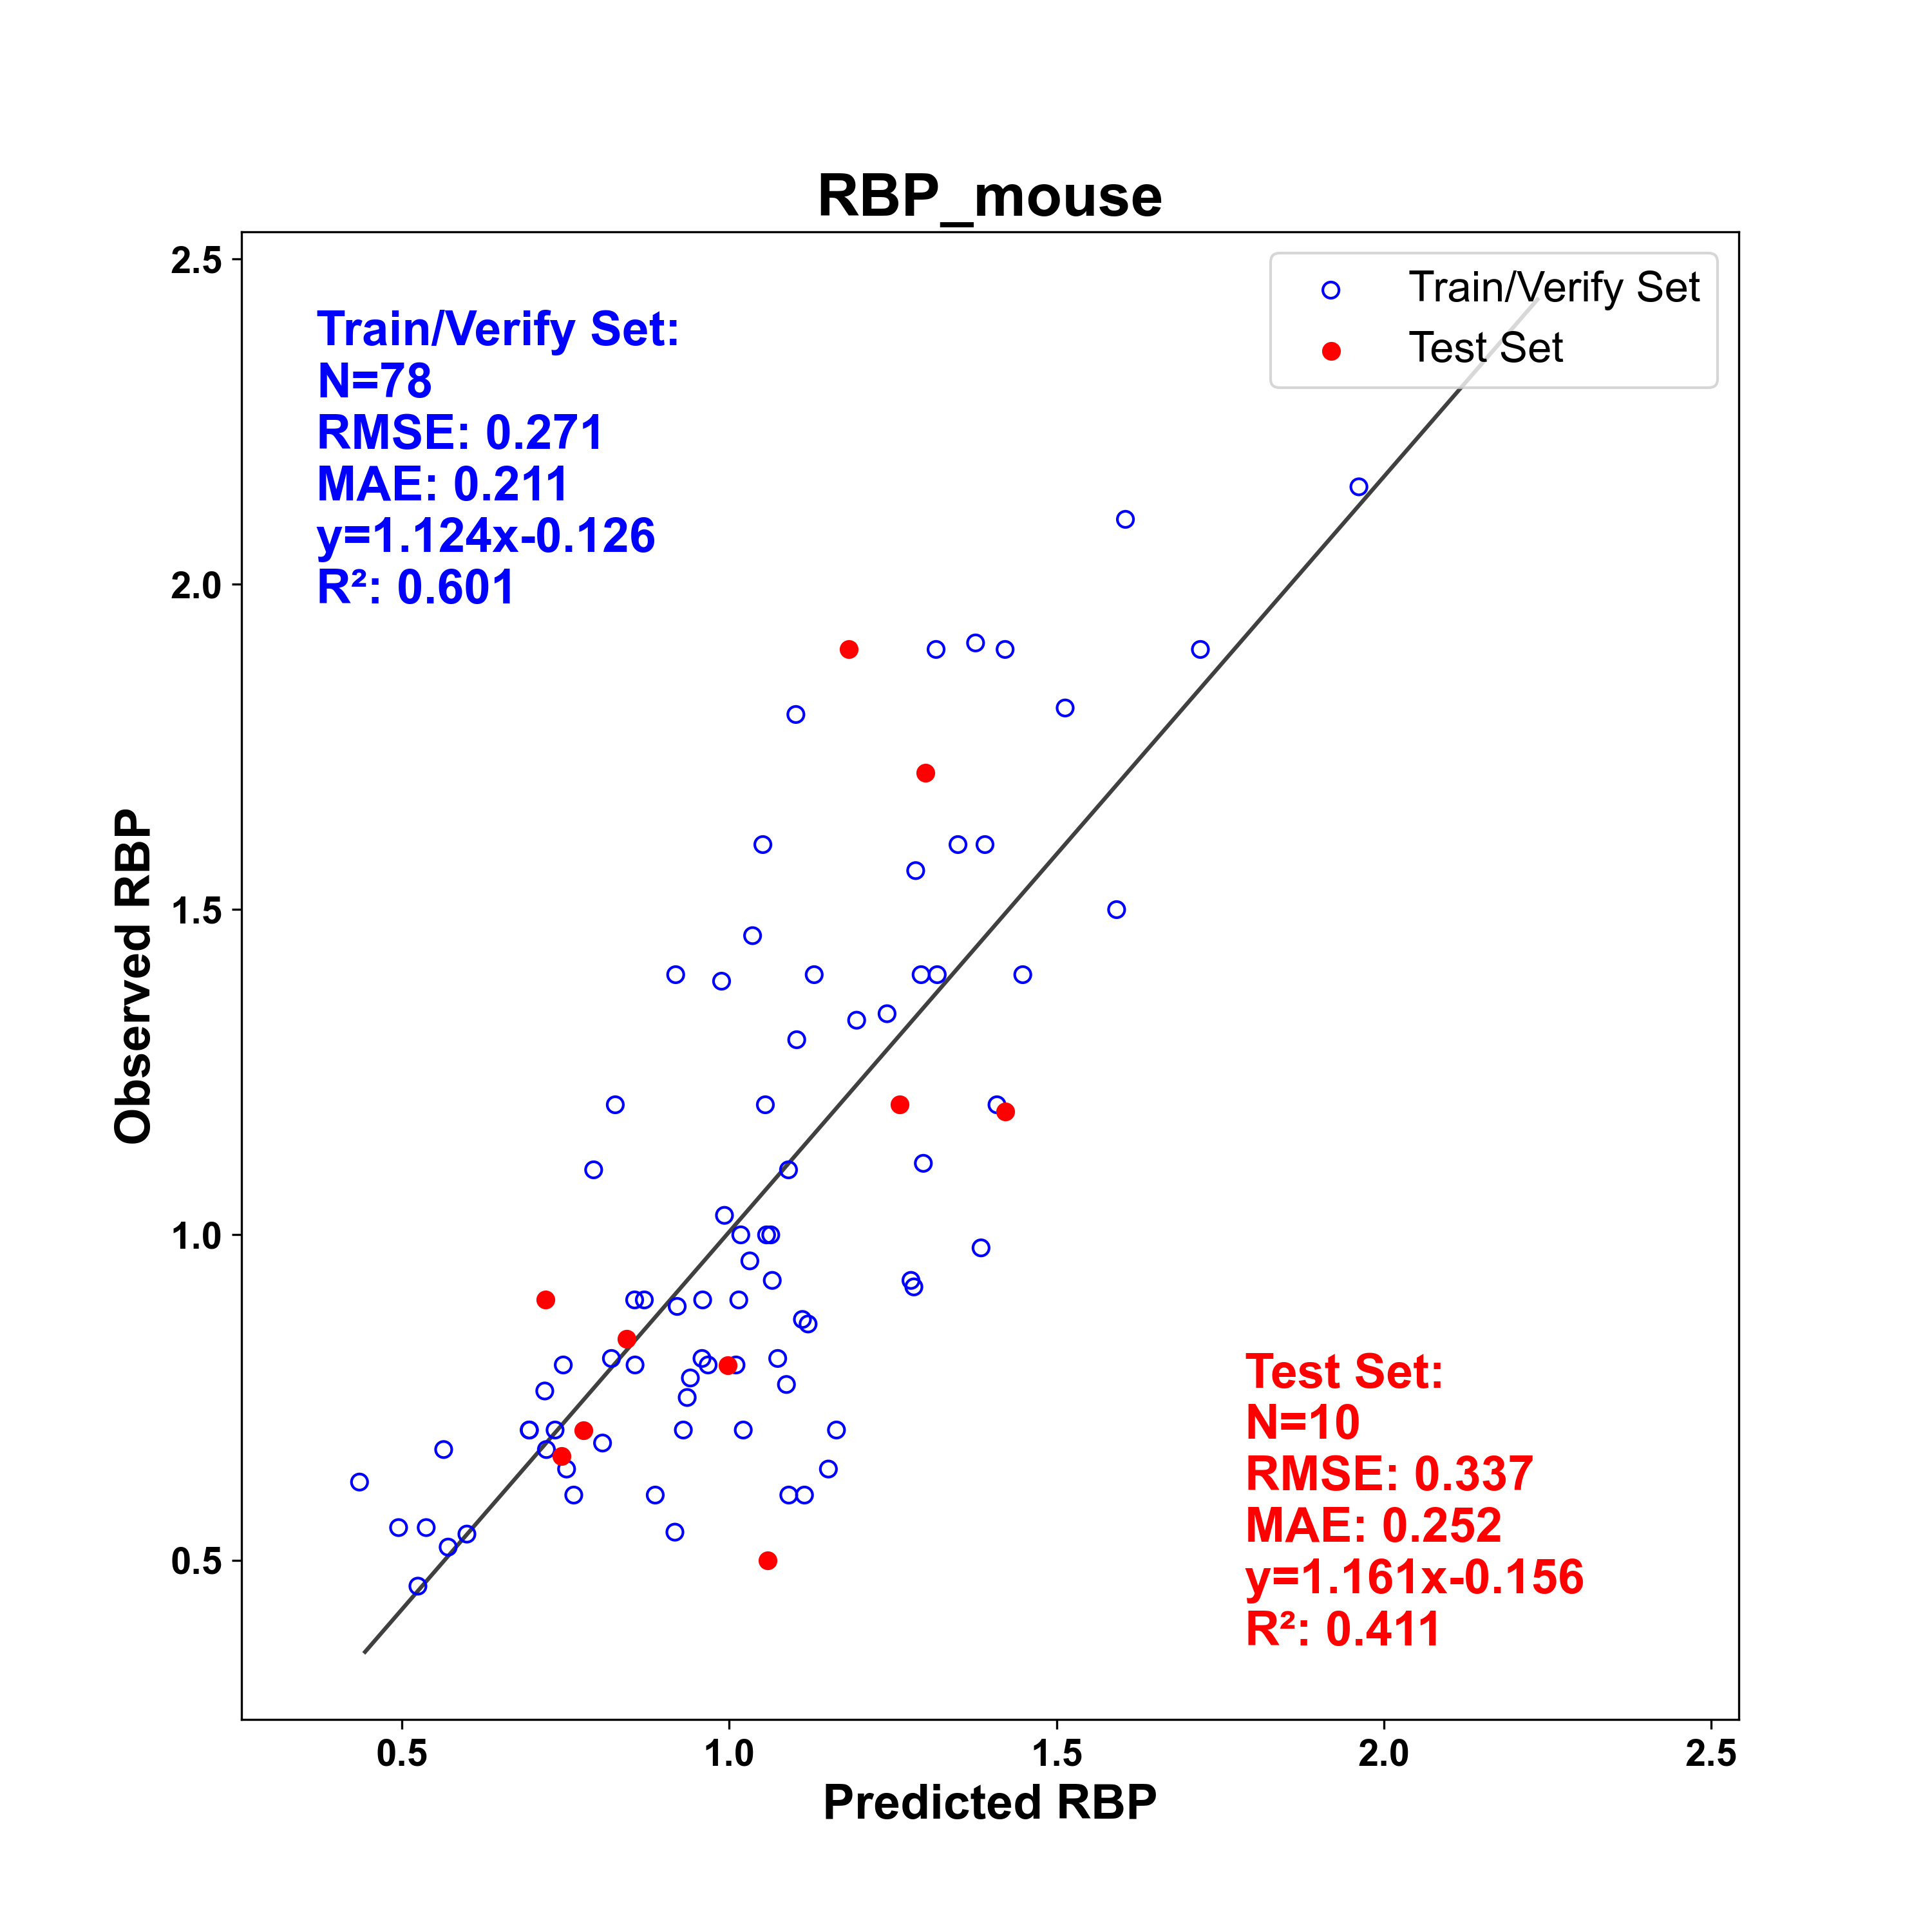
RBP data was collected from literature sources and ChEMBL, with careful review of each primary literature source to ensure accuracy. The Rat model also contains data for 496 compounds provided to Simulations Plus by Roche. Compounds from different sources were combined and for compounds that were in more than one dataset, the median value was used. The human model contains 602 total compounds, of which 129 broke at least one Ro5, including 4 PROTACs, 18 macrocycles and 1 cyclic peptide. The monkey (combined macaca fascicularis and mulatta) model contains 60 compounds, of which 19 broke at least one Ro5, including 1 macrocycle and 1 cyclic peptide. The dog model contains 43 compounds, of which 14 broke at least one Ro5, including 2 PROTACs. The rat model contains 784 total compounds, of which 202 broke at least one Ro5, including 2 PROTACs, 8 macrocycles and 2 cyclic peptides. The mouse model contains 88 compounds, 40 of which broke at least one Ro5, including 9 PROTACs and 1 macrocycle.
As data was sparse for species other than rat and human, we first trained XGBoost models on rat and human data. These models were then used as reference models to train Linear Boost ANNE DELTA models for monkey, mouse and dog data. This approach allows for the incorporation of information from the human data set into each of the smaller data sets – see the DELTA model theory section for more details. The best performing models for mouse and dog data were derived using the human RBP model as a reference while the best performing model for monkey data was derived using the rat RBP model. The number of compounds used for training and test sets, as well as quality metrics are shown in the figure below.
Fraction unbound in microsomes
When calculating microsomal intrinsic clearance (CLint), it is important to keep in mind that only substrate molecules that are free in solution are available for metabolism; material bound to the microsomal membrane is not. This was first recognized in an article by Austin et al. (Austin 2002). where they observed that CLint depends on microsomal concentration. The unbound clearance (CLint,u) is related to CLint by the following equation:
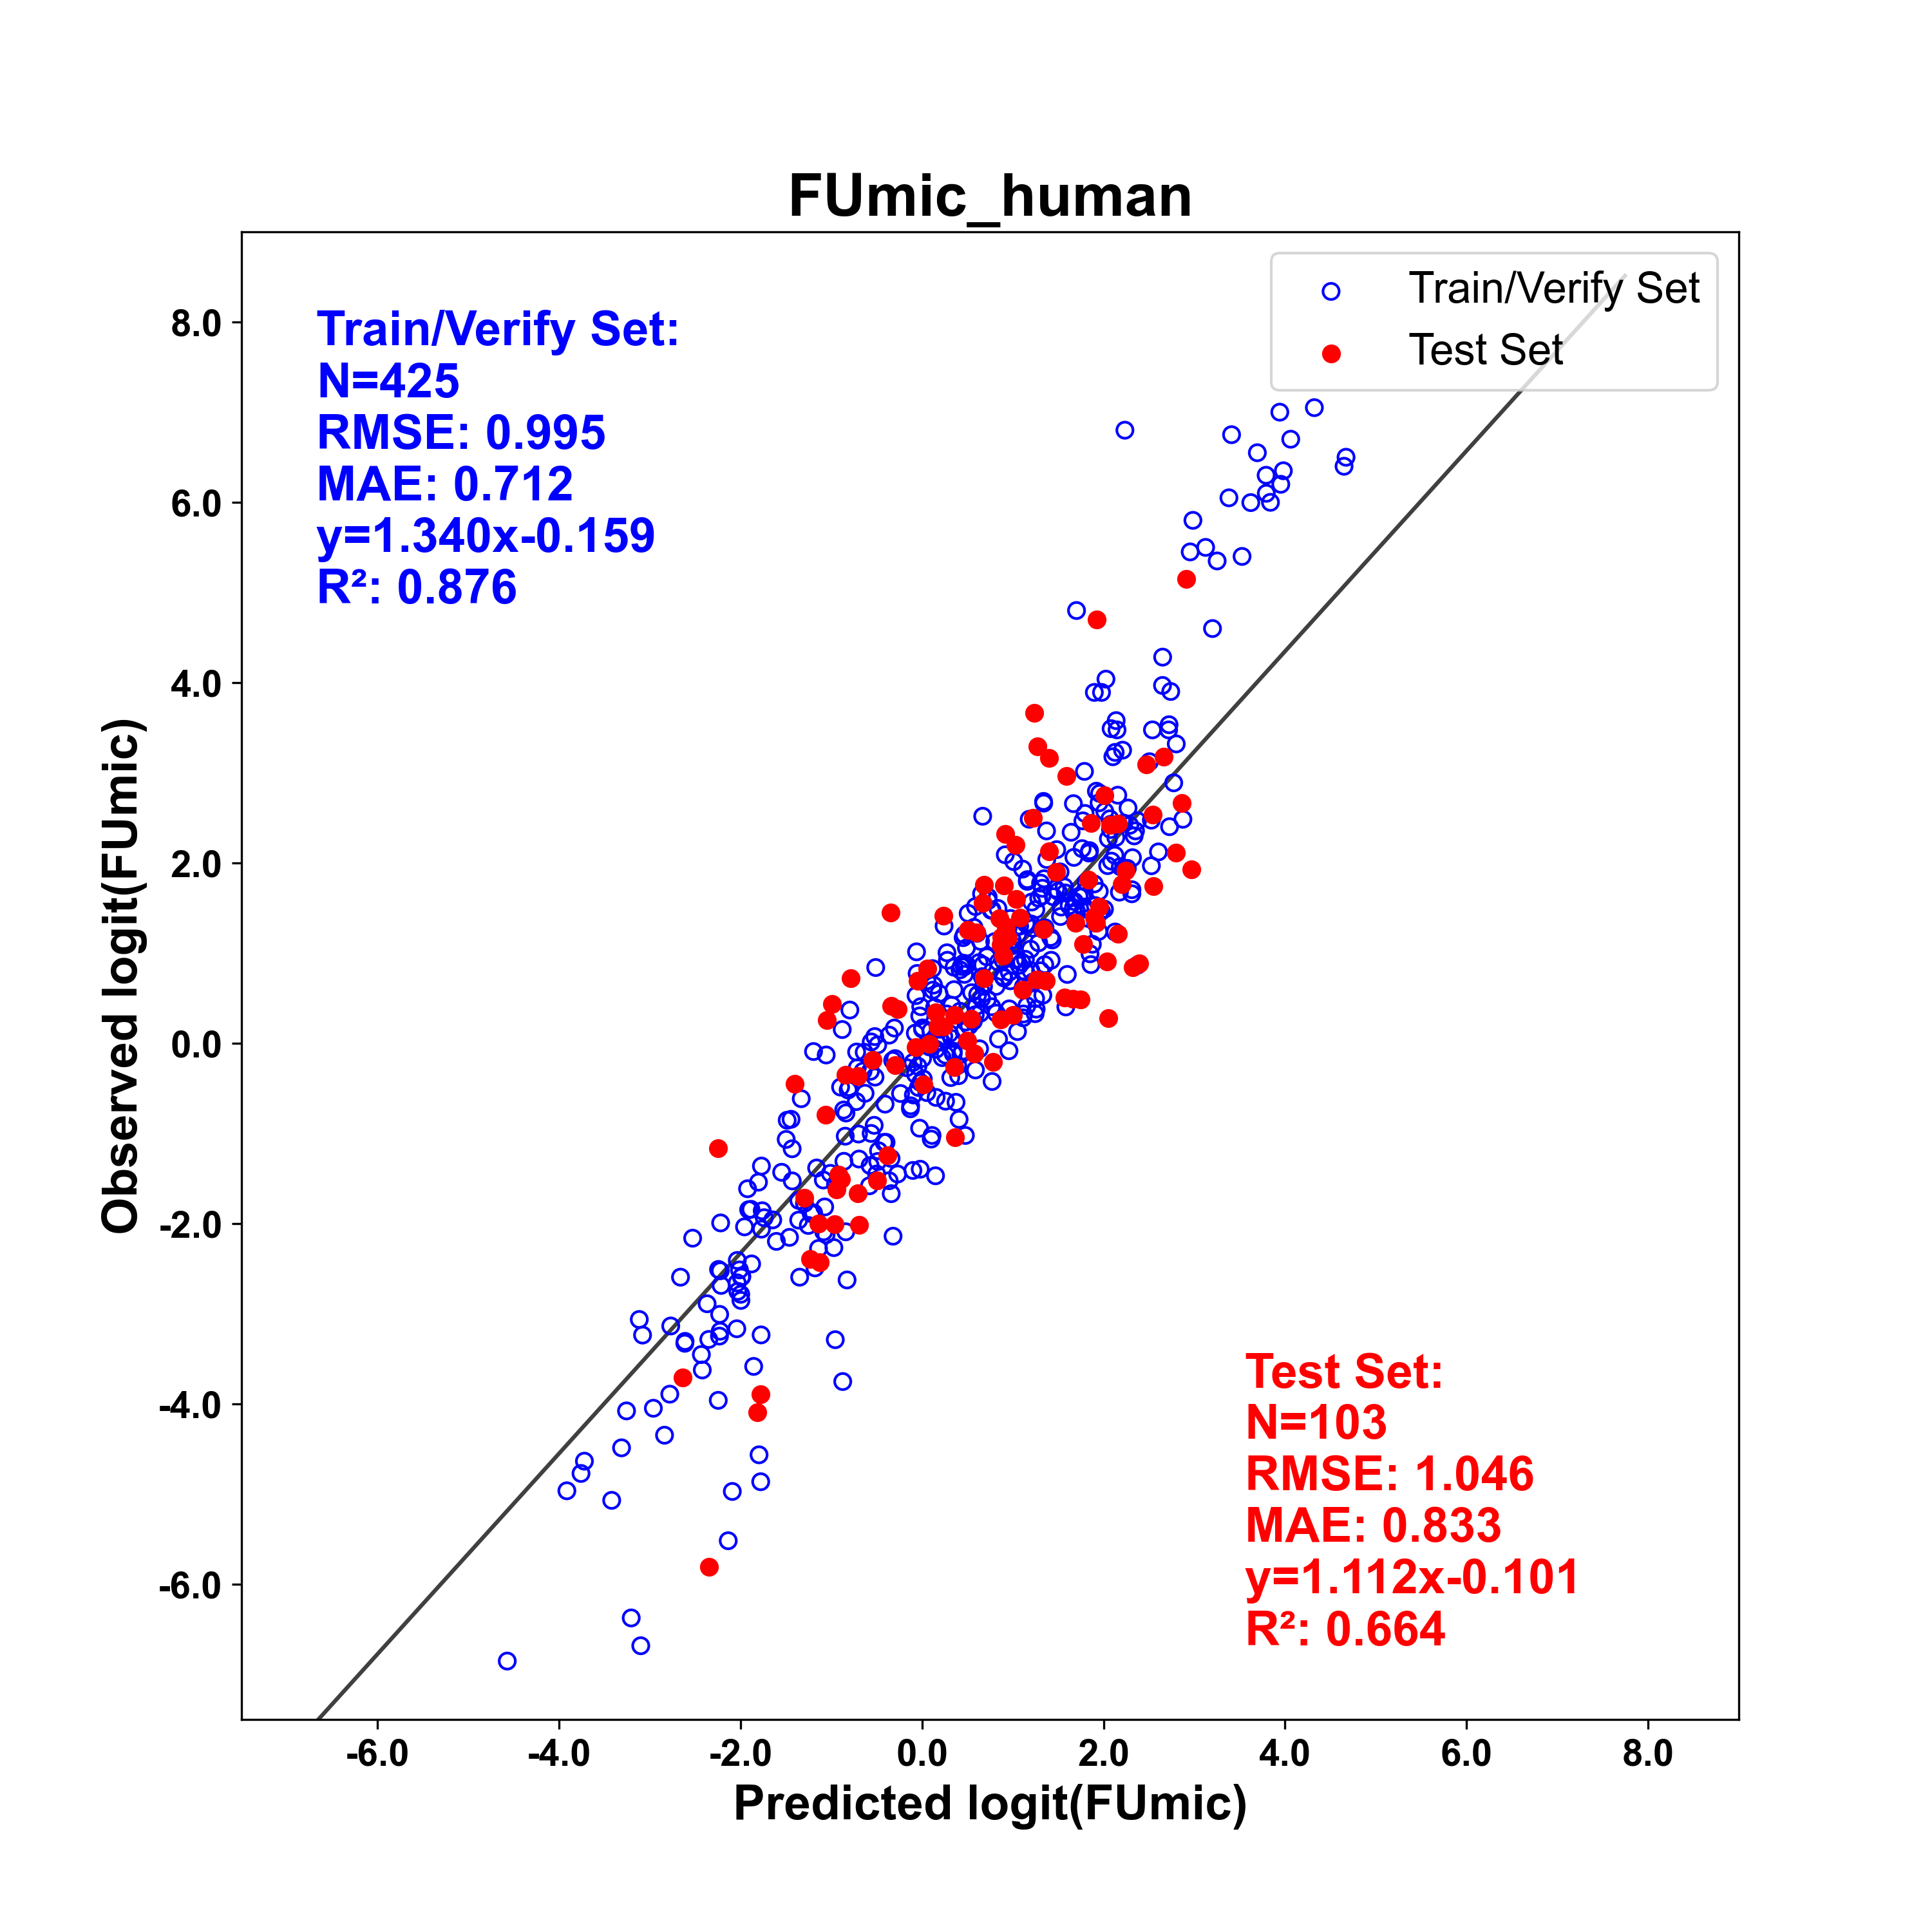
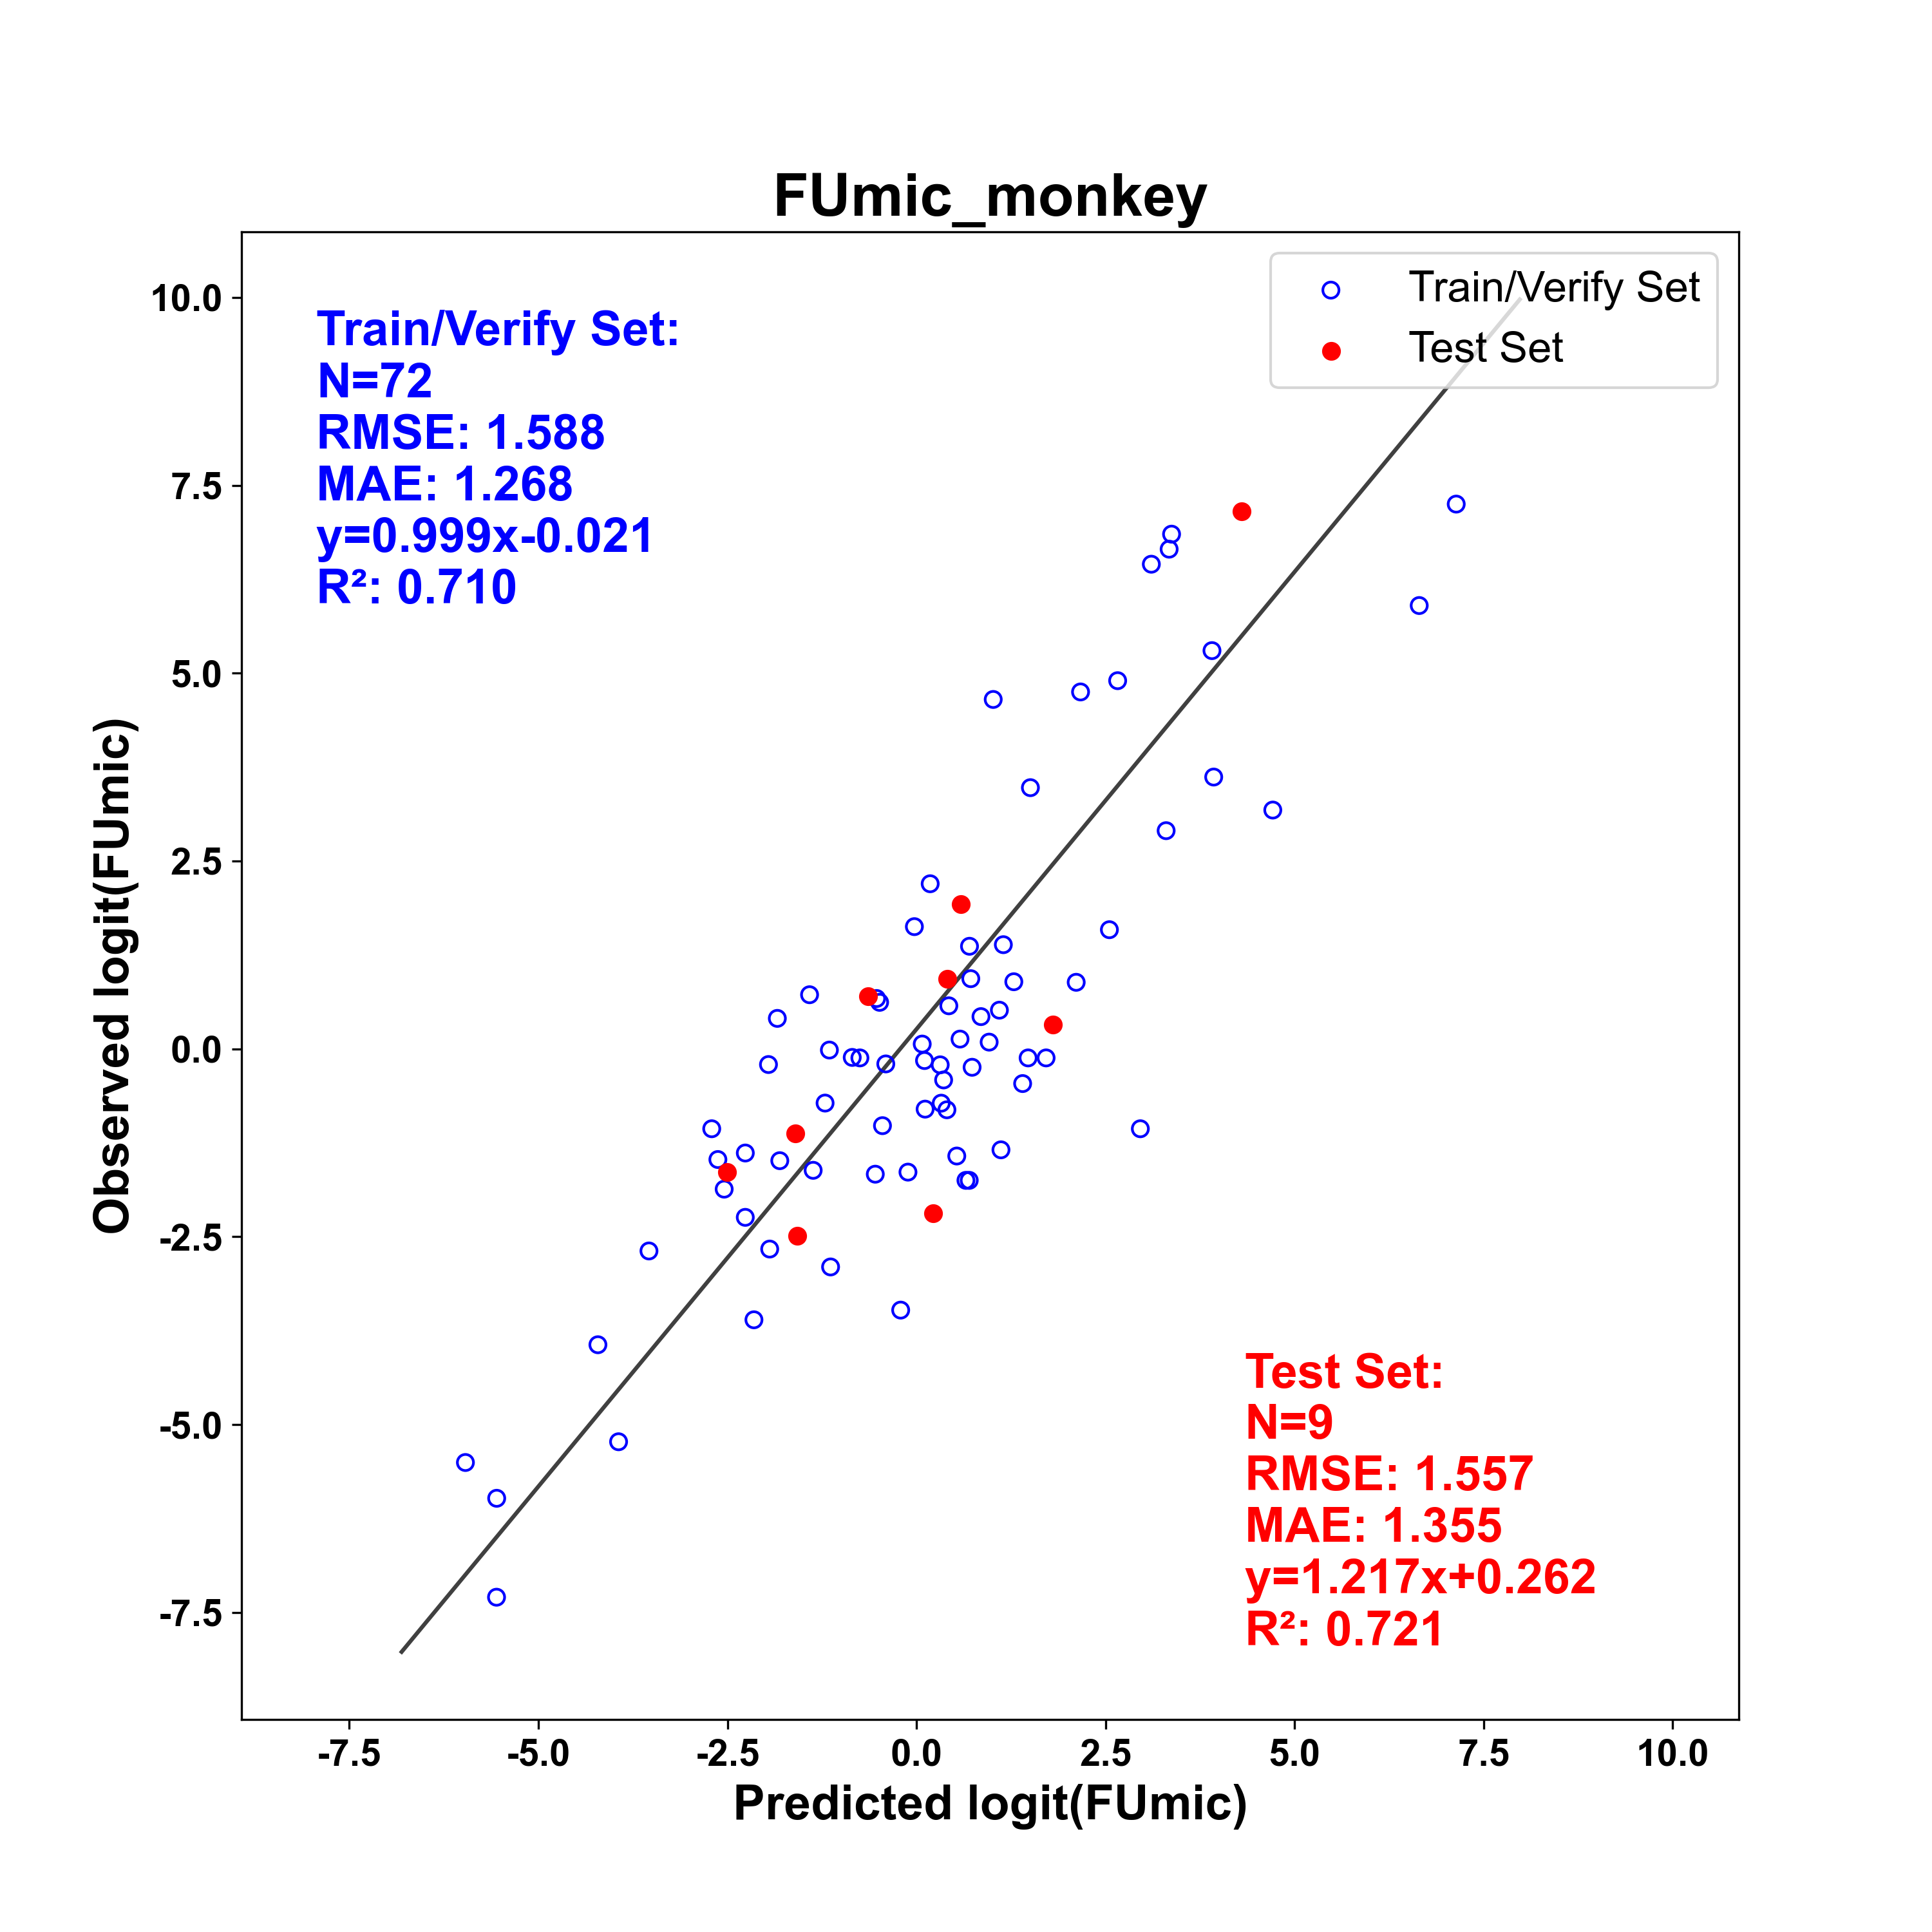
where fumic is the fraction of substrate molecules that are not bound to microsomal membranes. Austin et al. proposed an equation based on physicochemical properties to estimate the fraction unbound to microsomes (fumic) whereas we created models to predict the fraction unbound to microsomes in five species (fumic_hum, fumic_mky, fumic_dog, fumic_rat, fumic_mou). Data was collected from studies using human, monkey (combined macaca fascicularis and mulatta), dog, rat, and mouse microsomes. For molecules for which there were multiple measurements, the median value was taken. In all, the human model contains 528 compounds, of which 90 broke at least one Ro5, including 10 macrocycles and 2 cyclic peptides. The monkey model contains 81 compounds, of which 18 broke at least one Ro5. The dog model contains 100 compounds, of which 23 broke at least one Ro5, including 1 macrocycle. The rat model contains 75 compounds, of which 17 broke at least one Ro5. The mouse model contains 90 compounds, 20 of which broke at least one Ro5, including 7 PROTACs.
The data use to build the fumic models were converted to a microsomal concentration of 1.0 mg/mL using the following equation (Austin_2002) below. In other words, our fumic model predictions are at 1.0 mg/mL microsomal protein concentration.
'%3e%3cg transform='translate(167%2c0)'%3e%3cg transform='translate(-13%2c0)'%3e%3cg transform='translate(0%2c31)'%3e%3cuse xlink:href='%23MJMATHI-66' x='0' y='0'%3e%3c/use%3e%3cg transform='translate(550%2c0)'%3e%3cuse xlink:href='%23MJMATHI-75' x='0' y='0'%3e%3c/use%3e%3cuse transform='scale(0.707)' xlink:href='%23MJMAIN-32' x='809' y='-213'%3e%3c/use%3e%3c/g%3e%3cuse xlink:href='%23MJMAIN-3D' x='1854' y='0'%3e%3c/use%3e%3cg transform='translate(2633%2c0)'%3e%3cg transform='translate(397%2c0)'%3e%3crect stroke='none' width='7110' height='60' x='0' y='220'%3e%3c/rect%3e%3cg transform='translate(2309%2c570)'%3e%3cuse transform='scale(0.707)' xlink:href='%23MJMATHI-43' x='0' y='0'%3e%3c/use%3e%3cuse transform='scale(0.5)' xlink:href='%23MJMAIN-31' x='1011' y='-213'%3e%3c/use%3e%3cuse transform='scale(0.707)' xlink:href='%23MJMAIN-D7' x='1169' y='0'%3e%3c/use%3e%3cuse transform='scale(0.707)' xlink:href='%23MJMATHI-66' x='1947' y='0'%3e%3c/use%3e%3cg transform='translate(1766%2c0)'%3e%3cuse transform='scale(0.707)' xlink:href='%23MJMATHI-75' x='0' y='0'%3e%3c/use%3e%3cuse transform='scale(0.5)' xlink:href='%23MJMAIN-31' x='809' y='-213'%3e%3c/use%3e%3c/g%3e%3c/g%3e%3cg transform='translate(60%2c-457)'%3e%3cuse transform='scale(0.707)' xlink:href='%23MJMATHI-43' x='0' y='0'%3e%3c/use%3e%3cuse transform='scale(0.5)' xlink:href='%23MJMAIN-31' x='1011' y='-213'%3e%3c/use%3e%3cuse transform='scale(0.707)' xlink:href='%23MJMAIN-D7' x='1169' y='0'%3e%3c/use%3e%3cuse transform='scale(0.707)' xlink:href='%23MJMATHI-66' x='1947' y='0'%3e%3c/use%3e%3cg transform='translate(1766%2c0)'%3e%3cuse transform='scale(0.707)' xlink:href='%23MJMATHI-75' x='0' y='0'%3e%3c/use%3e%3cuse transform='scale(0.5)' xlink:href='%23MJMAIN-31' x='809' y='-213'%3e%3c/use%3e%3c/g%3e%3cuse transform='scale(0.707)' xlink:href='%23MJMAIN-2B' x='3524' y='0'%3e%3c/use%3e%3cg transform='translate(3042%2c0)'%3e%3cuse transform='scale(0.707)' xlink:href='%23MJMATHI-43' x='0' y='0'%3e%3c/use%3e%3cuse transform='scale(0.5)' xlink:href='%23MJMAIN-32' x='1011' y='-213'%3e%3c/use%3e%3c/g%3e%3cuse transform='scale(0.707)' xlink:href='%23MJMAIN-D7' x='5472' y='0'%3e%3c/use%3e%3cuse transform='scale(0.707)' xlink:href='%23MJMAIN-28' x='6251' y='0'%3e%3c/use%3e%3cuse transform='scale(0.707)' xlink:href='%23MJMAIN-31' x='6640' y='0'%3e%3c/use%3e%3cuse transform='scale(0.707)' xlink:href='%23MJMAIN-2212' x='7141' y='0'%3e%3c/use%3e%3cuse transform='scale(0.707)' xlink:href='%23MJMATHI-66' x='7919' y='0'%3e%3c/use%3e%3cg transform='translate(5989%2c0)'%3e%3cuse transform='scale(0.707)' xlink:href='%23MJMATHI-75' x='0' y='0'%3e%3c/use%3e%3cuse transform='scale(0.5)' xlink:href='%23MJMAIN-31' x='809' y='-213'%3e%3c/use%3e%3c/g%3e%3cuse transform='scale(0.707)' xlink:href='%23MJMAIN-29' x='9496' y='0'%3e%3c/use%3e%3c/g%3e%3c/g%3e%3c/g%3e%3c/g%3e%3c/g%3e%3c/g%3e%3c/g%3e%3c/svg%3e)
where fu2 is the fumic at concentration C2 (1.0 mg/mL) and fu1 is fumic at concentration C1. The models were built in logit space, but the final predictions shown on the spreadsheet are transformed back to the linear space, providing a range between 0 and 1. Predicting fumic values above 1 is not physically meaningful, and the same is true for fumic predictions ≤ 0. The former problem was addressed by “capping” all of the fumic model predictions at 1. Setting the lower bound to 0 would make calculating CLint,u impossible, so the lower bound for the model was set to lowest values in the dataset, i.e. 0.001.
As data was sparse for species other than human, we first trained an XGBoost model on the human data. This model was then used as a reference model to train Linear Boost ANNE DELTA models for the other species. This approach allows for the incorporation of information from the human data set into each of the smaller data sets – see the DELTA model theory section for more details. The number of compounds used for training and test sets, as well as quality metrics are shown in the figure below.
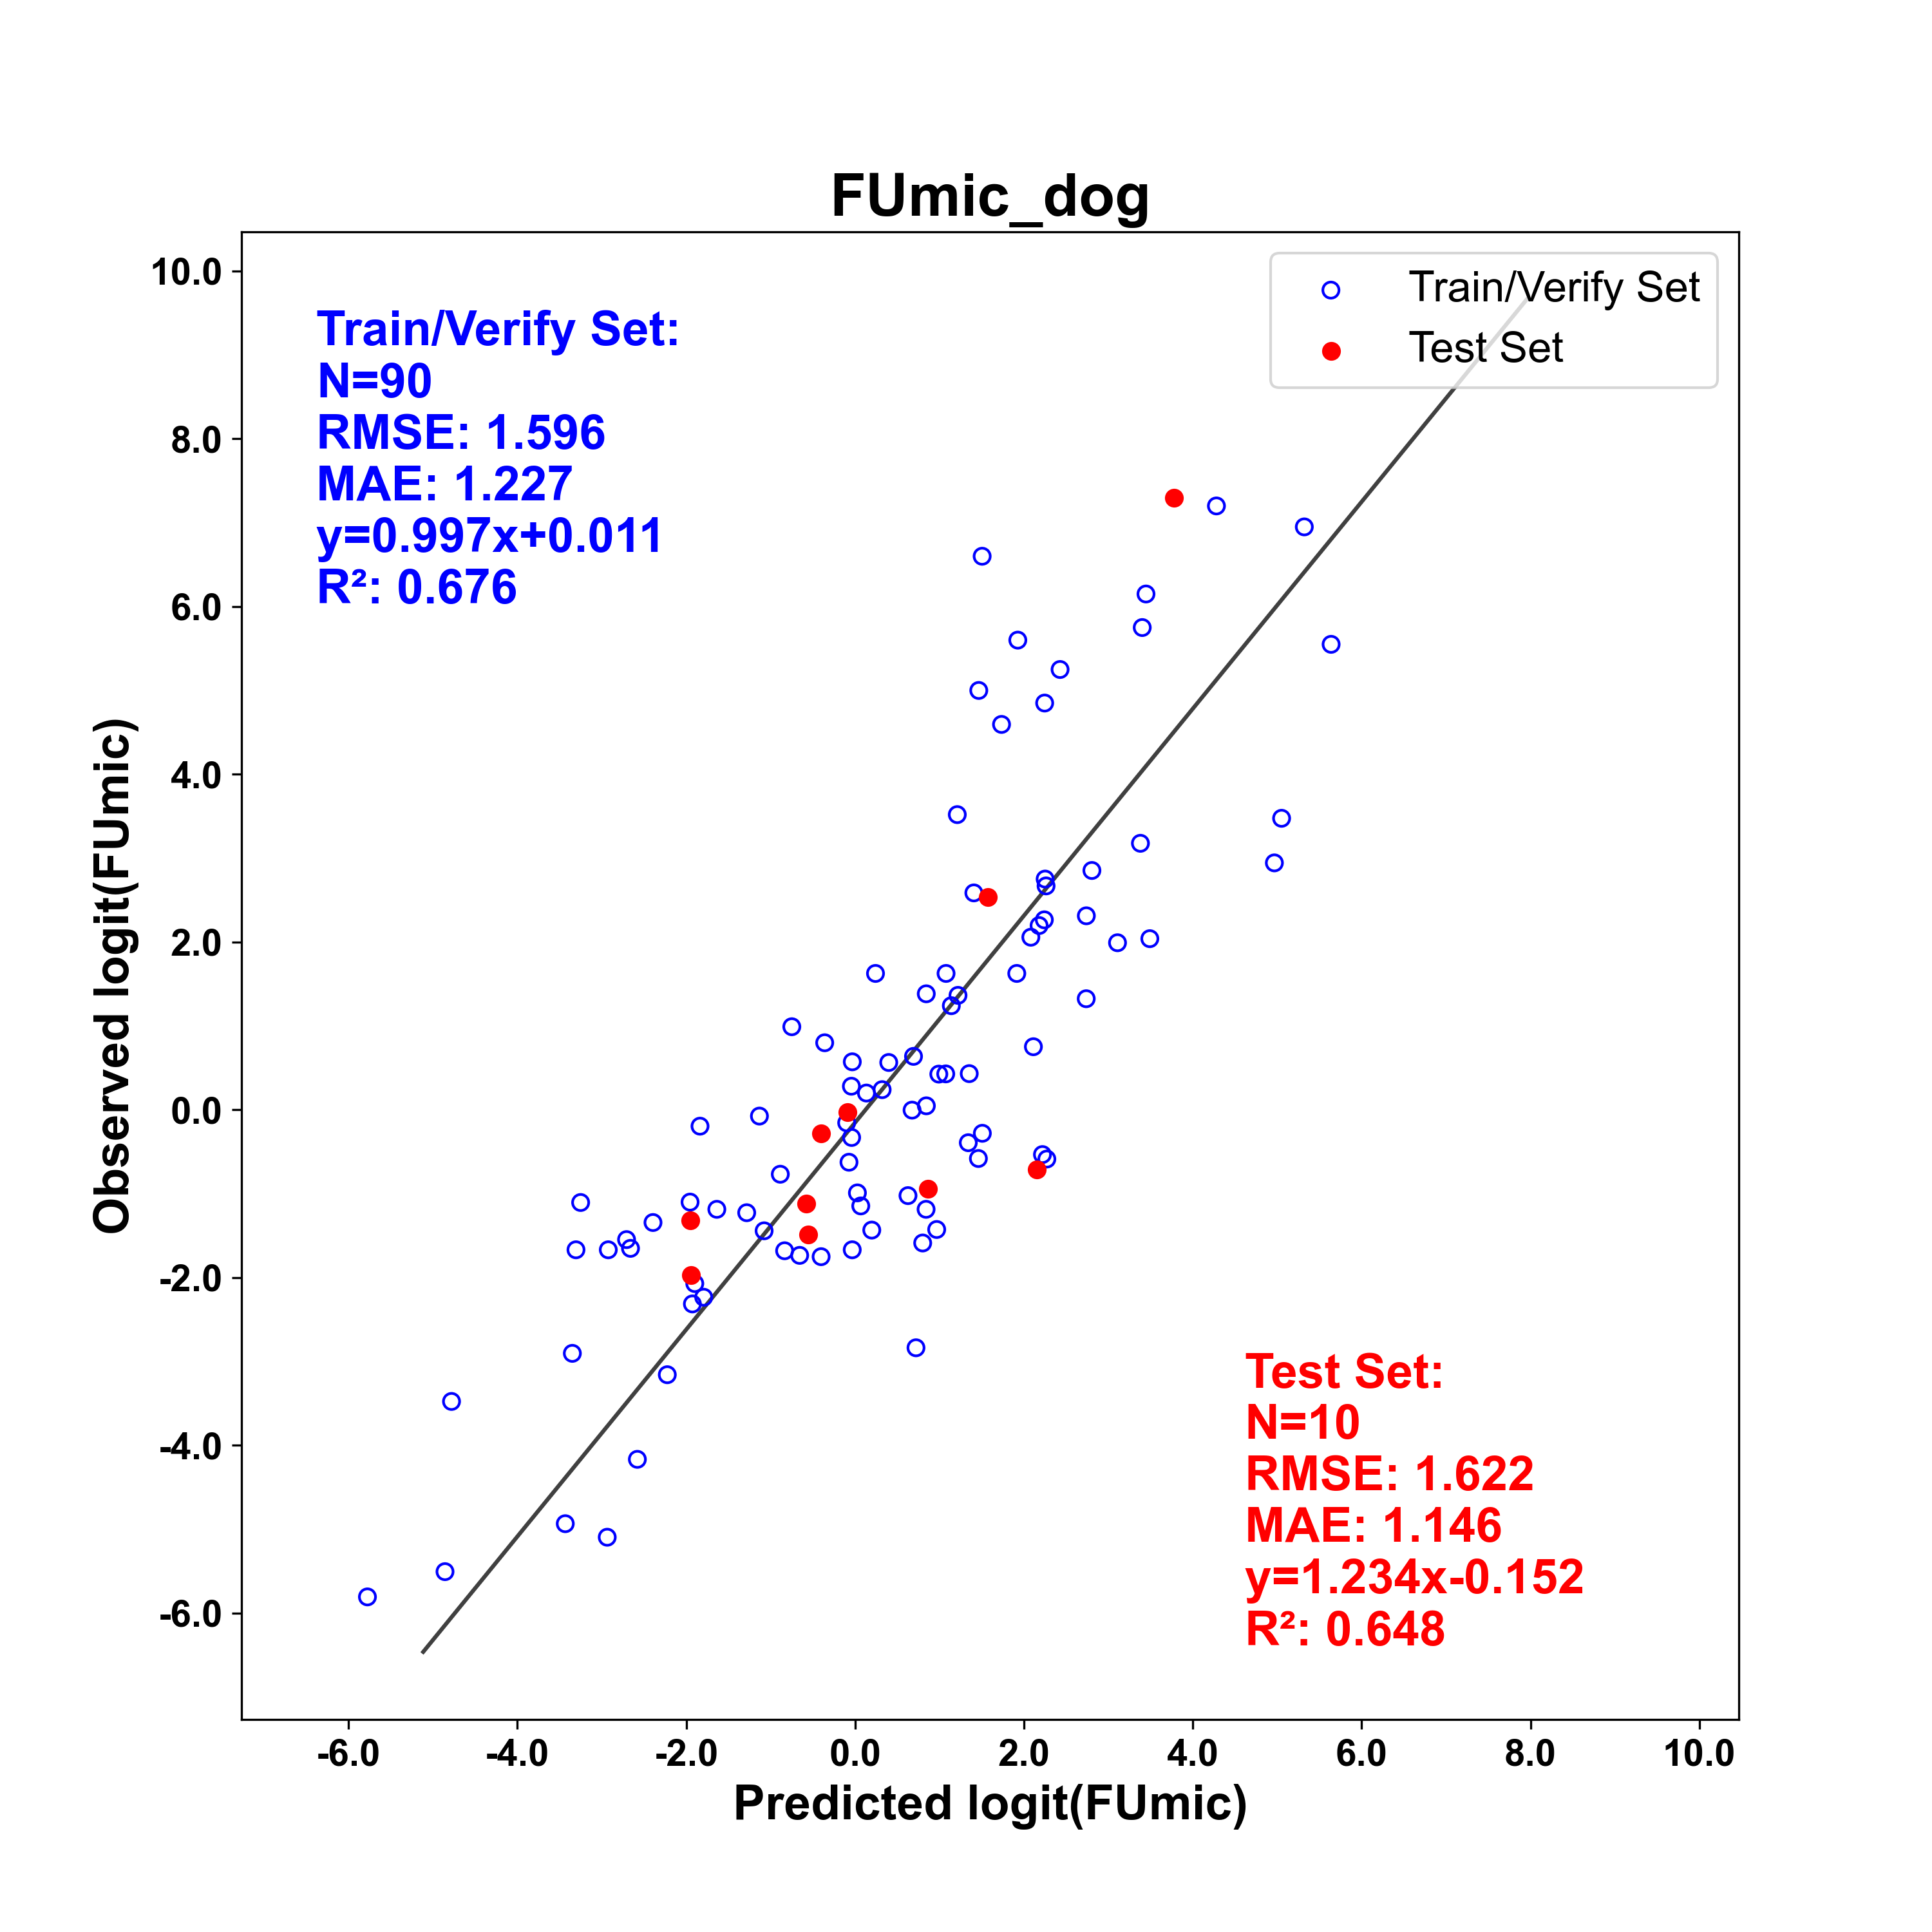
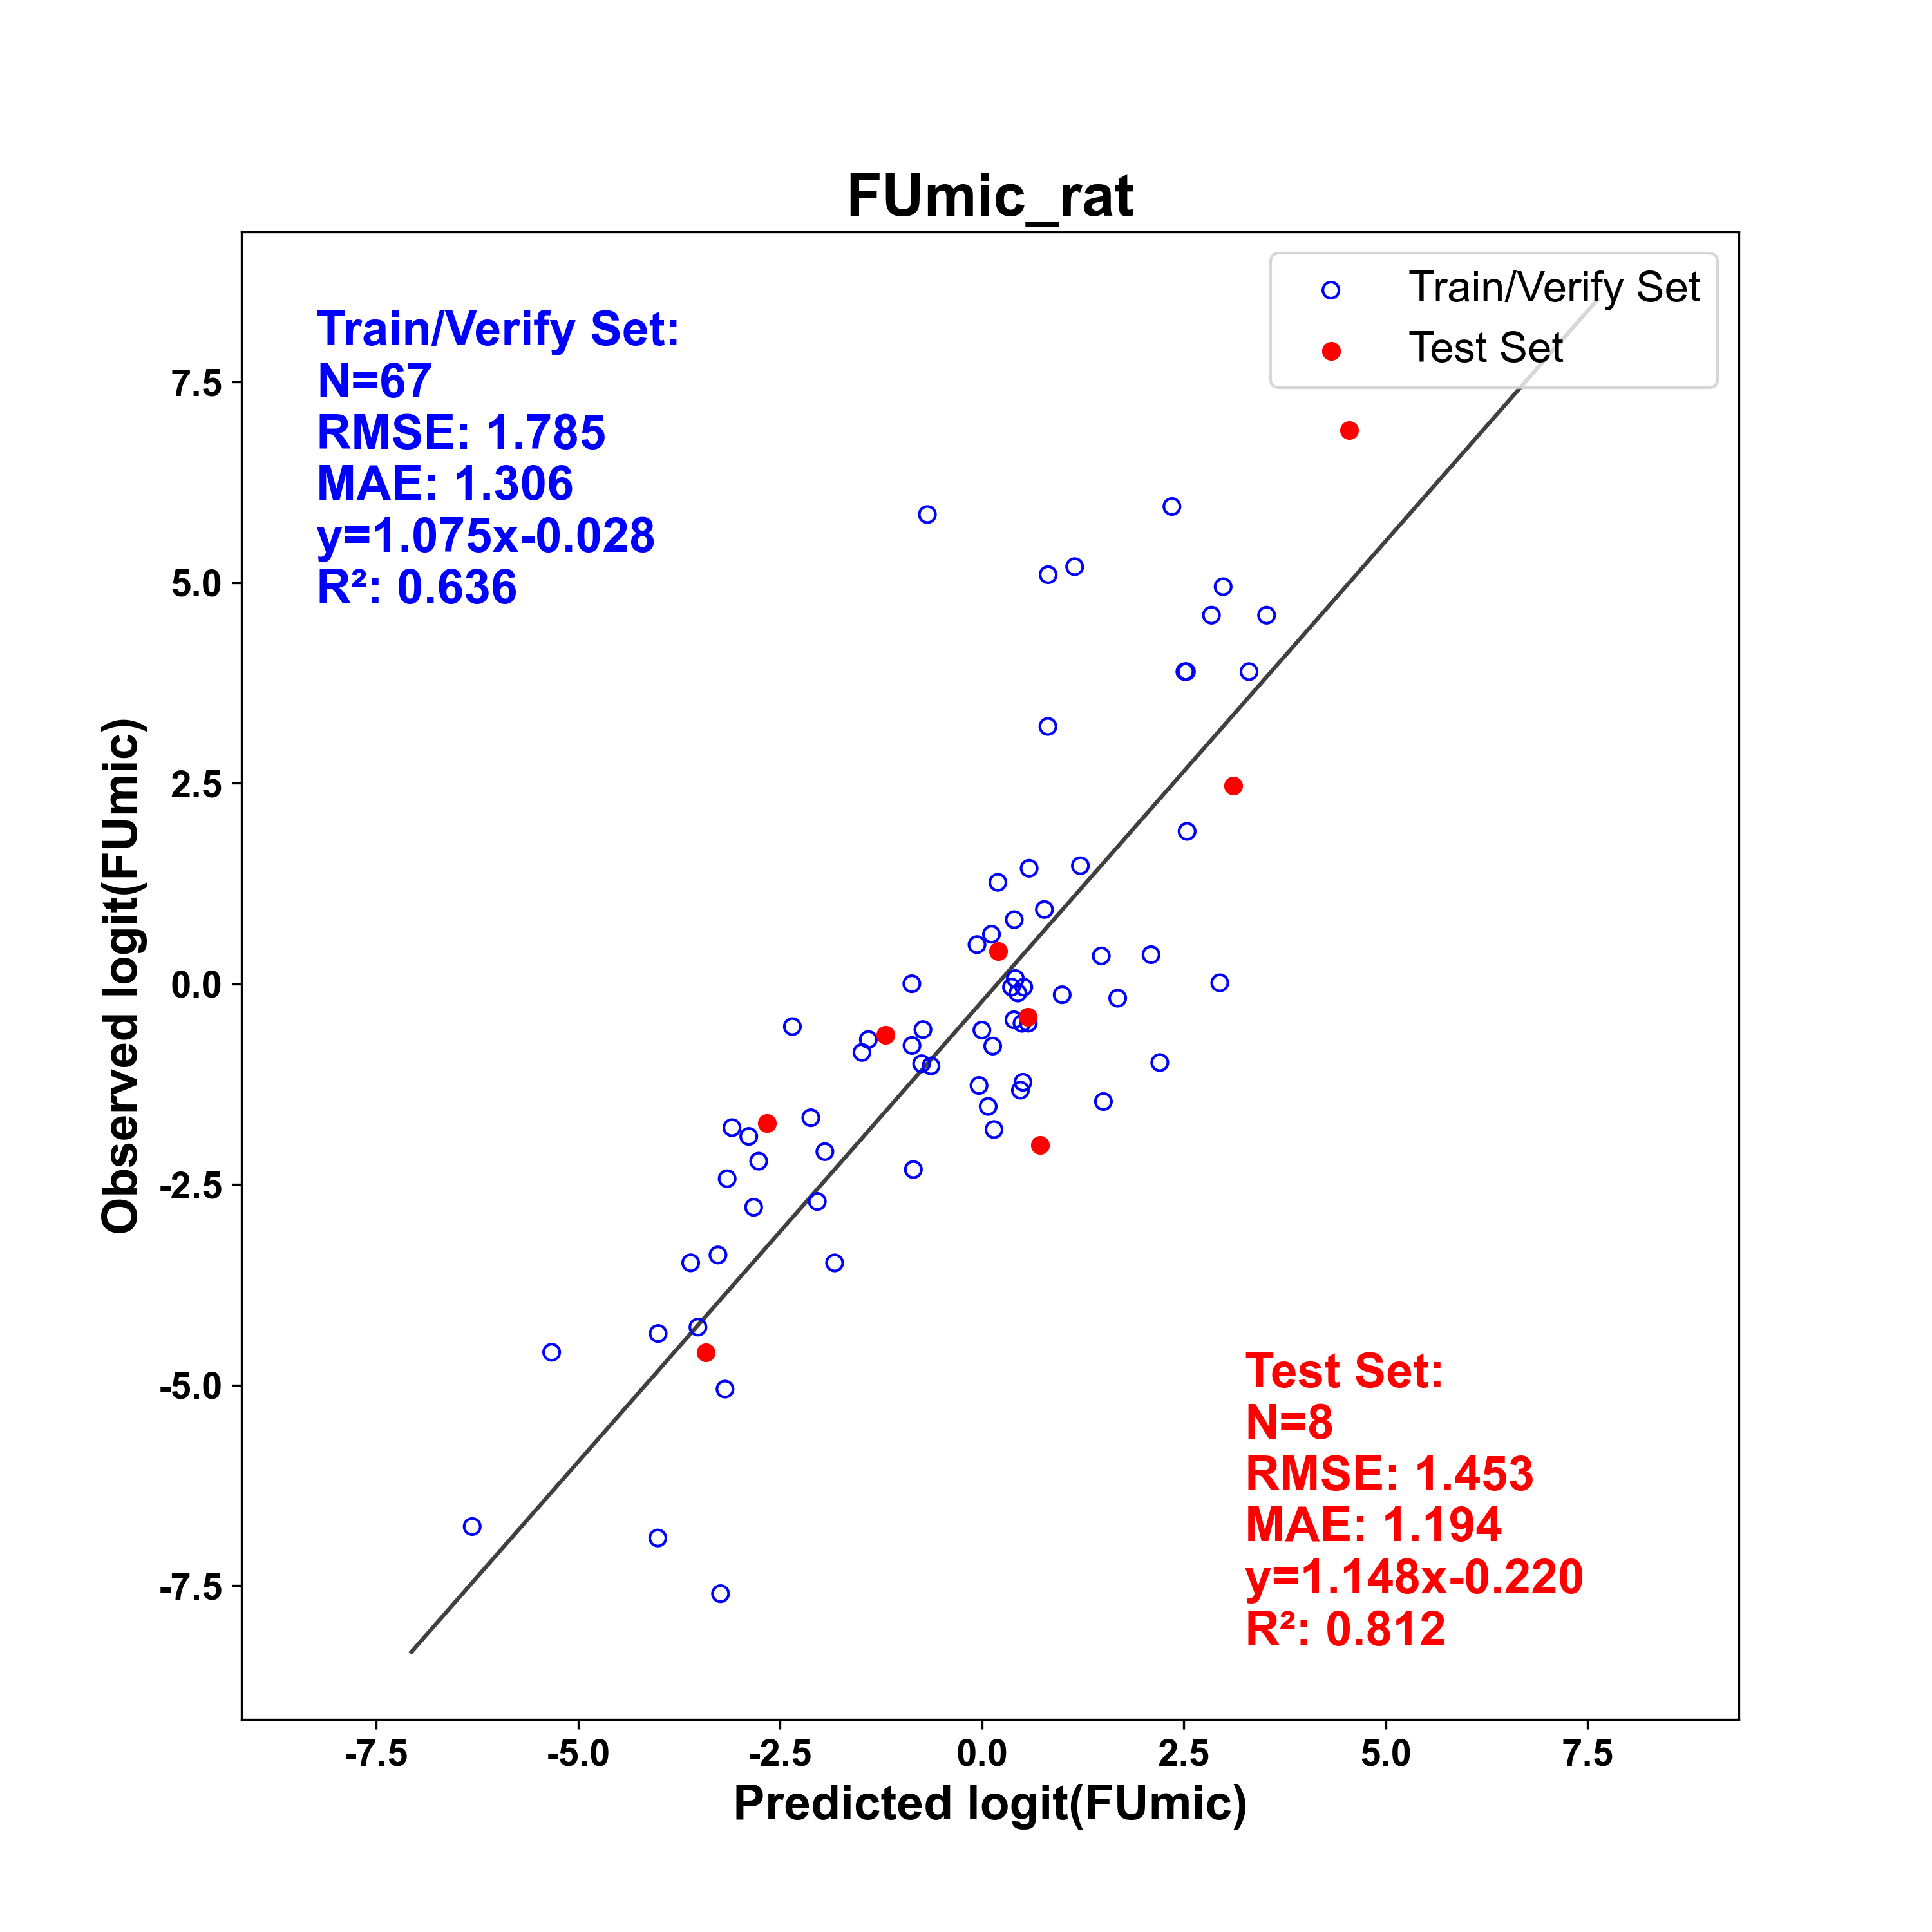
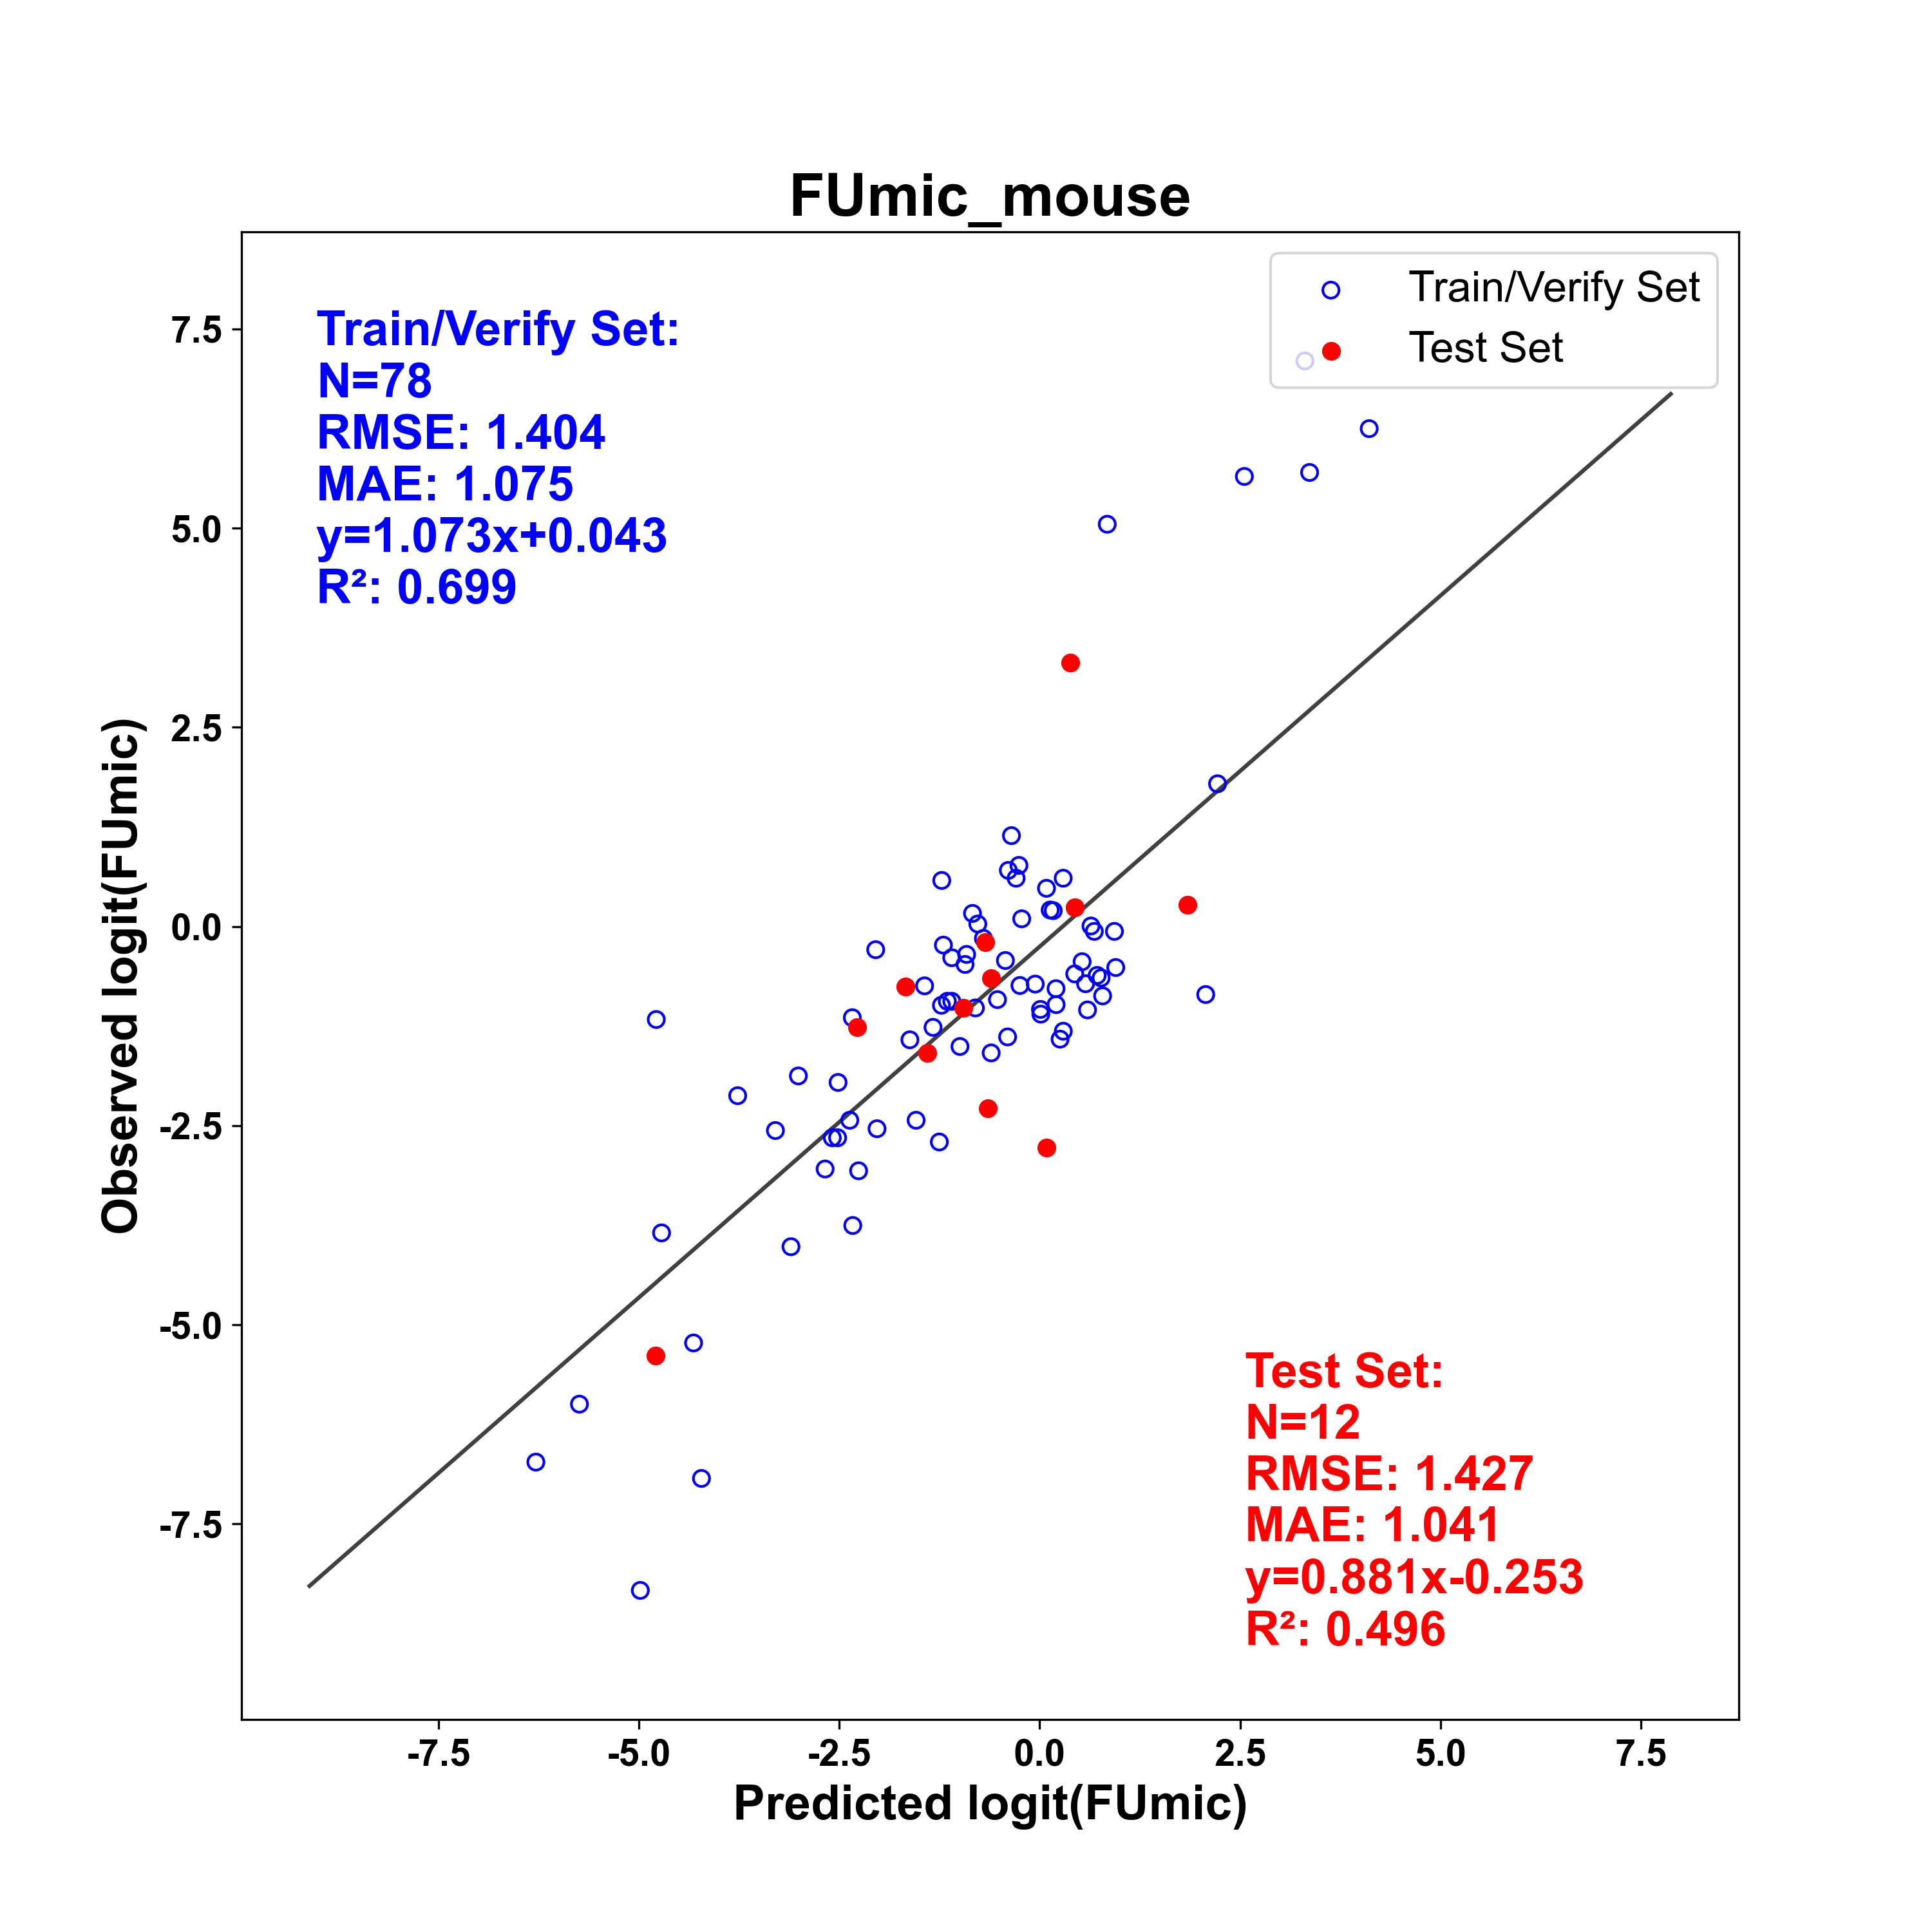
Fraction unbound in hepatocytes
To properly account for the unbound fraction of a substrate in hepatocytes when making clearance predictions we developed a S+fuhep model. The data were retrieved from scientific literature (Zanelli 2012, Barr 2019, Gardner 2022, Tess 2022). Each datapoint was carefully reviewed to ensure consistency and accuracy. Compounds from different sources were combined, and for compounds that were in more than one dataset, the median value was used. Data were obtained from experiments in which the hepatocyte concentrations was either 1.0 or 0.5×10⁶ cells/mL. We chose a reference concentration of 1.0×10⁶ cells/mL, and in relevant cases, we applied the equation from [Austin_2002], discussed above, to transform values to the reference hepatocyte concentration. The final dataset contained 104 molecules. Due to the limited data availability, we combined the measurements from experiments performed with human, rat and mouse hepatocytes. The number of compounds used for training and test sets, as well as quality metrics are shown in the figure below.
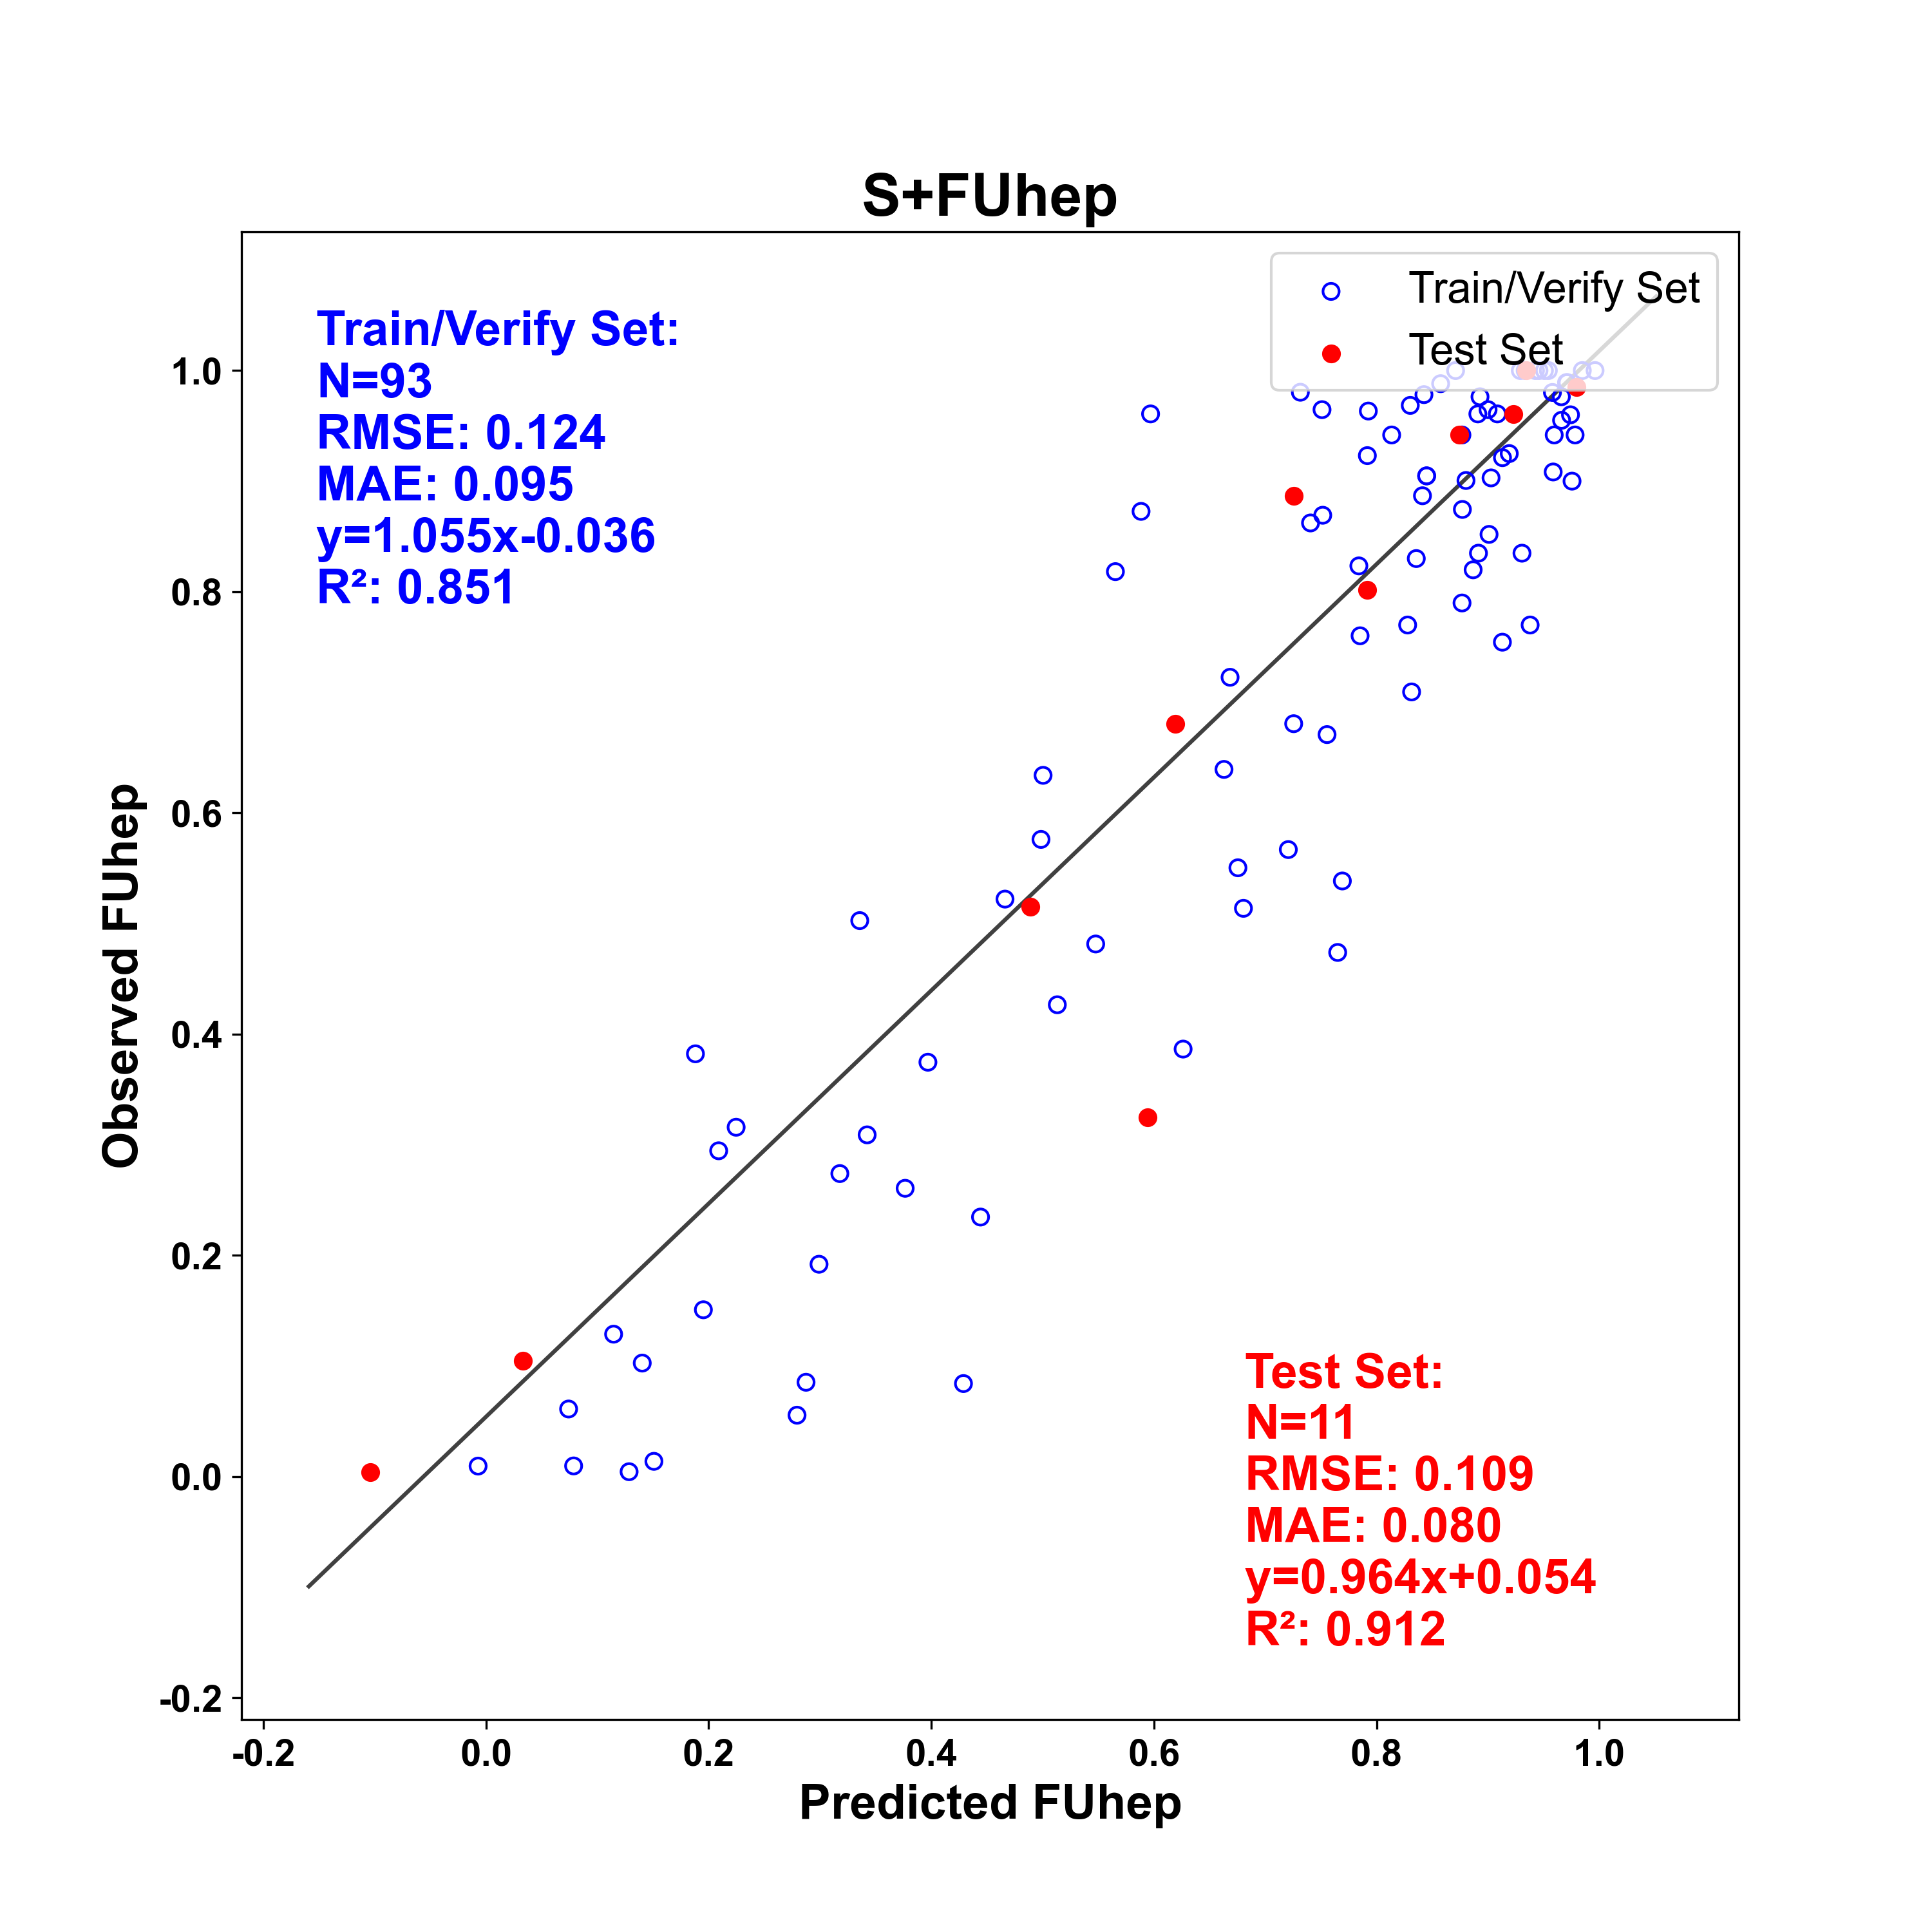
Volume of distribution
The volume of distribution at steady state is an important pharmacokinetic parameter that determines, along with clearance, the half-life of a compound. It is proportional to the quantity of the chemical distributed into body tissues. ADMET Predictor provides both 2D and 3D models to estimate the human volume of distribution at steady state (Vd). The previous version of ADMET Predictor used data from Obach et al. (Obach 2008) and other sources. The model in ADMET Predictor was updated using additional data from an updated article (Lombardo 2016). The 2D model was trained on 1,088 compounds with data for a separate set of 272 drugs that were held out for validation. Seventy (70) of the compounds in the data set are macrocycles (10 or more atoms in a ring). The literature suggests that determination of the plasma volume of distribution is problematic for chloroquine and hydroxychloroquine because of plasma separation issues (Tett 1988), so whole blood volumes were used instead. Artesunate was an extreme outlier. The pharmacokinetic studies involved in its estimation were performed on severely ill malaria patients (Newton 2006), so it was omitted from the final models. The models output a value in units of L/kg for each structure in the input file.
Note: In comparing performance statistics for the current models with those from previous versions, bear in mind that the more recent one was built on a much larger database of compounds and thus covers more chemical space.
The 3D model was built on a subset of the data set for the 2D model. The 3D structures of the molecules were generated using the SMILES string in a script that retrieves the 3D SDF file from the National Cancer Institute’s “Online SMILES Translator” (https://cactus.nci.nih.gov/). Below is a plot of the log of the observed values as a function of the log of the predicted values.
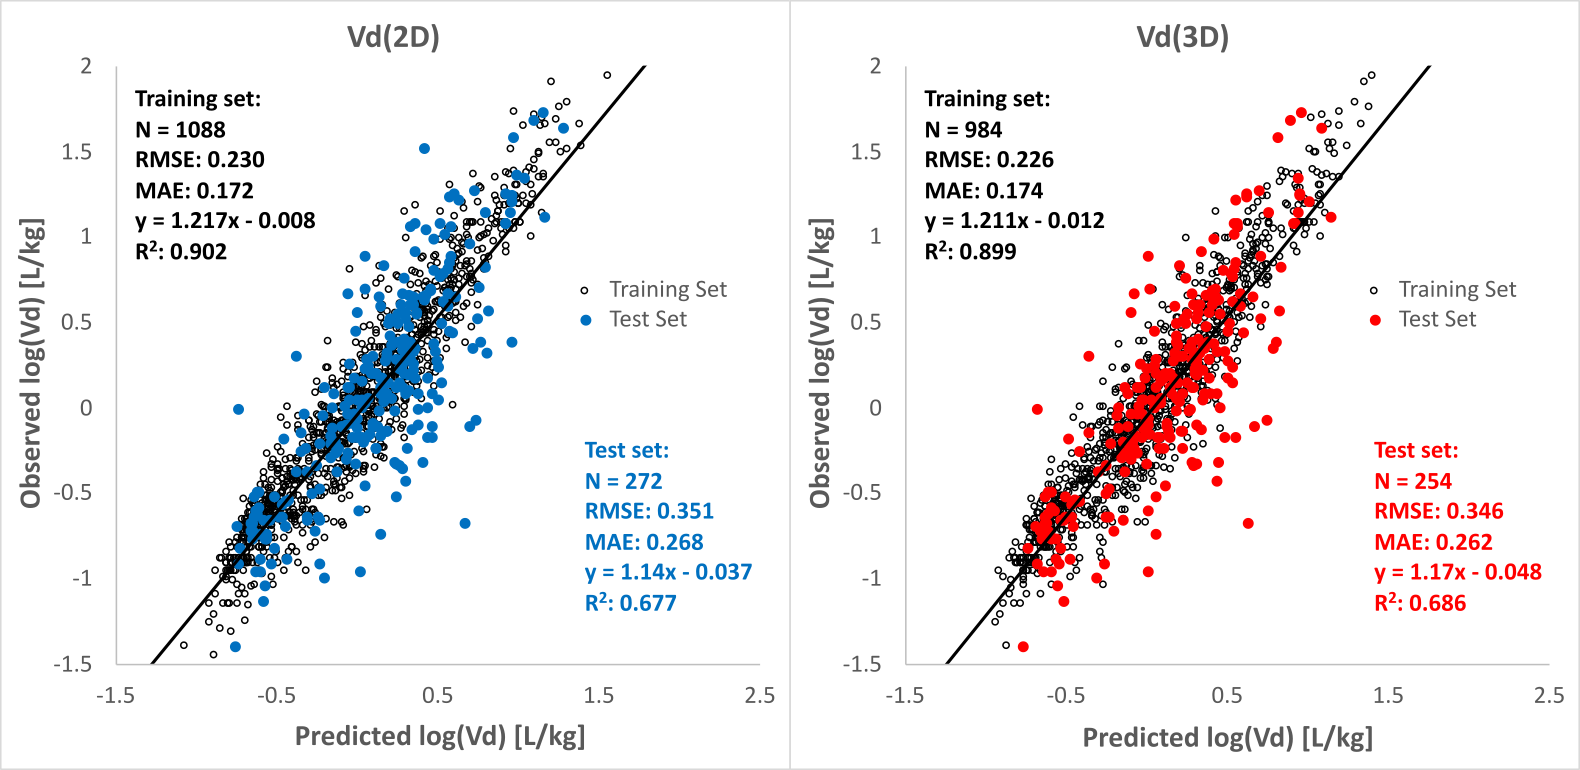
Vd predicts the volume of distribution at steady state in humans. Alternative, mechanistic models for the volume of distribution in humans (S+hVd_PBPK) and in rats (S+rVd_PBPK) are available as part of the Simulation Module. The total amount of blood in the human body is about 0.07 L/kg; volumes of distribution above this value suggest distribution beyond the blood into tissues. Values above 1.0 L/kg imply preferential accumulation in one or more tissues or subcellular compartments. Compounds with a high logP often partition into lipids, whereas some amines accumulate in acidic intracellular compartments such as lysosomes. When this happens, the volume of distribution itself becomes a bit of a non-physical abstraction. The two estimates can differ substantially, partly due to kinetic effects and partly because the methods make different simplifying assumptions.
Note: Vd was the first XGBoost ensemble model added to ADMET Predictor.