2.7.4. Intrinsic Clearance
Hepatic metabolism along with plasma binding have greatest effect on clearance. The liver is the most important site of drug metabolism in the body. Most of the drug metabolizing reactions are Phase I metabolism, and include oxidation, reduction or hydrolysis. These Phase I metabolism reactions are performed by CYP450 family enzymes.
In vitro models to predict compound metabolism have been accepted widely along with animal testing. The widely accepted in vitro method to study the hepatic metabolism include hepatocytes (isolated cells of liver) or microsomal preparations which are extracted from liver homogenates. The drug (or the compound) is incubated with hepatocytes (or microsomes) and the disappearance of the drug is monitored. This disappearance is called intrinsic clearance. The hepatocyte clearance or microsomal clearance can be converted to hepatic clearance with appropriate scaling factors.
ADMET Predictor provides the prediction of human, rat, mouse, dog, and monkey liver microsomal clearance and hepatocyte intrinsic clearance. We have collected the intrinsic clearance data for rat, mouse, dog, monkey (combining fascicularis and mulatta), and human microsomal systems as well as hepatocyte clearance from various databases and original literature. All the compounds were checked and curated extensively for errors and reported clearance values. The most common errors included wrong (or incomplete) units of the clearance, a few errors in structures, and wrong assay descriptions.
In vitro intrinsic clearance values were converted to unbound intrinsic clearance, CLint,u , by dividing CLint by the fraction unbound to microsomes using the procedure below.
For microsomal clearance, we extracted the microsomal protein concentration from the assay descriptions. Most of the LM clearance assays were conducted at a microsomal concentration of 0.5 and 1.0 mg microsomal protein (MP) per mL but there were also cases of 0.1, 0.2, 0.4, 0.56, 0.8, and 1.25 mg MP per mL. If the concentration of microsomal protein was not mentioned in the assay description or in the original literature, the value was assumed to be 0.5 mg MP per mL. Our fumic models are standardized to 1.0 mg MP/mL so we first predicted fumic for the compound and then converted it to the experimental concentration (0.5 mg MP/mL if unknown) using the equation below (Austin et al 2002):
'%3e%3cg transform='translate(167%2c0)'%3e%3cg transform='translate(-13%2c0)'%3e%3cg transform='translate(0%2c31)'%3e%3cuse xlink:href='%23MJMATHI-66' x='0' y='0'%3e%3c/use%3e%3cg transform='translate(550%2c0)'%3e%3cuse xlink:href='%23MJMATHI-75' x='0' y='0'%3e%3c/use%3e%3cuse transform='scale(0.707)' xlink:href='%23MJMAIN-32' x='809' y='-213'%3e%3c/use%3e%3c/g%3e%3cuse xlink:href='%23MJMAIN-3D' x='1854' y='0'%3e%3c/use%3e%3cg transform='translate(2633%2c0)'%3e%3cg transform='translate(397%2c0)'%3e%3crect stroke='none' width='7110' height='60' x='0' y='220'%3e%3c/rect%3e%3cg transform='translate(2309%2c570)'%3e%3cuse transform='scale(0.707)' xlink:href='%23MJMATHI-43' x='0' y='0'%3e%3c/use%3e%3cuse transform='scale(0.5)' xlink:href='%23MJMAIN-31' x='1011' y='-213'%3e%3c/use%3e%3cuse transform='scale(0.707)' xlink:href='%23MJMAIN-D7' x='1169' y='0'%3e%3c/use%3e%3cuse transform='scale(0.707)' xlink:href='%23MJMATHI-66' x='1947' y='0'%3e%3c/use%3e%3cg transform='translate(1766%2c0)'%3e%3cuse transform='scale(0.707)' xlink:href='%23MJMATHI-75' x='0' y='0'%3e%3c/use%3e%3cuse transform='scale(0.5)' xlink:href='%23MJMAIN-31' x='809' y='-213'%3e%3c/use%3e%3c/g%3e%3c/g%3e%3cg transform='translate(60%2c-457)'%3e%3cuse transform='scale(0.707)' xlink:href='%23MJMATHI-43' x='0' y='0'%3e%3c/use%3e%3cuse transform='scale(0.5)' xlink:href='%23MJMAIN-31' x='1011' y='-213'%3e%3c/use%3e%3cuse transform='scale(0.707)' xlink:href='%23MJMAIN-D7' x='1169' y='0'%3e%3c/use%3e%3cuse transform='scale(0.707)' xlink:href='%23MJMATHI-66' x='1947' y='0'%3e%3c/use%3e%3cg transform='translate(1766%2c0)'%3e%3cuse transform='scale(0.707)' xlink:href='%23MJMATHI-75' x='0' y='0'%3e%3c/use%3e%3cuse transform='scale(0.5)' xlink:href='%23MJMAIN-31' x='809' y='-213'%3e%3c/use%3e%3c/g%3e%3cuse transform='scale(0.707)' xlink:href='%23MJMAIN-2B' x='3524' y='0'%3e%3c/use%3e%3cg transform='translate(3042%2c0)'%3e%3cuse transform='scale(0.707)' xlink:href='%23MJMATHI-43' x='0' y='0'%3e%3c/use%3e%3cuse transform='scale(0.5)' xlink:href='%23MJMAIN-32' x='1011' y='-213'%3e%3c/use%3e%3c/g%3e%3cuse transform='scale(0.707)' xlink:href='%23MJMAIN-D7' x='5472' y='0'%3e%3c/use%3e%3cuse transform='scale(0.707)' xlink:href='%23MJMAIN-28' x='6251' y='0'%3e%3c/use%3e%3cuse transform='scale(0.707)' xlink:href='%23MJMAIN-31' x='6640' y='0'%3e%3c/use%3e%3cuse transform='scale(0.707)' xlink:href='%23MJMAIN-2212' x='7141' y='0'%3e%3c/use%3e%3cuse transform='scale(0.707)' xlink:href='%23MJMATHI-66' x='7919' y='0'%3e%3c/use%3e%3cg transform='translate(5989%2c0)'%3e%3cuse transform='scale(0.707)' xlink:href='%23MJMATHI-75' x='0' y='0'%3e%3c/use%3e%3cuse transform='scale(0.5)' xlink:href='%23MJMAIN-31' x='809' y='-213'%3e%3c/use%3e%3c/g%3e%3cuse transform='scale(0.707)' xlink:href='%23MJMAIN-29' x='9496' y='0'%3e%3c/use%3e%3c/g%3e%3c/g%3e%3c/g%3e%3c/g%3e%3c/g%3e%3c/g%3e%3c/g%3e%3c/svg%3e)
where fu2 corresponds to the fraction unbound to microsomes at the experimental microsomal concentration, C1 is 1.0 (the concentration of our fumic model for the appropriate species), fu1 is the predicted fumic from the appropriate species, adn C2 is the concentration of experimental assay (usually 0.5). fumic was then used to calculate the unbound intrinsic clearance, CLint,u.
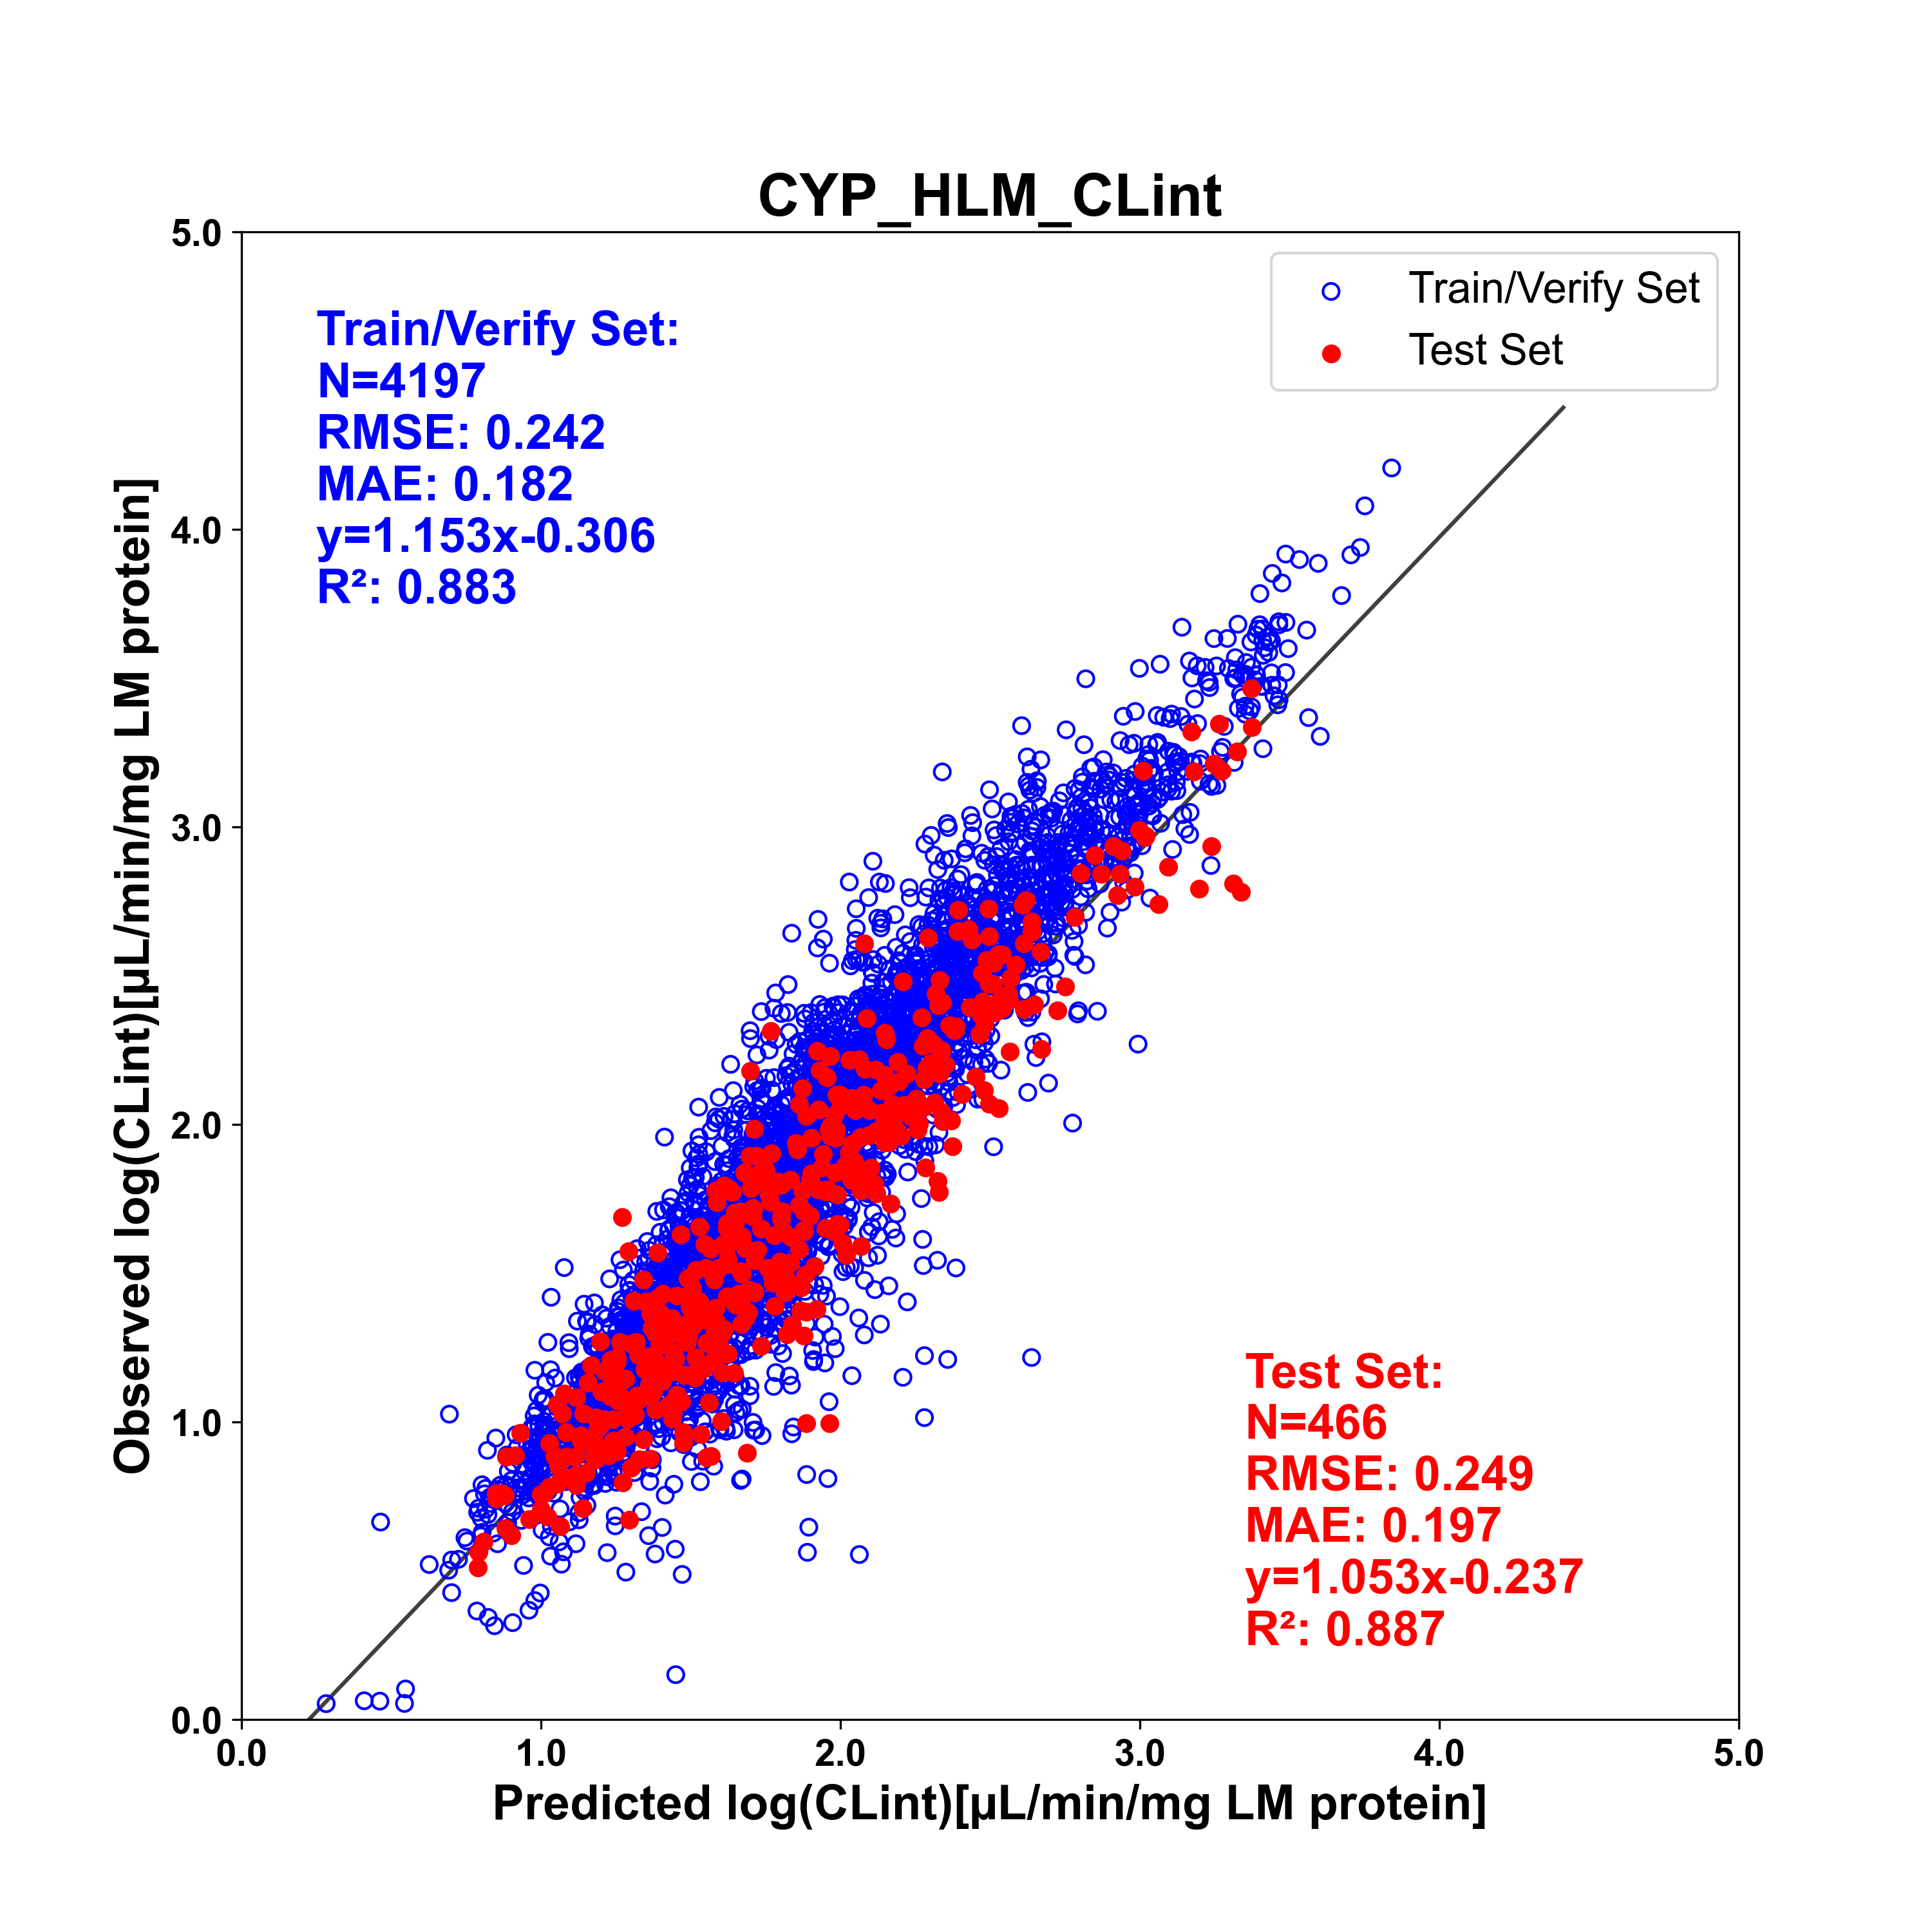
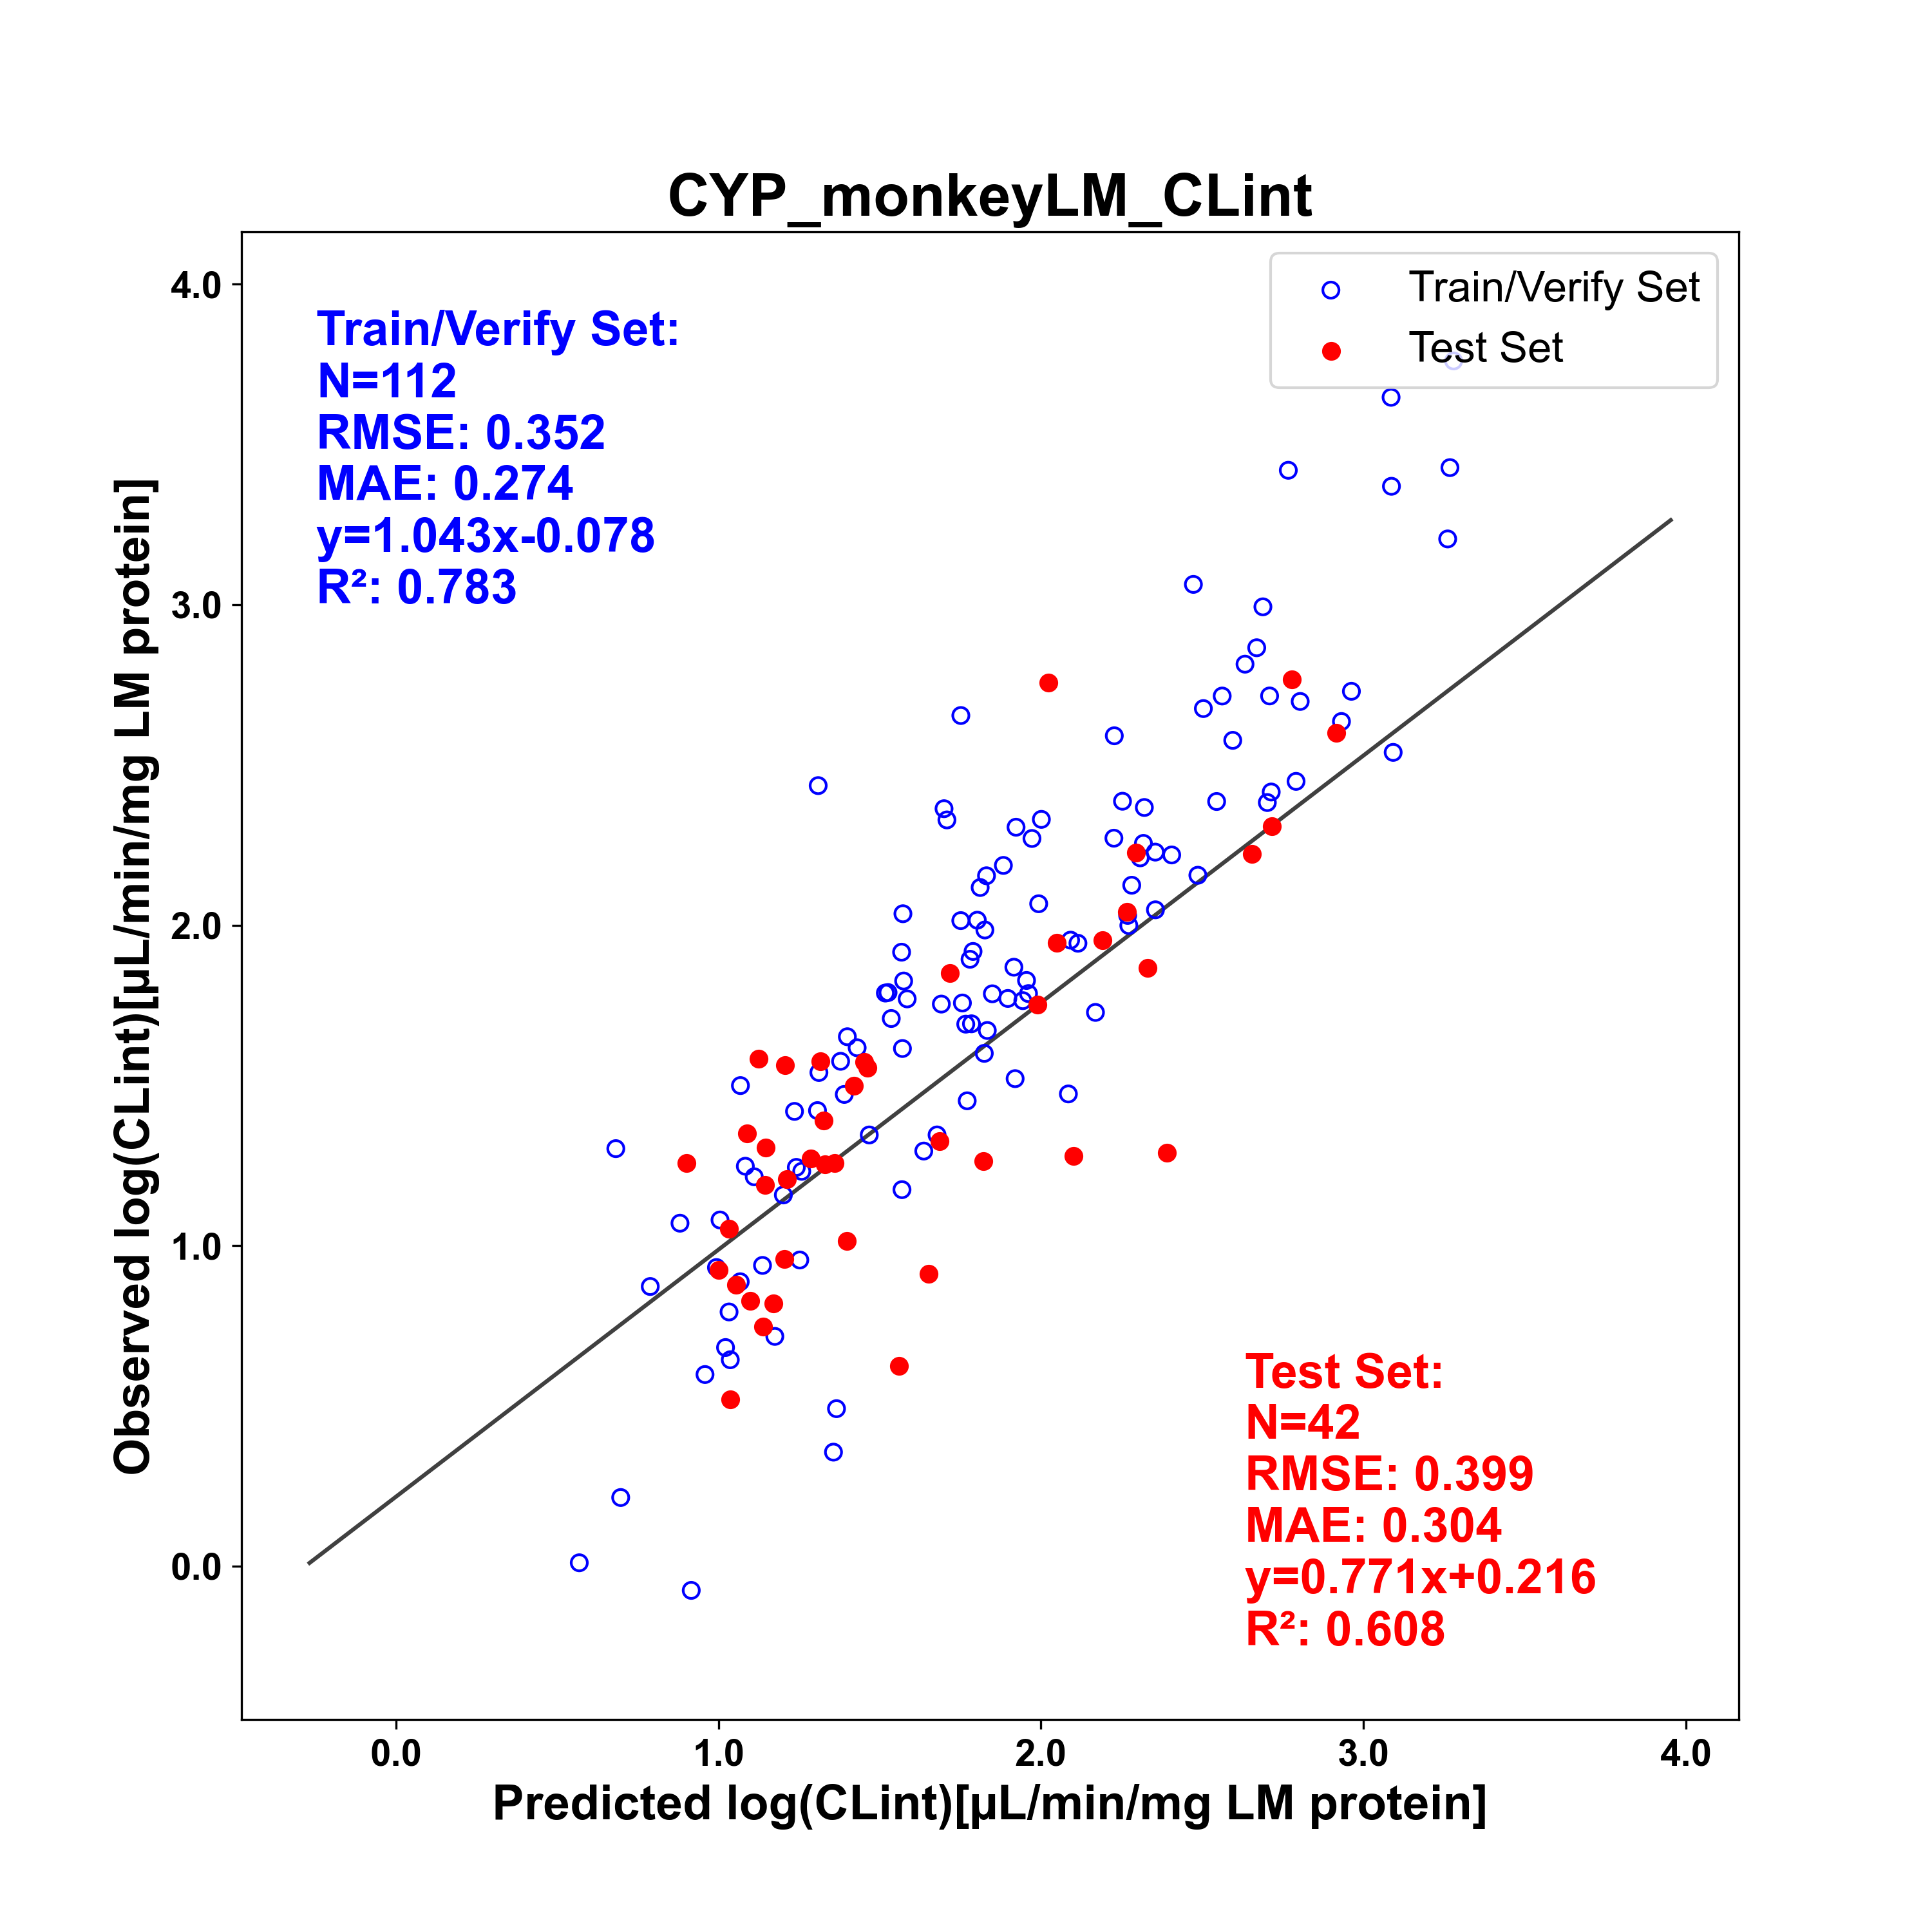
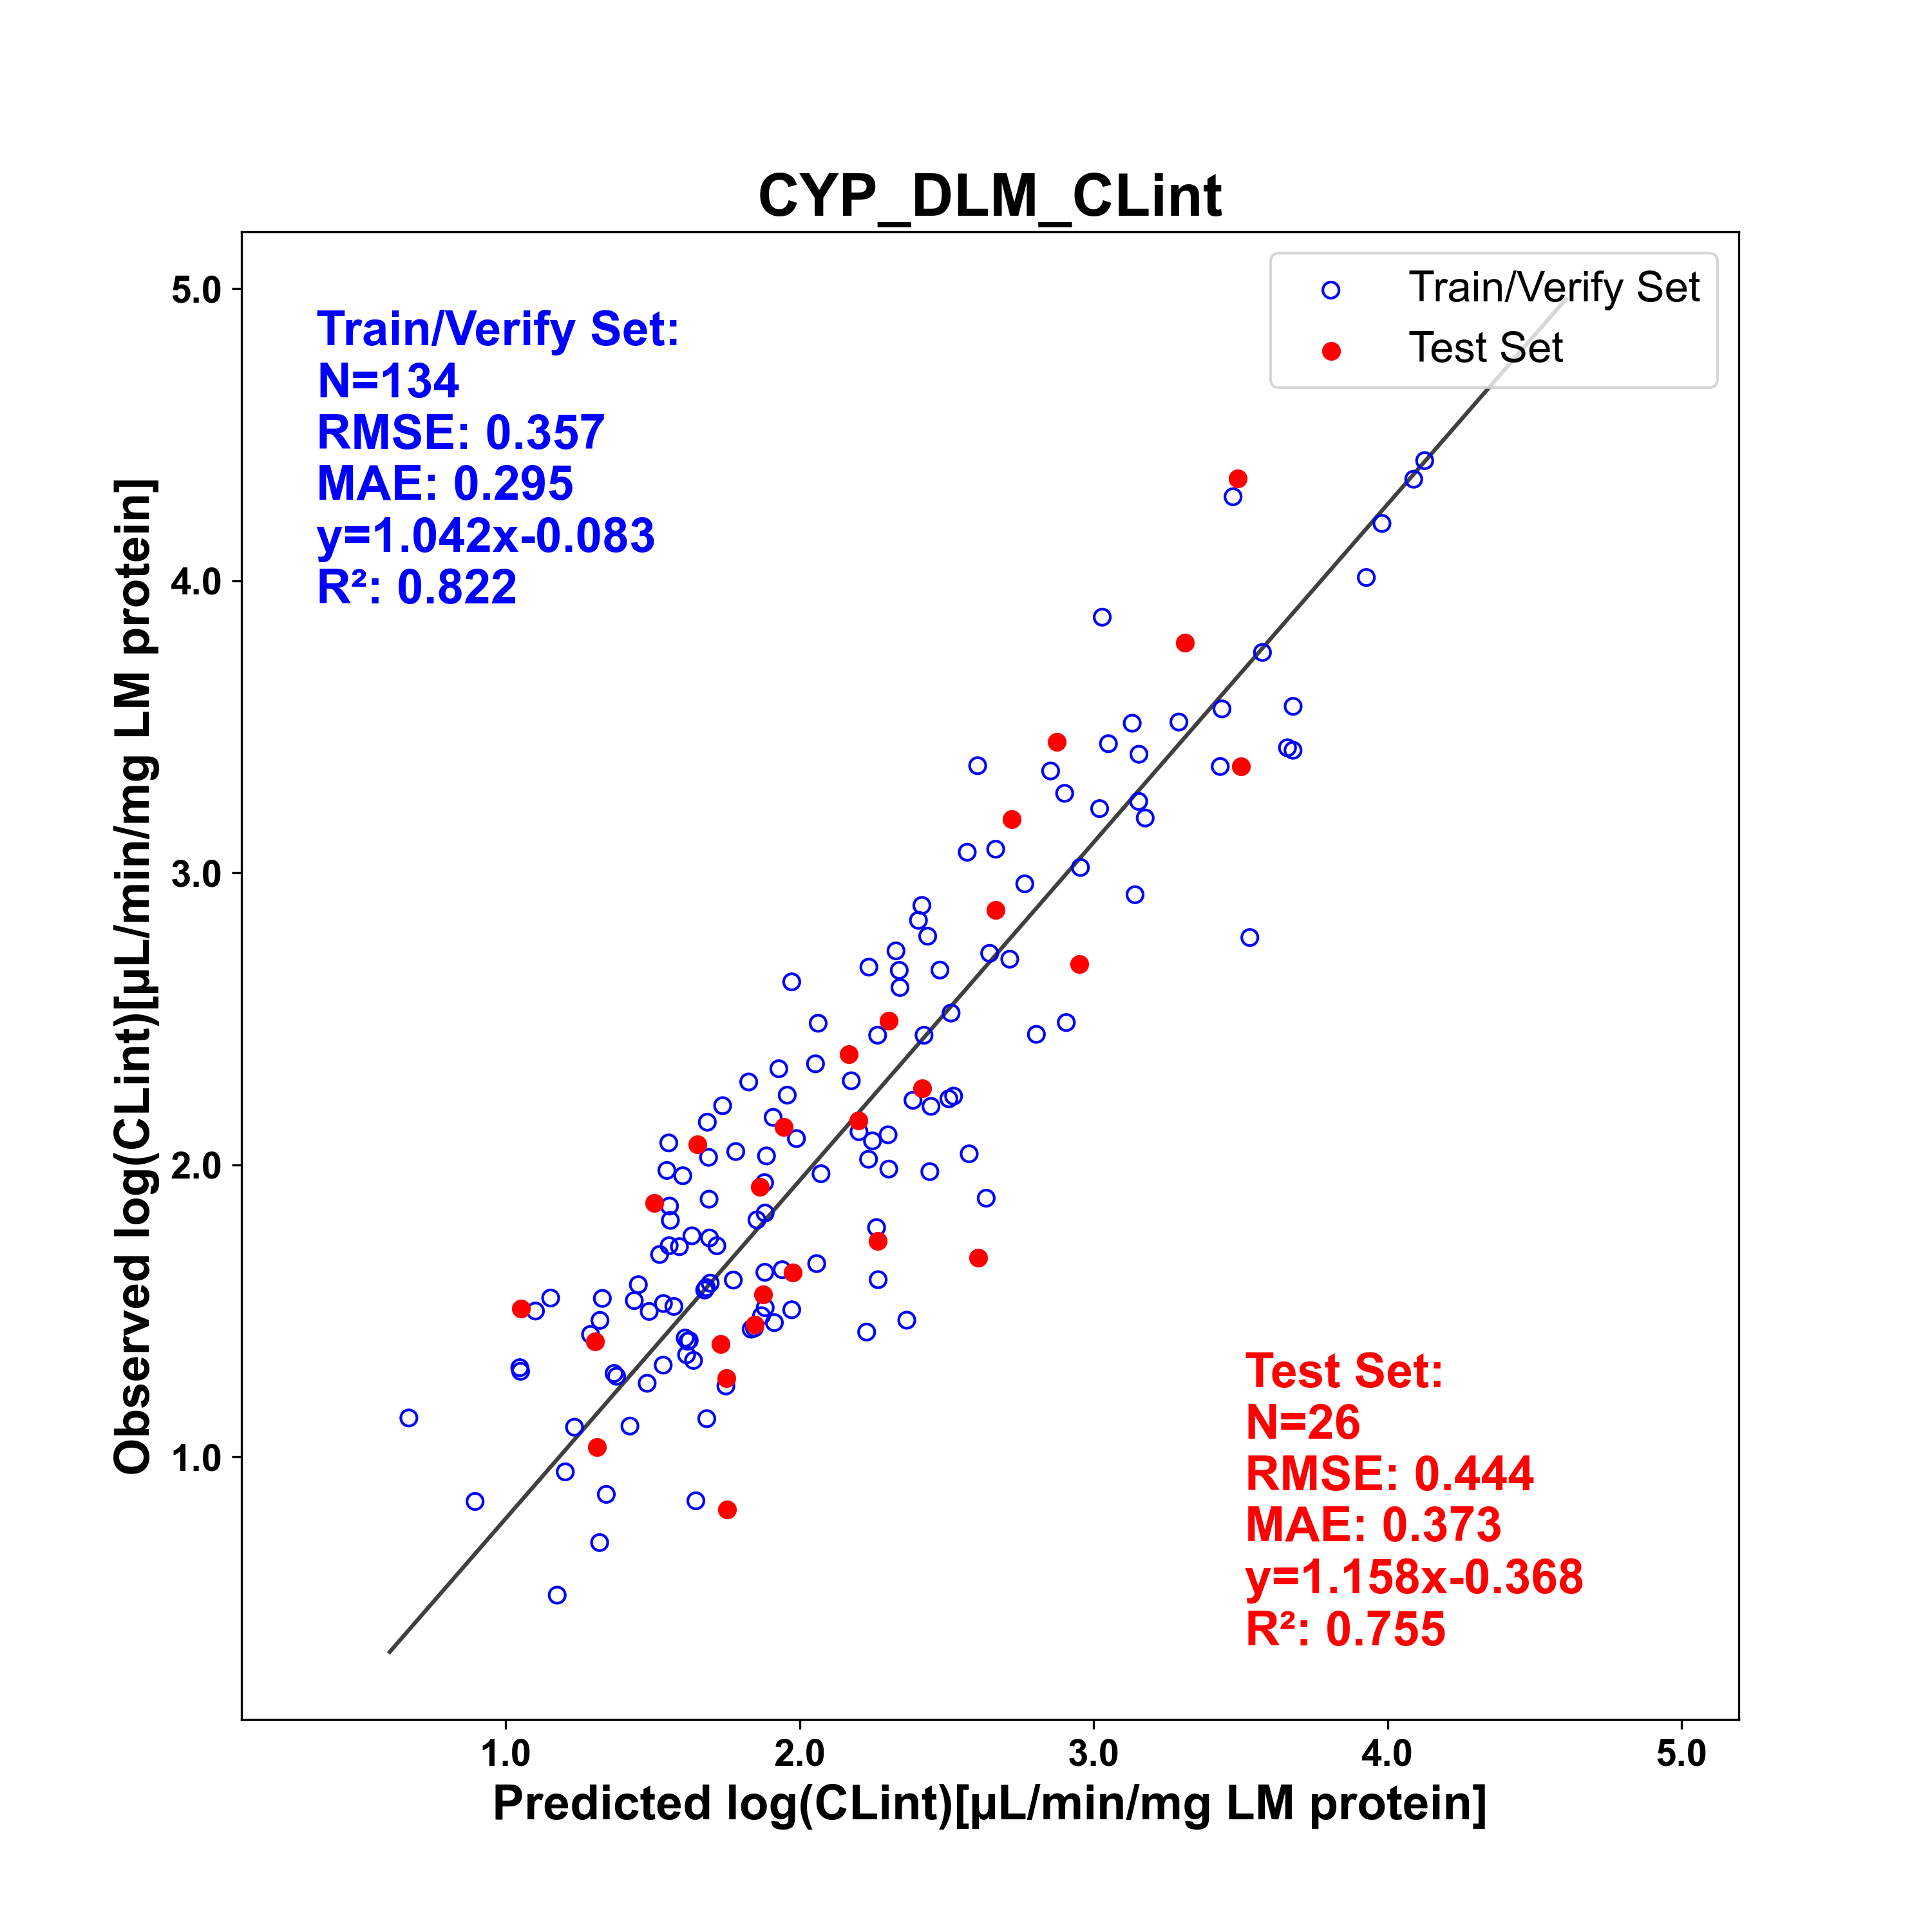
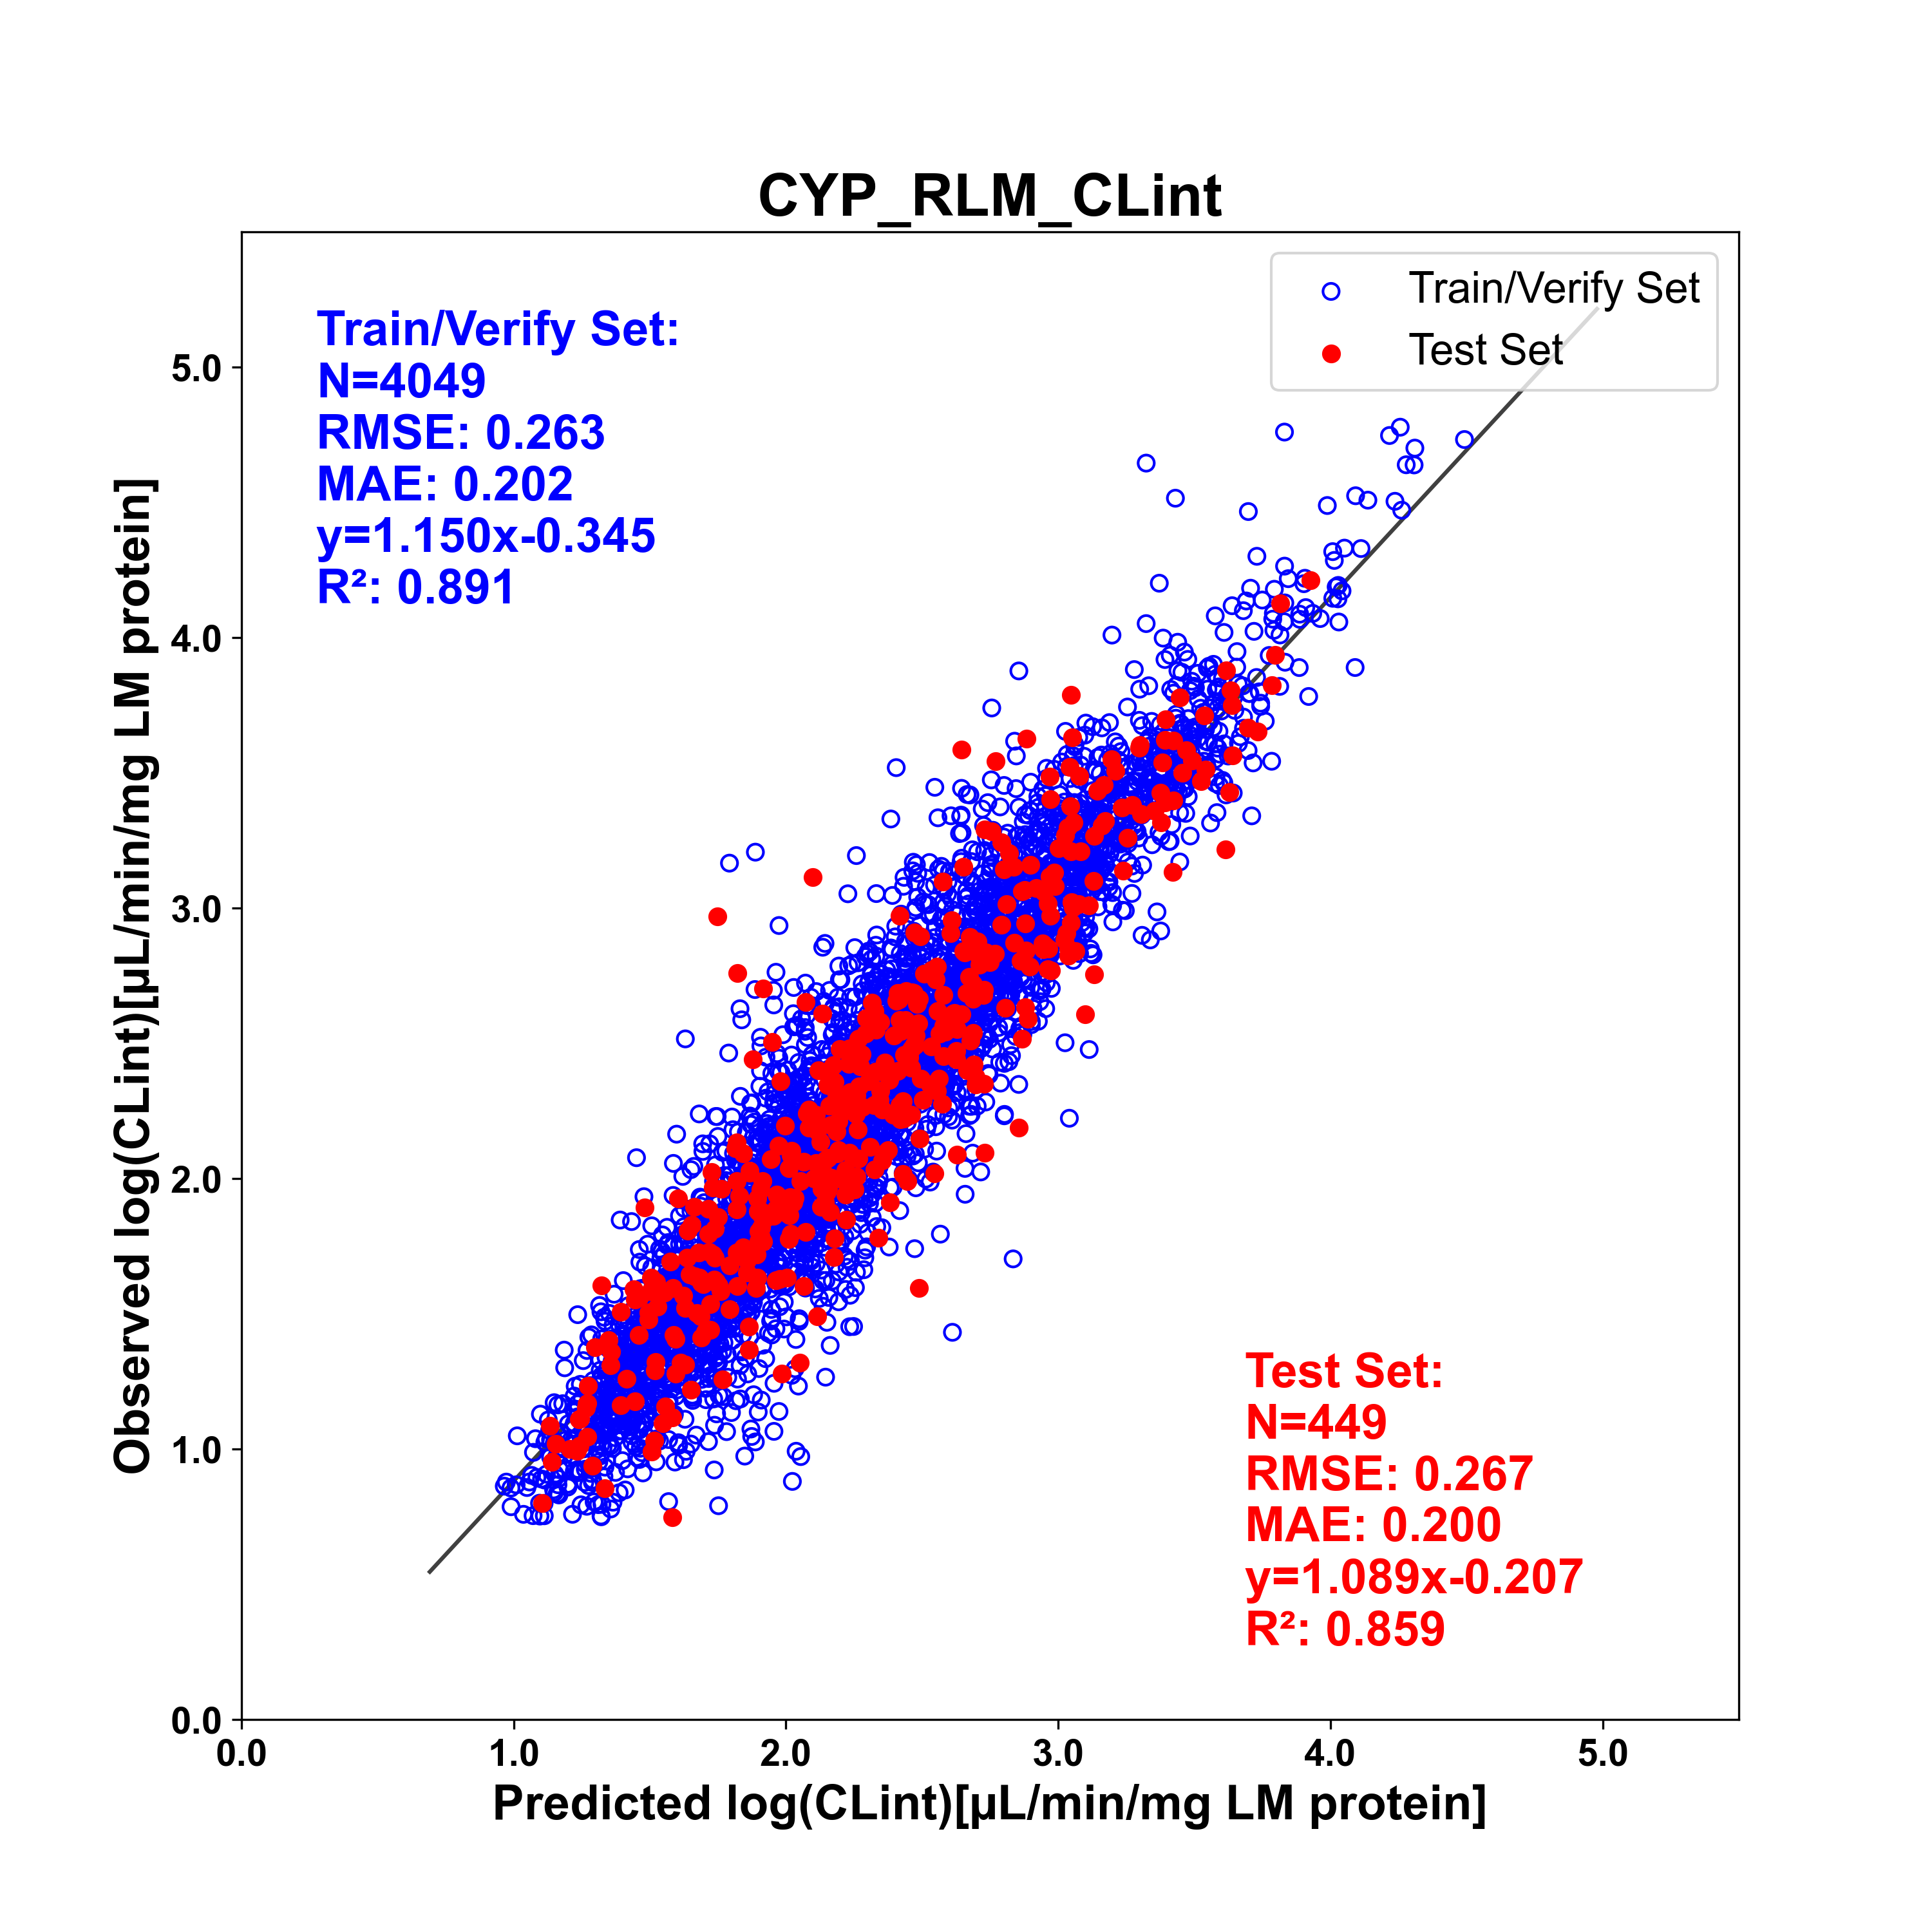
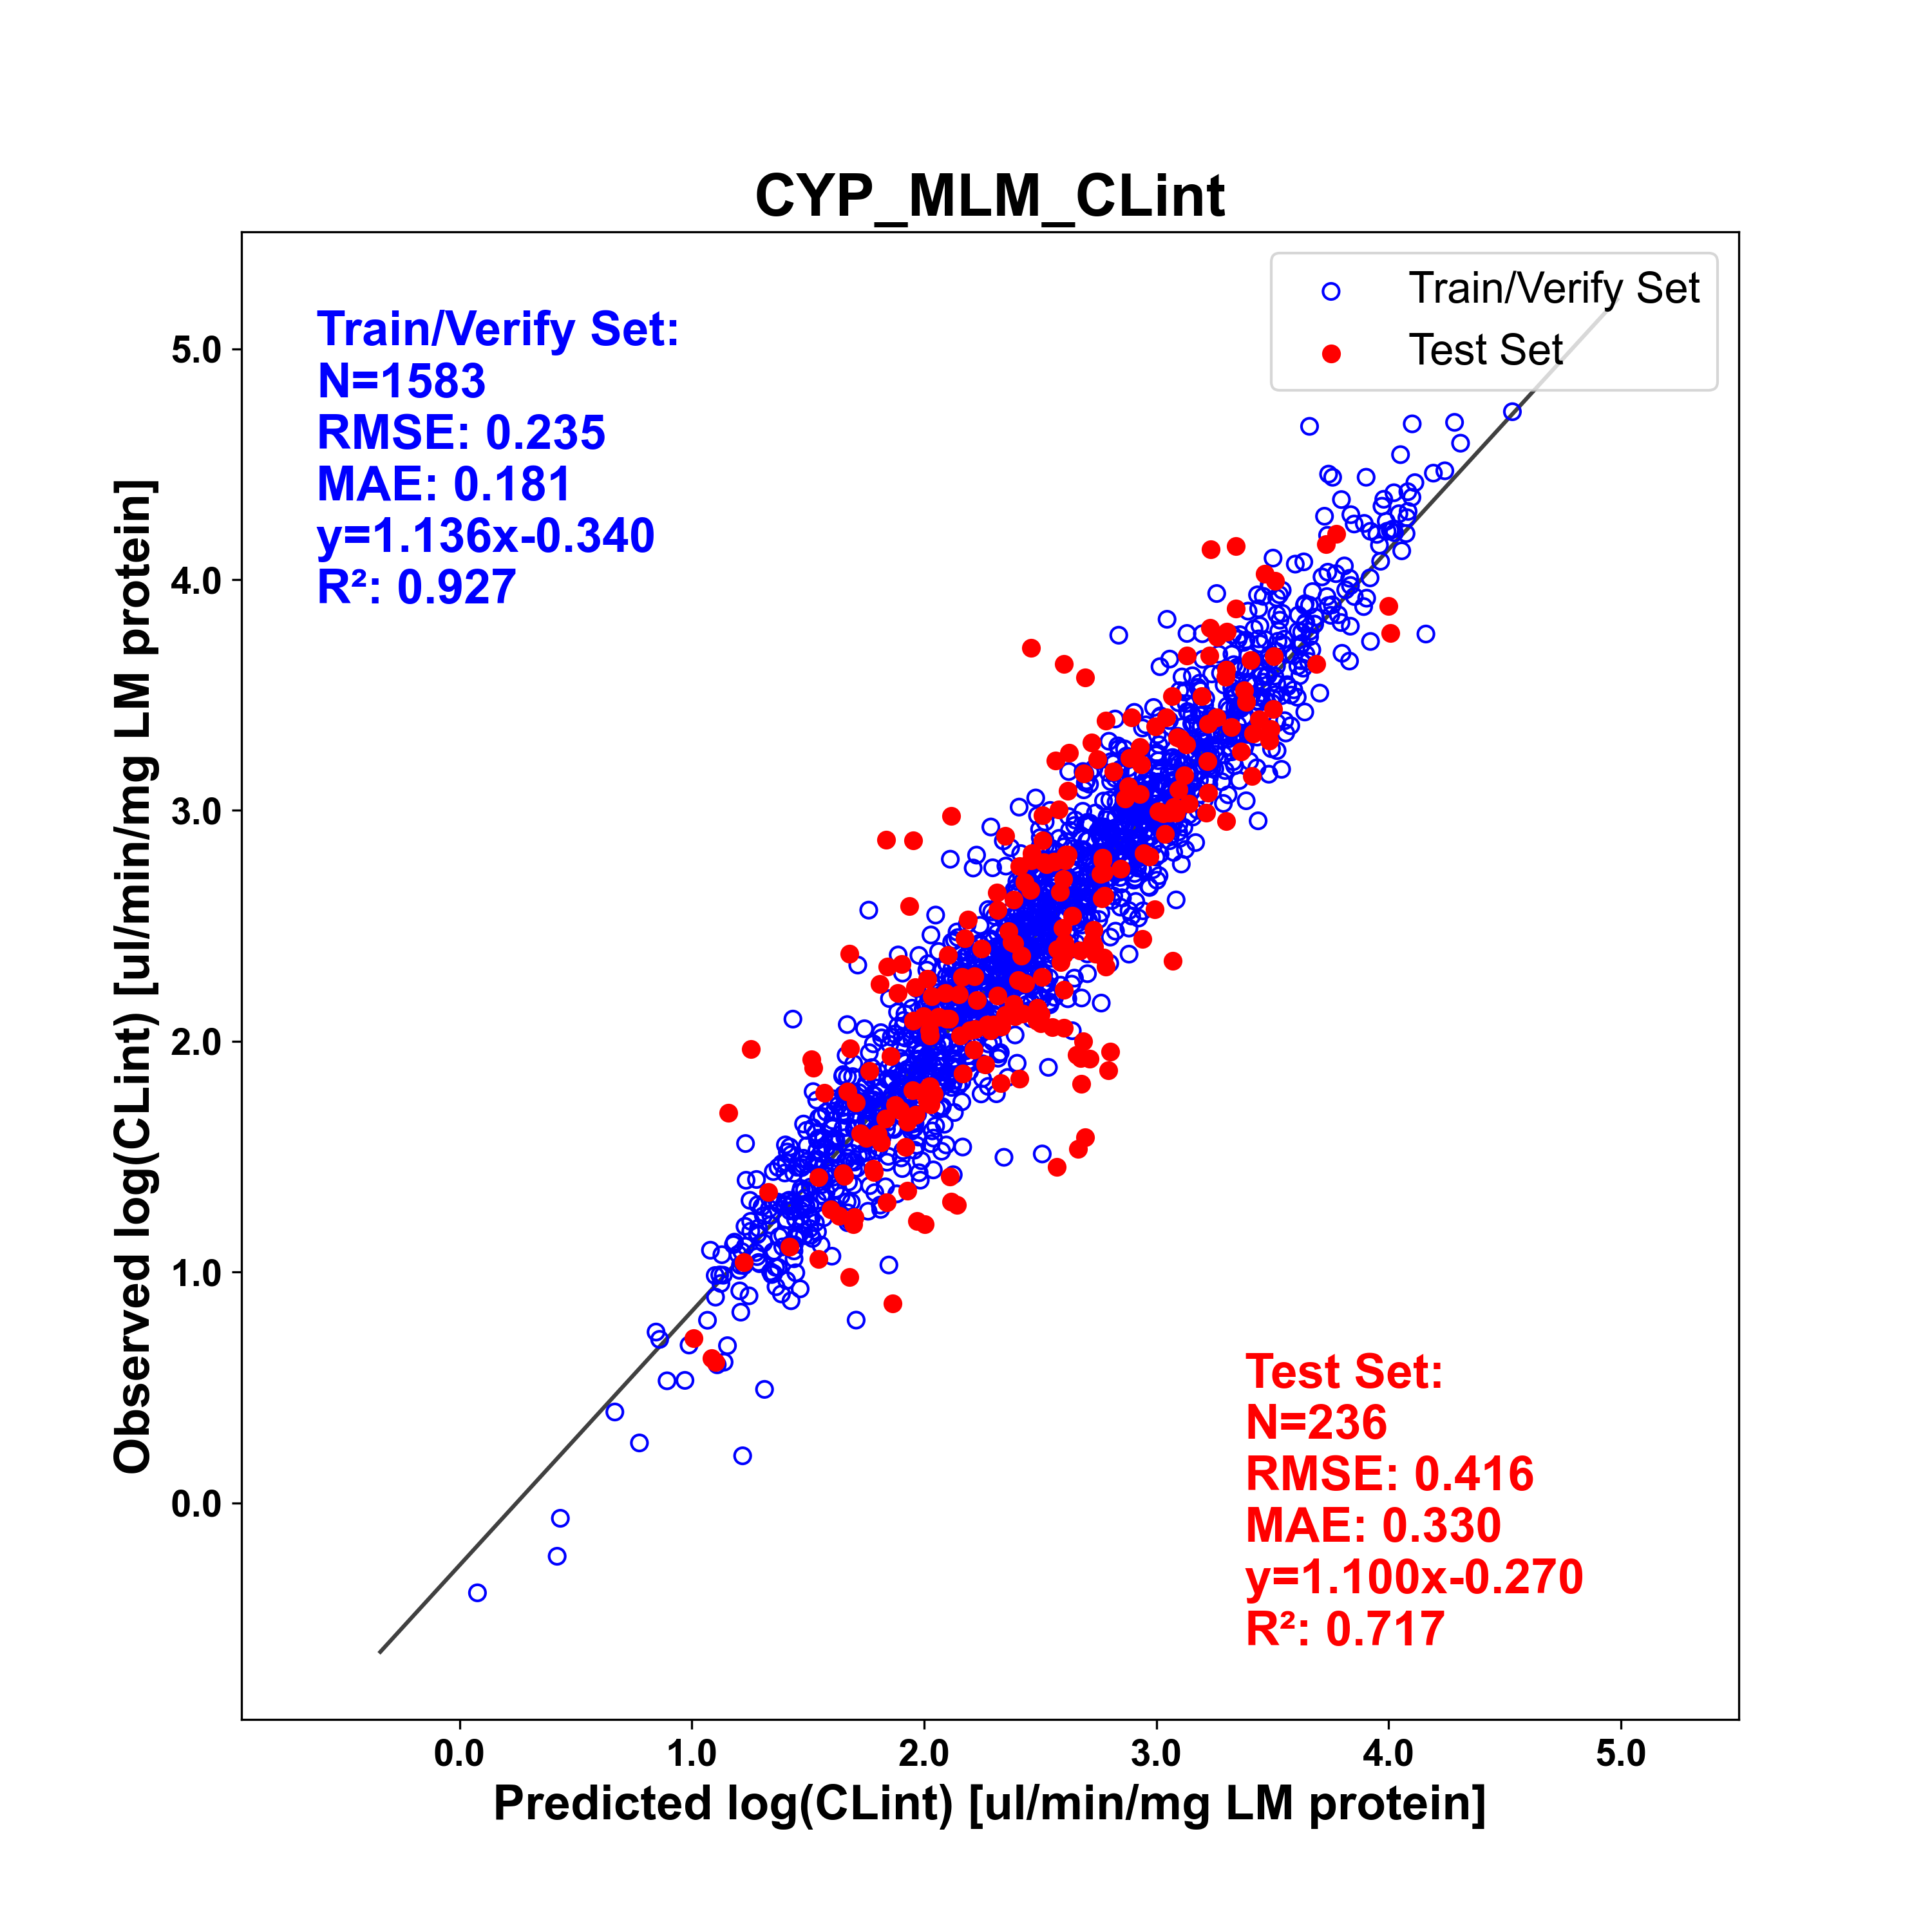
The Liver Microsomal CLint models were built using the unbound intrinsic clearance. Minimum ten percent of each data set was put aside as an external test set before building ANNE or XGBoost regression models. The models were built in the log space, but the final predictions shown on the spreadsheet are transformed back to the linear space, thus the predictions are reported in units of μL/min/mg of microsomal protein. The human model contains 4620 total compounds, of which 701 broke at least one Ro5, including 5 PROTACs, 37 macrocycles and 34 cyclic peptides. The monkey model contains 160 total compounds, of which 46 broke at least one Ro5, including 4 macrocycles and 3 PROTACs. The dog model contains 161 total compounds, of which 44 broke at least one Ro5, including 3 macrocycles and 4 PROTACs. The rat model contains 4398 total compounds, of which 504 broke at least one Ro5, including 4 PROTACs, 13 macrocycles and 4 cyclic peptides. The mouse model contains 1819 total compounds, 424 of which broke at least one Ro5, including 10 PROTACs, 38 macrocycles and 24 cyclic peptides. The number of compounds used for training and test sets, as well as quality metrics are shown in the figure below.
AstraZeneca has deposited rat and human hepatocyte clearance data in ChEMBL. Along with this data, we collected data from the open literature as well as various public and commercial databases. Researchers at the US-Environmental Protection Agency and National Institute of Environmental Health Sciences have also made human and rat pharmacokinetic and toxicokinetic data available in the literature in association with an R package called "httk" (Pearce et al 2017), from which human hepatocyte clearance data was extracted.
After making necessary corrections of the chemical structures and clearance values, the reported clearances were converted into unbound hepatocyte clearance with the help of S+fuhep model. Unbound hepatocyte clearance was calculated as a ratio of total hepatocyte clearance and fuhep.
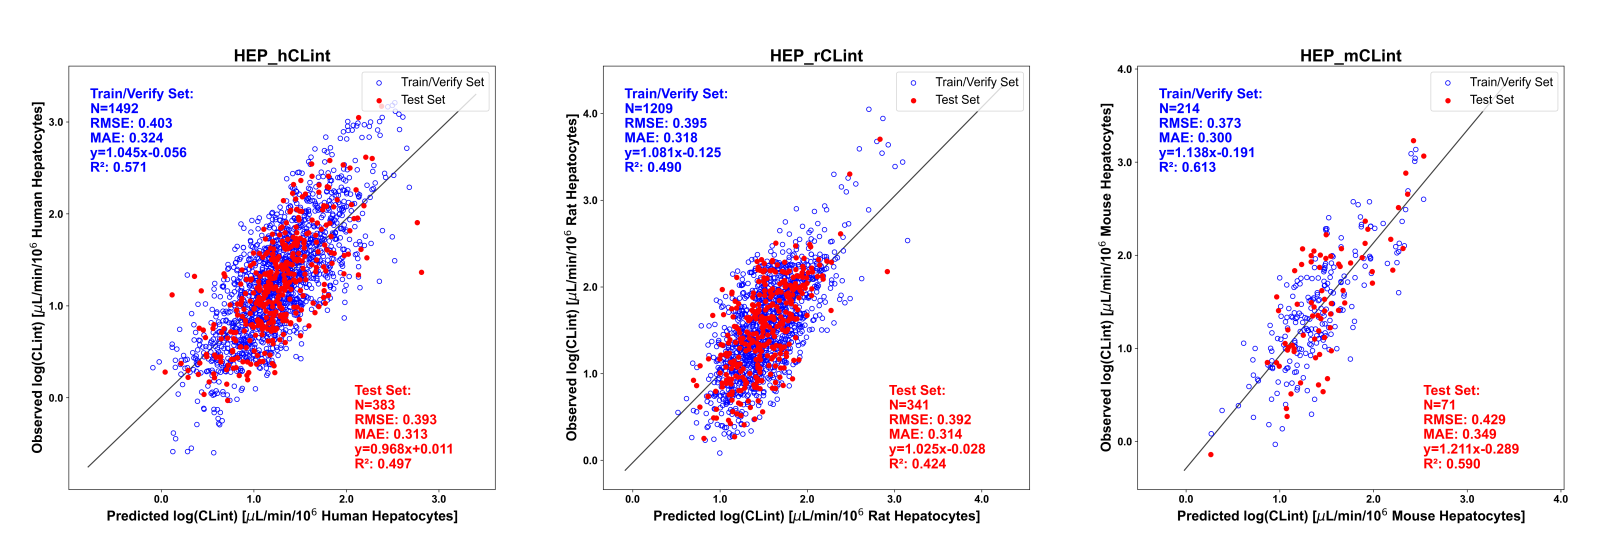
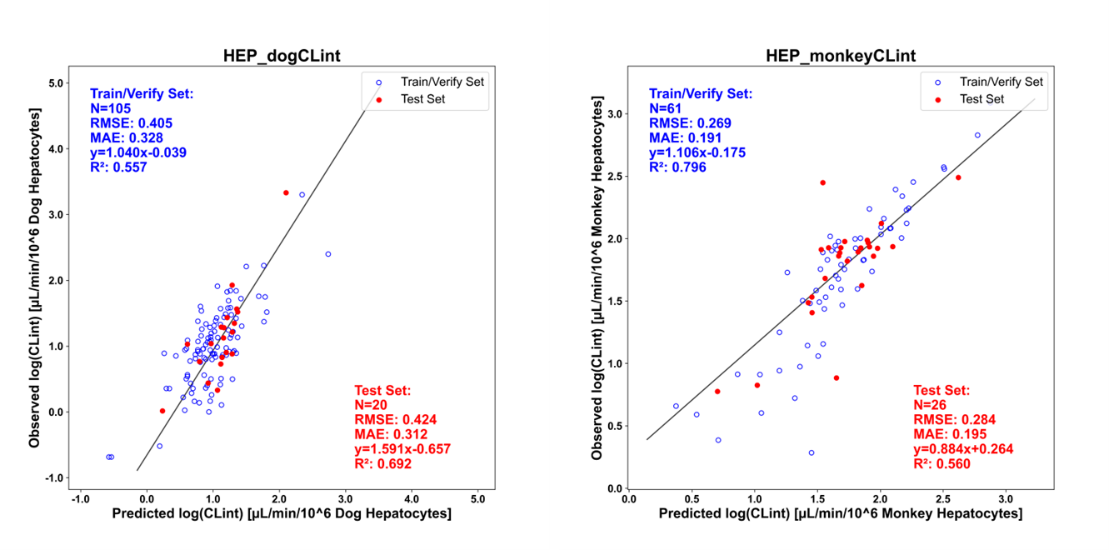
As was the case for liver microsomal clearance, the hepatocyte CLint models were built using the unbound intrinsic clearance. The Kohonen approach was applied to select the 10% of molecules considered as an external test set which was held out prior to building the ANNE regression model. The model was built in the log space, but the final predictions presented in the spreadsheet are converted back to the linear space, thus the predictions are reported in units of μL/min/106 cells. The number of compounds used for training and test sets, as well as quality metrics expressed in terms of log units are shown in the figures below.