

Oxidation reactions carried out by cytochrome P450 isoforms (CYPs) and aldehyde oxidase (AOX) are responsible for the majority of Phase I drug metabolites (Montefiori 2017; Williams 2004; Wienkers 2005; Guengerich 2008). Knowledge of the specific metabolites resulting from these transformations is often important in understanding bioavailability, toxicity (e.g., from drug-drug interactions), efficacy, and clearance along with many other key aspects of xenobiotic pharmacokinetics.
The kind of biologically active molecules that ADMET Predictor deals with can interact with oxidative enzymes in several physiologically relevant ways. They may themselves be susceptible to oxidative metabolism, for example, and we provide substrate classification models for CYPs 1A2, 2A6, 2B6, 2C8, 2C9, 2C19, 2D6, 2E1, and 3A4 and AOX (e.g., AOX_Substr). These are complemented by atomic site of metabolism (SOM) models (e.g., CYP2B6_Sites) that predict where compounds are likely to be attacked if they are substrates for AOX or for one of those CYPs. Between them, the nine CYP isoforms account for ~90-95% of all CYP-mediated oxidations (Williams 2004; Wienkers 2005; Guengerich 2008).
If a compound is a CYP substrate, good estimates of its kinetic characteristics - i.e., maximal reaction rate (Vmax), Michaelis constant (Km) and first-order reaction rate at low concentrations (CLint) - are crucial to doing accurate pharmacokinetic simulations in tools like GastroPlus®. To support such applications, we provide site-specific (atomic) kinetic parameter estimates for five of these CYPs - 1A2, 2C9, 2C19, 2D6, and 3A4 - that were constructed using data from recombinant (rCYP) assays (e.g., CYP2D6_Km, CYP2D6_Vmax and CYP2D6_CLint); the corresponding molecular kinetic parameters are presented in the spreadsheet. Human liver microsomal (HLM) data were used to build separate molecular kinetics models for CYP3A4 assayed in HLMs (CYP3A4_HLM_Km, CYP3A4_HLM_Vmax and CYP3A4_HLM_CLint) as well as a model for total CYP microsomal clearance (CYP_HLM_Clint).
Inhibitor classification models (e.g., CYP2C19_Inh) are available for nine recombinants of CYPs, i.e.: 1A2, 2A6, 2B6, 2C8, 2C9, 2C19, 2D6, 2E1, and 3A4. The four CYPs for which kinetic predictions are not provided reflect an absence of high-quality data for those isoforms rather than any lack of interest on the part of Simulations Plus.
The various CYP models are built independently but their predictions are usually best considered in combination. A prediction by CYP2C9_Substr that a compound is a substrate for CYP2C9, for example, is likely to be of limited interest if the intrinsic clearance predicted by CYP2C9_CLint is very low. This is especially so if the compound is cleared rapidly by other CYPs.
Conversely, a high CLint prediction from CYP2C9_CLint is unlikely to be relevant if it CYP2C9_Substr does not classify the compound in question as a "Substrate." In fact, kinetic parameters for any compound that is predicted to not be a substrate for a given CYP are suppressed by default. You will see no atomic annotations in the Metabolism tab of the Atomic Properties Display and you will see "NonSubstrate" entries in the spreadsheet for the molecular parameters. This is done because the training sets from which clearance rates are calculated necessarily consist only of substrates - i.e., anything which is not a substrate is implicitly out of scope for the model.
The range and depth of experimental data required to construct inhibitor classification and kinetic models for AOX is not yet available.
This introductory section includes a description of how CYP and AOX predictions are presented in the Atomic Properties Display and in the ADMET Predictor spreadsheet. Metabolite maps generated in MedChem Designer are covered separately. The Atom Properties Display provides access to results from each model for individual atoms, whereas the spreadsheet integrates data for each CYP across different sites. Metabolite maps, in contrast, integrate data for each site across CYP isoforms and AOX. Results are presented in terms of the metabolites produced and their projected relative yield.
Predictions from the AOX substrate classification and site models are displayed alongside CYP predictions in the Atomic Properties Display, in the spreadsheet and in metabolite maps.
The overview closes with some technical details and general considerations.
Atomic Properties Display
When the Atomic Properties Display is launched by double clicking on a CYPxxx_Sites cell in the spreadsheet, the Metabolism tab is activated and each atom that could conceivably be subject to attack is annotated with a propensity score from the corresponding model (e.g., CYP3A4_Sites). The figure below shows predicted sites of CYP3A4 and CYP2B6 metabolism and the corresponding propensity scores for CHEMBL2070733, a compound from our CYP_HLM_CLint data set. The display initially came up with the CYP3A4_Sites of metabolism entry in the Property list selected (1), and the display for CYP2B6 was added by clicking on the CYP3A4_Sites of metabolism option entry (2) while holding down the Ctrl key.
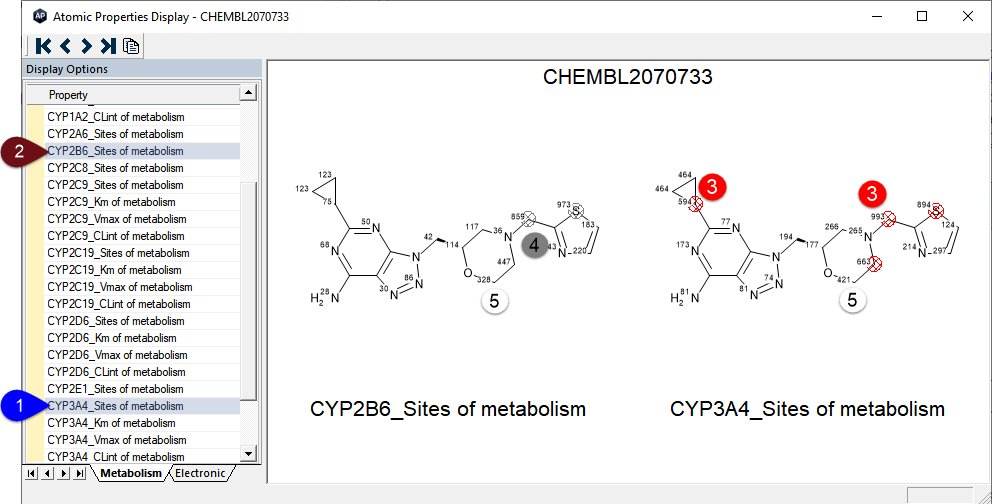
Atoms for which the propensity score exceeds a characteristic reactivity threshold for the CYP in question are highlighted by hatched circles. The circles are red (3) if the molecule as a whole is predicted to be a substrate for that CYP whereas it is gray (4) if it is not. An unhighlighted propensity score is shown for potential sites that are predicted to not be metabolized regardless of the corresponding CYPxxx_Substr prediction (e.g., (5)).
Our substrate classification models are good but they are not perfect, and the feedback provided by the gray highlighting can be useful if a simple disappearance of substrate assay suggests that our "NonSubstrate" is incorrect. This is reflects the contingent nature of the CYP Sites predictions: the models indicate where a molecule is likely to be oxidized if it is a substrate.
An item for AOX_Sites appears at the bottom of the Metabolism list. Selecting the All_CYP_CLints option near the top of the list will display the sum of all CYPxxx_CLint predictions for each atom.
Spreadsheet Display
Once ADMET Properties have been calculated, molecular CYP metabolism predictions are displayed in the spreadsheet when either the All or Metabolism attribute group is selected. The tabulated properties are grouped by CYP. For the five major CYPs, inhibitor and substrate classifications come first, followed by site of metabolism list, Km, Vmax and CLint predictions. Only substrate classification and site-of-metabolism lists are shown for the less well-characterized isoforms like CYPs 2B6 and 2C8. Confidence estimates are indicated in parentheses, and range from high (1) to very marginal (2) levels. No confidence estimate is provided for out-of-scope predictions, which are highlighted in red and underlined (3). Wedges in star plots that represent out-of-scope predictions are hatched to indicate that fact.

Results for some other compounds from the CYP_HLM_CLint data set are shown below for illustrative purposes. One from AstraZeneca (CHEMBL2022127) eventually became clinical candidate AZD7325. The other three compounds shown come from a series of PDE8B inhibitors developed by Pfizer (DeNinno 2012). The intrinsic clearance for the analog that eventually went into preclinical testing ("DeNinno Cpd 42"; highlighted) was only reported as being "<8 μL/min/mg HLM protein," so it was not itself included in the CYP_HLM_CLint model building process.
The *CYP Substr* star plots show the CYPs which are predicted to oxidize each compound, whereas the *CYP CLint* star plot displays the log of the predicted recombinant CYP CLint (CYPxxx_CLint) predictions. The sixth *CYP CLint* (cyan) sector represents overall microsomal predictions (CYP_HLM_CLint); we do not currently have a general substrate classification model that covers all of the CYP isoforms in HLMs.
For illustrative purposes, VIEW >> Arrange Columns... has been used to modify the default order in which columns appear. Hovering over a plot sector pops up a tool tip that identifies the model it corresponds to, along with the value for the particular compound and the range between the inner and outermost circle (1). Though they in fact pop up one at a time, the image has been edited graphically to show multiple tooltips simultaneously. Annotations have been added to make the point that the wedge colors for *CYP Substr* and *CYP CLint* are coordinated by default for the first five sectors: the red wedges, for example, represent CYP3A4 predictions in both star plots.
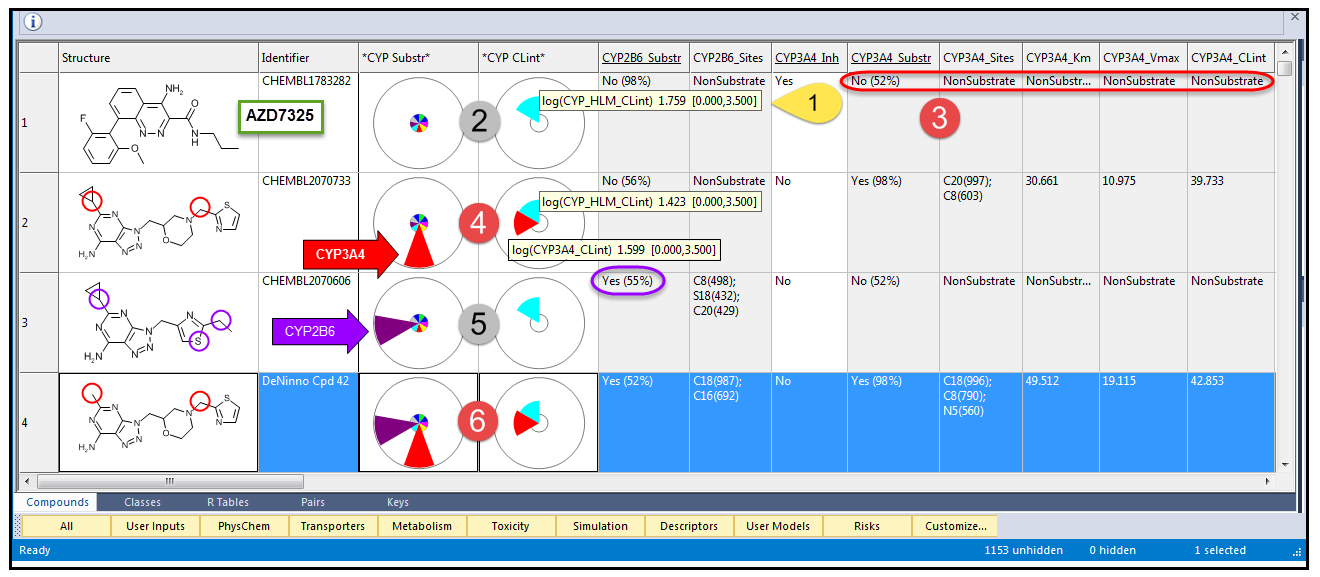
The predicted and observed CLint values for CHEMBL1783282 (AZD7325; 2) were 57 and 46 μL/min/mg HLM protein, respectively, yet the *CYP Substr* plot indicates that it is predicted to not be a substrate for any of the major CYPs. Hence no CLint predictions were made for them, as is indicated by the absence of wedges within the innermost circle of the *CYP CLint* star plot (2); the inner circle in star plot is there to make it possible to distinguish minimal in- and out-of-scope predictions from each other and from predictions that are not made at all. Spreadsheet entries corresponding to site of metabolism and kinetic parameters are "Nonsubstrate" rather than numerical values (3): all compounds used to build those models were substrates, so any prediction for a nonsubstrate is inherently unreliable.
No CYP is identified in the literature as being responsible for the observed in vitro metabolism of AZD7325, which suggests that it is probably either a good substrate for some minor isoform or a very weak substrate for several isoforms. An examination of the CYPxxx_Sites predictions using the Atomic Properties Display (see above) suggests that the latter is more likely to be the case.
CHEMBL2070733 is predicted to be somewhat less rapidly metabolized (4), but in this case the isoform represented by the red wedges in the *CYP Substr* and *CYP CLint* star plots - CYP3A4 - is predicted to be responsible. The main predicted sites of metabolism have been circled in red. As was the case for AZD7325, the only wedge visible in the *CYP CLint* star plot for CHEMBL2070606 (5) is the one that represents overall metabolism: CYP_HLM_CLint. In this case, however, a particular enzyme - CYP2B6 - is identified as the likely culprit. Here the predicted SOMs are circled in purple.
"DeNinno Cpd 42" (6) was the analog taken forward into preclinical testing. It is predicted to be metabolized by both CYP3A4 and CYP26, but mostly by the former. The CYP_HLM_CLint prediction of 20 μL/min/mg HLM protein is within the expected predictive error (SE 0.36 logs or 2.3-fold) of the the marginal CLint observed (<8 μL/min/mg HLM protein; DeNinno 2012). The overall HLM prediction is, on the other hand, less than the CYP3A4_CLint prediction of 43 μL/min/mg HLM protein. Bear in mind, however, that the RMSE is greater - 0.56 log units or 3.6-fold - for the latter model, which is based on data from recombinant CYP assays scaled to reflect isoform abundance in human liver microsomes. Such models often yield values different from those seen in direct HLM assays.
Technical Details and Considerations
The data used to construct those models is for recombinant enzymes expressed in microsomes, with preference given to data obtained using Supersomes™ derived from a transfected insect cell line (Sai 2000).
The Metabolism Module contains kinetics models for the five most critical recombinant human CYPs: 1A2, 2C9, 2C19, 2D6, 3A4. It also provides kinetic parameter estimates for CYP3A4 oxidation in human liver microsomes (HLM). The Km and CLint models for the latter take microsomal binding into account by scaling the apparent value by the expected fraction unbound in HLM (fumic) as estimated by our S+fumic model.
The S+fumic model assumes a standard microsomal concentration of 1 mg protein/mL. HLM stability assays are usually carried out at 0.5 mg protein/mL, however, so the CYP3A4_HLM_Km and CYP3A4_HLM_CLint predictions are adjusted for the reduced binding expected at the lower microsomal concentration.
The CYP kinetic models are Artificial Neural Network Ensembles (ANNE) built using molecular and atomic descriptors representing charge and reactivity as well as steric and local environmental effects. The molecular Vmax and CLint can be obtained by simple addition of the atomic values, and their ratio yields an effective molecular Km.
Unfortunately, CYP oxidation often deviates from simple Michaelis-Menten kinetics; autoinhibition and autoactivation are common (Houston & Kenworthy 2000). Besides being subject to metabolism themselves, molecules may inhibit metabolism of other active compounds, which sometimes leads to severe drug-drug interactions. Being able to anticipate such interactions and avoid them by molecular modification is an extremely useful capability.