

CYP Sites of Metabolism
ADMET Predictor includes site of metabolism (SOM) models for nine CYP isoforms - 1A2, 2A6, 2B6, 2C8, 2C9, 2C19, 2D6, 2E1 and 3A4 - in the Metabolism Module.
In building the CYPxxx_Sites models, we gathered metabolism data from various databases such as DIDB (hosted by the University of Washington), and GOSTAR. The FDA application review files were scanned for all the recently approved small molecule drugs. We extracted the metabolite data (along with corresponding responsible CYP isoforms) for newly approved drugs in last five years (2015-2020).
Other data sources include published data sets of sites of metabolism and general review articles (e.g., Zaretzki; 2012, Sheridan; 2007, Rendic; 2002). The Zaretzki data set has been used successfully used by various research groups to build Sites of Metabolism models. (Finkelmann; 2019, Mukherjee; 2015, Djoumbou-Feunang; 2019) However careful analysis reveled that the Zaretzki data set needed further correction.
The final data set is composed of 1440 unique compounds. The entire data underwent substantial curation based on information contained in original literature citations as well as additional references found in the course of this work. These curation updates included corrections to reactant and product structures, CYP assignments, and often additional sites identified in more recent publications. Some site assignments were removed when further literature investigations revealed the particular reaction in question was mediated by a different CYP or even a non-CYP enzyme.
This section begins a presentation of summary performance statistics for the CYP SOM models, then goes into technical details of model scope and what a CYP site score means. It closes with a discussion of a case where a CYP1A2_Sites model was able to identify some metabolic sites even before they had been reported in the literature.
Performance statistics
The table below summarizes the performance of our CYPxxx_Sites models using several statistics: concordance ("Concord."), sensitivity, and specificity. The performance statistics are compiled for the sets of atoms that were candidate sites ("Included Atoms"). "Excluded Atoms" that were not candidate sites by virtue of chemistry rules (e.g., carbons without hydrogen) were excluded from the ANNE model building process. Including these atoms in the statistics would artificially increase the number of true negatives (all Excluded Atoms are 100% correctly classified as negatives by default) and would further improve the performance statistics for concordance and specificity. The sensitivity value would remain unchanged as it does not depend on the number of true negatives.
|
CYP |
Set |
Excluded Atoms |
Included Atoms |
Negatives |
Positives |
Concord |
Sensitivity |
Specificity |
|---|---|---|---|---|---|---|---|---|
|
1A2 |
Training |
3204 |
4277 |
3639 |
646 |
86.2% |
89.4% |
85.7% |
|
Test |
565 |
758 |
638 |
112 |
86.0% |
83.9% |
86.3% |
|
|
2A6 |
Training |
652 |
1025 |
855 |
170 |
88.3% |
90.5% |
87.9% |
|
Test |
104 |
177 |
144 |
33 |
91.5% |
84.8% |
93.0% |
|
|
2B6 |
Training |
1239 |
2050 |
1781 |
269 |
87.6% |
91.4% |
87.0% |
|
Test |
205 |
347 |
283 |
64 |
89.9% |
89.0% |
90.1% |
|
|
2C8 |
Training |
1902 |
2726 |
2415 |
311 |
86.5% |
92.6% |
85.7% |
|
Test |
260 |
416 |
361 |
55 |
89.1% |
87.2% |
89.4% |
|
|
2C9 |
Training |
2695 |
3885 |
3427 |
458 |
86.4% |
90.3% |
85.9% |
|
Test |
530 |
738 |
642 |
96 |
84.8% |
86.4% |
84.5% |
|
|
2C19 |
Training |
2555 |
3864 |
3386 |
478 |
87.2% |
89.3% |
86.9% |
|
Test |
398 |
643 |
570 |
73 |
89.2% |
93.1% |
88.7% |
|
|
2D6 |
Training |
3060 |
5555 |
4942 |
613 |
89.0% |
91.5% |
88.7% |
|
Test |
533 |
970 |
860 |
110 |
89.8% |
88.1% |
90.1% |
|
|
2E1 |
Training |
923 |
1296 |
1035 |
261 |
86.9% |
91.1% |
85.8% |
|
Test |
130 |
205 |
158 |
47 |
85.8% |
91.4% |
84.1% |
|
|
3A4 |
Training |
9024 |
13879 |
12385 |
1494 |
85.7% |
88.2% |
85.4% |
|
Test |
1509 |
2393 |
2138 |
255 |
85.8% |
88.6% |
85.5% |
The issue of false positives merits additional discussion. The ratio of observed negatives to positives in the various data sets ranges from ~4:1 to 8:1 across the nine data sets. This large imbalance of negatives to positives poses challenges for modeling methods to maintain a low number of false positives. For example, consider a data set consisting of 1,000 negatives and 200 positives (5:1 ratio). An accuracy rate of 90% for both positives and negatives would result in 180 true positives and 100 false positives. The CYP3A4 data set has observed negatives to positives ratio of 8:1. An example data set corresponding to this ratio would consist of 1,600 negatives and 200 positives, with an accuracy of 90% yielding 160 false positives and 180 true positives. So, imbalanced data sets with high values of concordance, sensitivity, and specificity can still result in model predictions in which the number of false positives is approximately equal to the number of true positives.
An alternative metric for SOM prediction performance frequently presented in the literature is to tabulate the percentage of molecules possessing an experimentally confirmed site of metabolism among one of its top N scoring atoms, according to the model. For example, if N=2, then a prediction is counted as "correct" if one of the top 2 scoring atoms in the corresponding molecule is a metabolic site. We present the performance statistics for our site models here using this metric for values of N=1, 2, or 3 for comparison to such publications.
|
CYP Site Model |
Set |
No.
|
Top 1 |
Top 2 |
Top 3 |
|---|---|---|---|---|---|
|
1A2 |
Training |
372 |
72.0% |
89.0% |
96.2% |
|
Test |
67 |
68.7% |
91.0% |
95.5% |
|
|
2A6 |
Training |
107 |
76.6% |
91.6% |
95.3% |
|
Test |
19 |
89.5% |
89.5% |
89.5% |
|
|
2B6 |
Training |
172 |
72.1% |
89.5% |
96.5% |
|
Test |
31 |
67.7% |
87.1% |
93.5% |
|
|
2C8 |
Training |
179 |
62.0% |
85.5% |
92.2% |
|
Test |
30 |
76.7% |
90.0% |
93.3% |
|
|
2C9 |
Training |
283 |
69.3% |
87.6% |
93.6% |
|
Test |
63 |
69.8% |
82.5% |
90.5% |
|
|
2C19 |
Training |
294 |
74.8% |
89.8% |
96.6% |
|
Test |
49 |
73.5% |
83.7% |
89.8% |
|
|
2D6 |
Training |
387 |
73.6% |
89.9% |
95.3% |
|
Test |
69 |
79.7% |
89.9% |
94.2% |
|
|
2E1 |
Training |
148 |
73.6% |
88.5% |
95.9% |
|
Test |
27 |
55.6% |
88.9% |
96 .3% |
|
|
3A4 |
Training |
816 |
68.9% |
85.7% |
92.4% |
|
Test |
144 |
70.1% |
84.7% |
93.1% |
Performance of the models on both training and test sets is excellent, especially when compared with other reported models of sites of metabolism. The smaller numbers result from filtering out of molecules with few atoms (\< 4) and molecules lacking heavy atoms that are not sites of metabolism (e.g., if a carbon in benzene is a site, then there are no non-sites) from the statistics. Inclusion of such molecules would artificially inflate the statistics.
Scope of the models
The types of reactions encompassed by the models include aliphatic and aromatic carbon hydroxylation, N- and O-dealkylations, sulfoxidation, N-hydroxylation, N-oxide formation, and desulfuration (modeled using doubly bonded sulfur as the site). Epoxidation reactions are currently not included. The site predictions are based on atomic descriptors as inputs for model predictions. Epoxidation occurs via oxygen insertion into double or aromatic bonds, so modeling it would require the use of bond-based descriptors and sites based on bonds. There are also a somewhat limited number of confirmed epoxide metabolites, and when this number is filtered down to specific CYP’s, the limited number of instances becomes problematic for model building. These reactions may be considered for a future release.
Site models were built for each of the nine CYP isoforms by compiling lists of known reactions for each CYP and assigning an atomic site of metabolism for each reaction. In determining which CYPs mediated a given reaction, strong preference was given to results of recombinant CYP assay experiments. If such results were not available, inhibition experiments or activity correlation studies in human liver microsomal assays were accepted. For dealkylation reactions, the site of metabolism was generally assigned as the dealkylating carbon except for cases where detailed studies provided evidence of a different mechanism, as in the example of tegafur (Ikeda, et al. 2000). Otherwise, the assigned site was the hydroxylated or oxidized atom.
Literature reports of drug metabolism often list some metabolites whose structure was not confirmed or determined. Such cases can result in model predictions of apparent “false positives” that are actually true positives. A false negative prediction, on the other hand, is generally assumed to be a genuinely incorrect result, because the model failed to predict a confirmed observation. This assumes (sometimes incorrectly) that there has been no experimental or clerical error.
CYP site scores
The CYP site models consist of ANNEs that use atomic as well as molecular descriptors. The model output is an average of a logistic output from each individual network that ranges from 0 to 1. To help balance the ratio of positives and negatives and reduce the false positive rate, the set of atoms used as inputs for the training set were filtered to remove atom types never observed as sites across all tabulated CYP-mediated reactions. For example, carbons not bearing hydrogens were removed from the training set, and only C, N, and S atoms were considered as potential oxidation sites.
Mercaptoethyl (CH2CH2SH) and closely related aliphatic thiols are disallowed as sites. Though they are subject to oxidation, their appearance in key metabolic intermediates - glutathione, Coenzyme A, cysteine, homocysteine and cysteamine - has provided a powerful negative selection pressure against their oxidation by CYPs. There are specific enzymes that tightly regulate the redox state of such thiols, but CYPs are not involved.
Atoms that were known sites were given higher weight in the training process to reduce the number of false negatives while being somewhat more tolerant of false positives. This produces a more balanced model, and accounts for the possibility that false positives may represent unreported or unidentified metabolites.
Each candidate atom of a molecule receives a continuous output score for each ANNC CYP site model. The molecule’s highest scoring atom is classified as a site (unless the score is below a predetermined threshold) and all other atoms of that molecule within a relative value of that score are also assigned as sites. The atomic scores and the site assignments may be viewed in the Atomic Properties Display window by selecting a row in the spreadsheet then clicking on the "A" icon in the toolbar, using the Shift+A keyboard shortcut or by double-clicking in a CYPxxx_Sites column in the spreadsheet. For example:
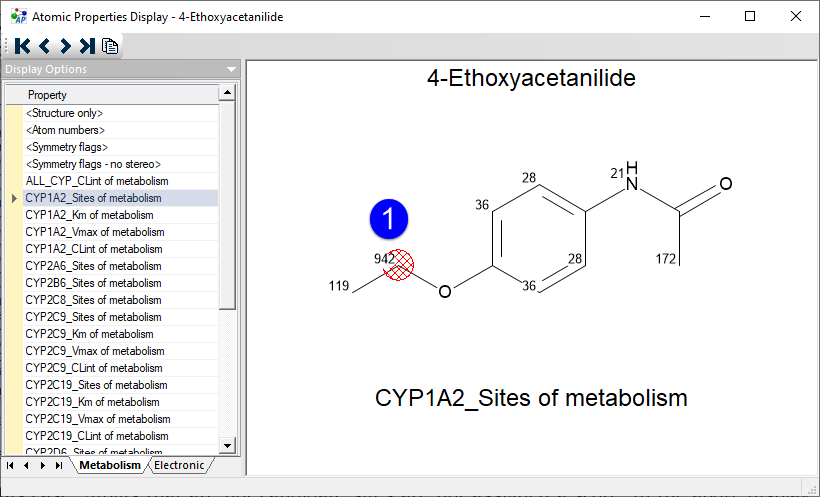
The scores displayed have been rescaled to range from 0-1000, with higher scores indicating a greater propensity for metabolism. The highest scoring atom is highlighted with a red hatched circle (1). Other atoms with scores near the maximum are also highlighted, though there are none in this case. Atoms that are not candidate sites are not assigned a score. In the above display, oxygens and non-hydrogen bearing carbons are not candidate sites.
The CYP site scores should not be interpreted via inappropriate comparisons. Each CYP site model was developed from a data set specific to that CYP isoform. Consequently, scores for the same molecule should NOT be compared between different CYPs. For a given atom, a higher score for one CYP vs. another is NOT an indicator that it is more likely to be metabolized by the higher scoring CYP. Similarly, differences in scores between molecules for the same CYP are NOT indicators that molecules having higher scoring atoms are more rapidly metabolized or more likely to be substrates than lower scoring ones. The scores are only estimates of which atoms are more likely to be metabolized within that molecule for that particular CYP. They are also NOT indicators of which metabolite will be the major form, only which atom has the higher likelihood of being a site of metabolism.
In the case of 4-ethoxyacetanilide, the predicted site is an alkyl carbon bonded to oxygen and represents a site of O-dealkylation. However, in some cases carbons bonded to oxygen or nitrogen may not dealkylate if the metabolite resulting from carbon hydroxylation is stable (e.g., as in some ring systems). Please see the introductory CYP metabolism section for other display details, including generation of integrated metabolic schemes in MedChem Designer.
False positives that aren't
Beyond the statistical challenges of modeling imbalanced data sets, there is also the issue of experimental validity (or possible lack thereof) with regard to (nominal) false positives and metabolic site prediction. A "false positive" in this context corresponds to a model predicting a metabolite which has not been observed experimentally. This does not mean the metabolite is not produced; only that it has not been observed or reported, which is not the same thing. In many cases, unknown metabolites have been observed, but their chemical structures were not determined. Hence a false positive may correspond to such an unidentified metabolite.
In other cases, experimenters are interested in a specific metabolite due to its pharmacology or toxicity. They may determine which CYP isoforms are responsible for its formation, but are not interested in other metabolites that may be produced by those CYPs. We assign sites of metabolism based on the metabolites which are reported and treat the other sites are presumed to represent negative examples. However, based on the properties of similar molecules, the model may assign sites of metabolism that actually occur, but have not yet been reported.
A good example is found in the case of chlorpromazine:
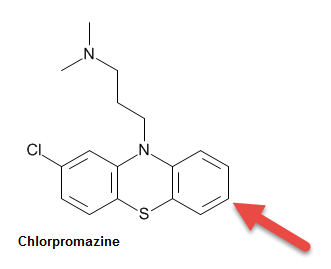
As of 2009, the only reported metabolite (of which we are aware) was hydroxylation of C-7, identified by the arrow in the above diagram, which is mediated by CYPs 1A2 and 2D6 (Yoshii 2000). However, the CYP1A2_Sites data set includes two very similar compounds, perazine and promazine, which are shown below with arrows indicating their reported sites of metabolism by CYP1A2 (Wójcikowski 2003; Wójcikowski 2004).
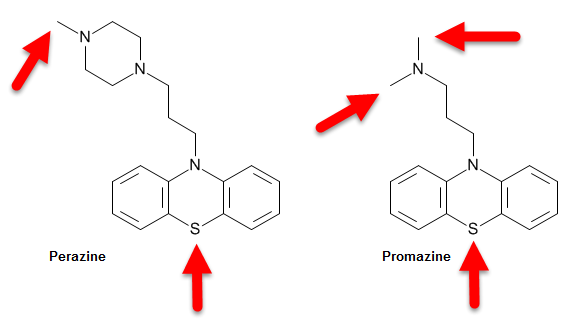
Given these results, it is not unreasonable for the CYP1A2_Sites model to predict that the sulfur and N-methyl carbons of chlorpromazine are SOMs. As of 2009, such assignments were nominally false positives. However, late in 2010, both N-demethylation and sulfoxidation of chlorpromazine by CYP1A2 were reported (Wójcikowski 2010). Hence, predictions that were "false" positives in 2009 became true positives in 2010!
The data set above has been updated since these models were built and these two "extra" sites (of N-demethylation and sulfoxidation) have already been included in the newly updated data set.
The scientific literature contains further discussion on the issue of false positives in metabolic site models (Hennemann 2009; Waldman 2015).