CYP Enzyme Inhibition Constant
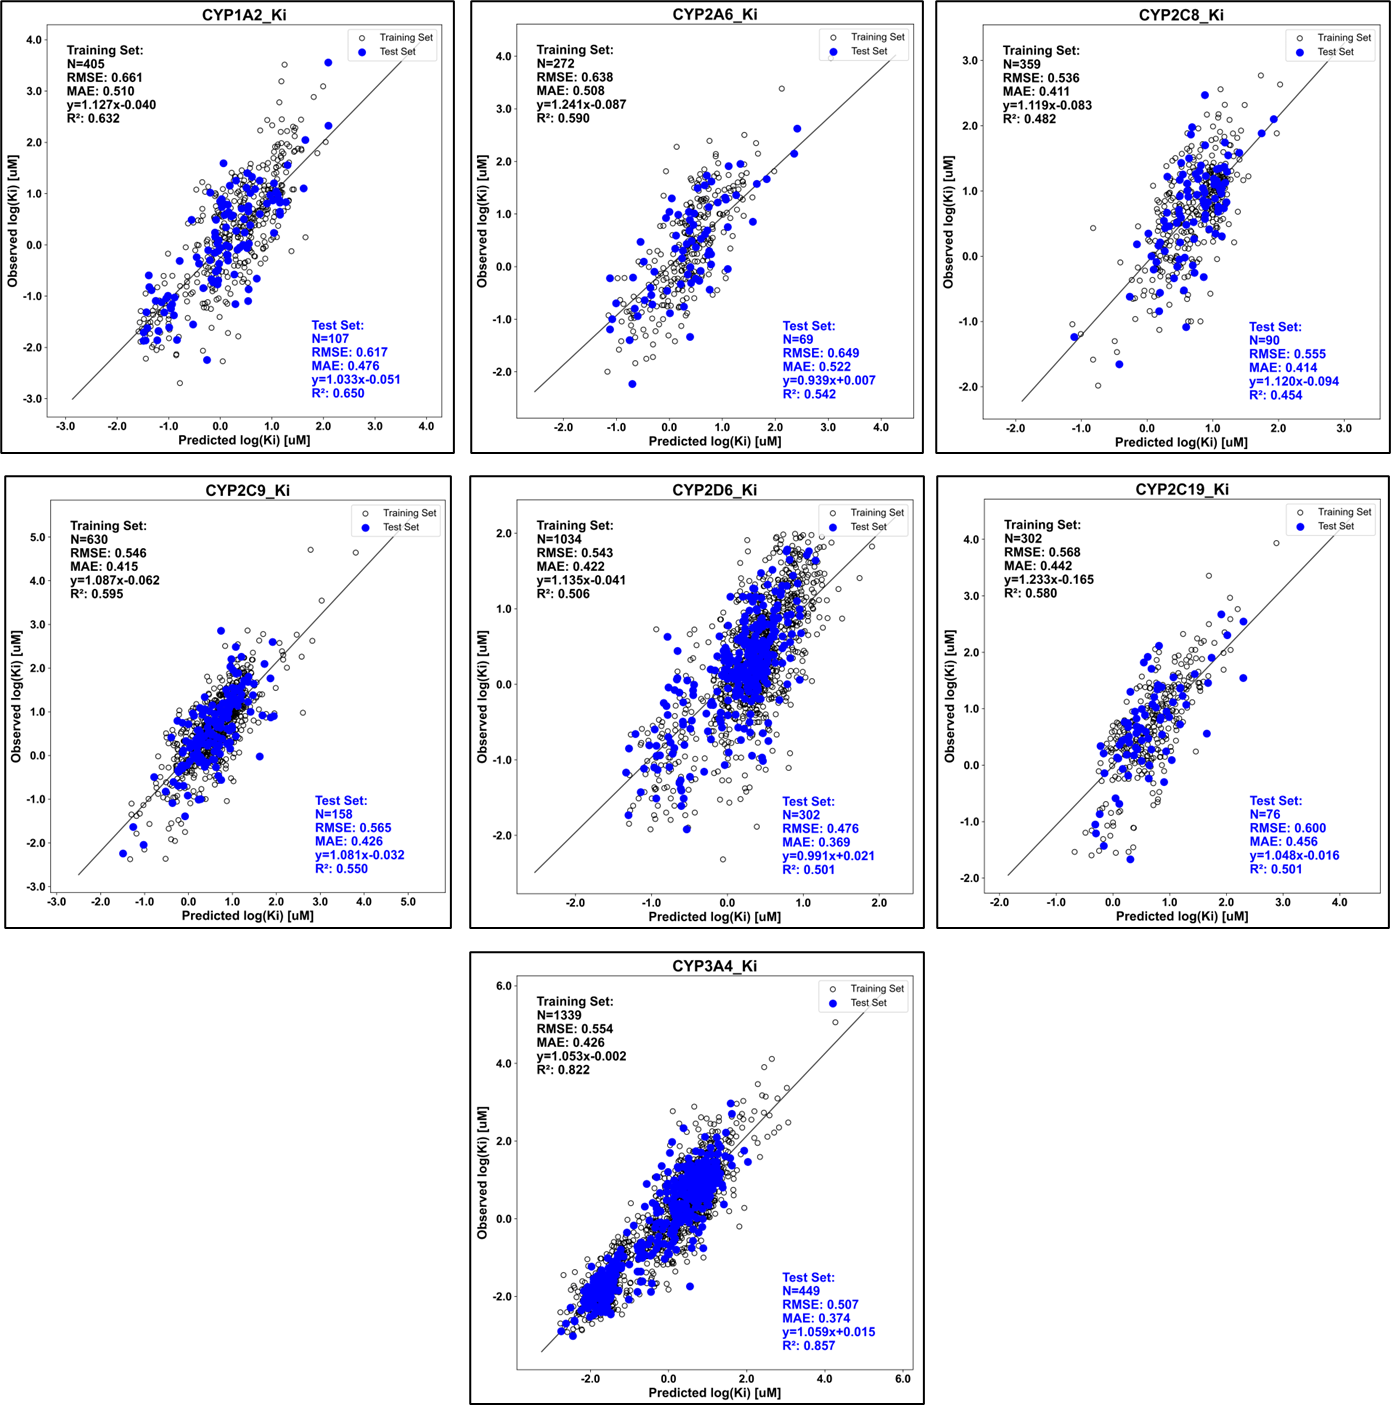
Starting with ADMET Predictor 11, seven new regression models have been introduced to predict the inhibition constant (Ki) for CYP isoforms 1A2, 2A6, 2C8, 2C9, 2C19, 2D6 and 3A4.
To our knowledge, no global model is reported in the literature that can be used to predict IC50 or Ki for CYP inhibition. Experiments to determine IC50 are dependent upon the substrate used: i.e., different substrates may result in different IC50 values for the same inhibitor. Ki is a constant value for a given compound with an enzyme, while an IC50 is a relative value whose magnitude depends upon the substrate concentration used in the assay. Hence we decided to build models to predict Ki against each isoform of interest.
Collecting data for CYP Ki was very difficult. To our knowledge, there is no such dataset available in the literature. The primary source of our data was the commercial database GOSTAR (https://www.gostardb.com), followed by the Drug Interaction Database (DIDB) compiled by the University of Washington. In addition to these two databases, data was retrieved from ChEMBL as well as individual publications. All data was merged.
HLM vs recombinant CYPs
Most CYP inhibition assays are conducted using either human liver microsomes (HLM) or recombinant CYPs. The biological endpoints measured by HLM and recombinant CYPs were separated, and the individual subsets were cleaned and curated separately. Compounds that had identical binding activity (Ki or IC50) were identified; one of the duplicates was retained and the remaining ones were discarded.
Calculating the Ki from IC50 values
IC50 values were converted into corresponding Ki using the Cheng Prusoff equation below.
where
Ki = the inhibitory constant
IC50 = the concentration at which the inhibitory ligand displaces 50% of the substrate.
[S] = the concentration of substrate used in the binding assay
Km = the affinity constant of the substrate
The [S] and Km values were extracted from the assay protocol provided in the corresponding publication. In the absence of Km within the publication, the Km value was obtained from the internal dataset that was collected.
We have compiled a dataset of all published Km values for all the possible substrates that have been reported in the literature. In cases where different Km values were obtained from multiple sources, the geometric mean of Km values were used.
Handling duplicate compounds
For compounds that had multiple binding affinity values, the geometric mean and standard deviation were calculated. The compounds with high standard deviations (SD > 2) were removed from further analysis.
The final datasets for the seven CYP isoforms are composed of compounds ranging from 341 (CYP2A6) to over 1750 (CYP3A4). Each dataset was divided into training (80%) and test sets (20%). Observed versus predicted plots for log(Ki) are shown below for each model. The inhibitory constant models depend on their corresponding CYP inhibition classification model. If the classification model predicts "No" then the corresponding Ki model predicts "NonInhibitor"; otherwise it is the predicted value in μM.