

2.8.3. Human Toxicity
ADMET Predictor includes models for several toxicity endpoints that are particularly relevant to humans. The most specific property modeled is hERG binding, whereas the most loosely defined prediction is whether the maximum recommended therapeutic (human) dose (MaxRTD) is likely to be safe. There is a set of five models for elevated blood enzyme levels (Ser_AlkPhos, Ser_GGT, Ser_LDH, Ser_AST and SER_ALT) that, taken together, are diagnostic for liver injury. A model for phospholipidosis is also described in this section.
Genetic and reproductive toxicity models are relevant to human beings as well as to other organisms, especially the chromosomal aberration and reproductive toxicity models (section 2.8.1). Models for some ecotoxicity endpoints (section 2.8.4), especially those for estrogen and androgen receptor binding, may also be pertinent in some cases.
hERG potassium channel binding
The human Ether-à-go-go Related Gene (hERG) encodes a potassium channel that participates in the repolarization of the cardiac action potential that sustains the heartbeat. Blockage or any other impairment of its function can prolong the QT interval and may lead to the sometimes fatal cardiac arrhythmia known as Torsades de pointes.
Drug-induced blockage of potassium channels has been a major concern for the pharmaceutical industry since 1997, contributing to half of the subsequent safety-related drug recalls and impacting all therapeutic drug classes. Testing for hERG blockage and monitoring for early after depolarization (EAD) effects is now mandatory for pharmaceutical discovery and development groups.
ADMET Predictor provides two ANNE models for assessing the likelihood that a compound will interfere with the hERG K+ channel. The first is the classification model hERG_Filter, which indicates whether the compound is likely to bind to the channel. The other model - hERG_pIC50 - is a quantitative one that predicts hERG binding affinity. Both models were developed using a same data.
Patch-clamp analysis data was collected for a total of 2166 compounds from the open literature. For compounds with multiple reported IC50 values, the geometric mean was used. Compounds with an IC50 greater than 10μM were taken as negative examples, while those with an IC50 less than or equal to 10μM were categorized as positives. The resulting model provides a "Yes" or "No" answer to the question, "Is this compound a potential hERG blocker?"
|
Model |
Set |
Negatives |
Positives |
Total |
Correct |
Concordance |
Sensitivity |
Specificity |
|---|---|---|---|---|---|---|---|---|
|
hERG_Filter |
Training |
738 |
994 |
1732 |
1452 |
83.8% |
83.7% |
84.0% |
|
Test |
161 |
273 |
434 |
360 |
82.9% |
83.8% |
81.3% |
A 1517 compound subset of the data set used to build the classification model was used to generate the hERG_pIC50 affinity model. No data from ligand displacement assays were used. The model predicts the pIC50 value of particular compound where IC50 is given in molar (M) units of concentration. Twenty percent of the entire set was kept aside as an external test set for evaluation of the final models. The model was trained using the remaining ~1200 compounds. The RMSE of test set was 0.549.
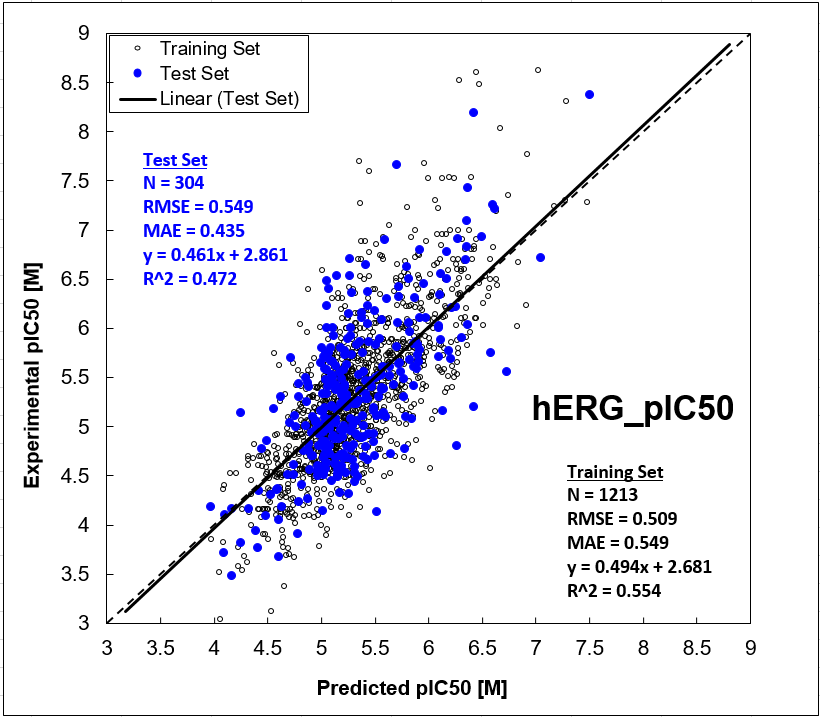
Note: The hERG models in previous ADMET Predictor releases were built using a combination of data from patch clamp experiments and data from high-quality ligand displacement assays. To build our new hERG models, we have relied exclusively on patch clamp data, which is now the industry gold standard.
Hepatotoxicity
The US Food and Drug Administration’s Center for Drug Evaluation and Research has been collecting reports on human liver adverse effects of drugs since 1968. The result of this work is two databases, Spontaneous Reporting System (SRS) and Adverse Event Reporting System (AERS). ADMET Predictor uses a subset of 490 compounds from publicly available (non-proprietary) SRS database, gathered 1978 – 1996, to model hepatotoxicity of many widely used pharmaceuticals. The reports were collected for up to a five year period for each compound in the study. The details can be found in literature (Matthews 2004b) and on the FDA website.
Modeling Adverse Drug Reaction (ADR) effects is challenging because of several unique attributes of this type of data. The number of ADR reports for individual drugs varies and is dependent on the length of time the drug was marketed and the number of patients taking the medication. Some effects are underestimated due to insufficient data. Furthermore, several medications taken simultaneously by a patient make it sometimes difficult to identify a drug mostly attributed to the adverse effect.
To make the data more comparable each data point in the model database accounts for the volume of the pharmaceutical product in the form of a shipping unit. The ADR report data and the pharmaceutical shipping values are used to estimate pharmaceutical usage and human exposure by calculating the Reporting Index (RI = (# ADR reports / # shipping units) × 1,000,000).
Five blood serum enzymes are commonly used to diagnose hepatic ADRs. Serum alkaline phosphatase (Ser_AlkPhos), lactate dehydrogenase (Ser_LDH), and gamma-glutamyltransferase (GGT) can be elevated by damage to the liver or to some other types of tissue, whereas elevation of serum aspartate transaminase (Ser_AST) or serum alanine transaminase (Ser_ALT) is more specific for liver injury. In the clinic, elevation of both AST and ALT is diagnostic of liver damage, as is elevation in either coupled with elevation in serum alkaline phosphatase, LDH or GGT.
The SRS data set differentiates between 3 classes of compounds: inactive (RI \< 3.0), marginally active (3.0 ≤ RI \< 4.0) and active (RI ≥ 4.0). The neural network ensemble models employed in ADMET Predictor treat marginally active (marginally toxic) compounds as active by setting the RI cutoff value to 3.0. Therefore, molecules with RI \< 3.0 were categorized as negative ("Normal") and those with RI ≥ 3.0 as positive ("Elevated") for the respective enzymes.
|
Model |
Set |
Negatives |
Positives |
Total |
Correct |
Concordance |
Sensitivity |
Specificity |
|---|---|---|---|---|---|---|---|---|
|
Ser_AlkPhos |
Training |
46 |
59 |
105 |
91 |
86.6% |
89.8% |
82.6% |
|
Test |
9 |
10 |
19 |
17 |
89.4% |
90.0% |
88.8% |
|
|
Ser_LDH |
Training |
43 |
20 |
63 |
55 |
87.3% |
85.0% |
88.3% |
|
Test |
11 |
5 |
16 |
13 |
81.2% |
80.0% |
81.8% |
|
|
Ser_GGT |
Training |
66 |
34 |
100 |
95 |
95.0% |
97.0% |
93.9% |
|
Test |
19 |
7 |
26 |
23 |
88.4% |
85.7% |
89.4% |
|
|
Ser_AST |
Training |
49 |
48 |
97 |
87 |
89.6% |
91.6% |
87.7% |
|
Test |
15 |
10 |
25 |
20 |
80.0% |
80.0% |
80.0% |
|
|
Ser_ALT |
Training |
61 |
83 |
144 |
119 |
82.6% |
84.3% |
80.3% |
|
Test |
12 |
25 |
37 |
32 |
86.4% |
84.0% |
91.6% |
Maximum recommended therapeutic dose
The US Food and Drug Administration’s Center for Drug Evaluation and Research has compiled a database of maximum recommended therapeutic dose (MRTD) to better understand the relationship between structure, toxicity, and no-effect level (NOEL). Details of the work and non-proprietary data were published by the Informatics and Computational Safety Analysis Staff (ICSAS) (Matthews 2004a). According to their report:
Most of the MRTD values in the database were determined from pharmaceutical clinical trials that employed an oral route of exposure and daily treatments, usually for 3-12 months. The pharmaceuticals were given as single or divided dose treatment regimens to achieve desired pharmacological effects. In contrast, roughly 5% of the pharmaceuticals in the MRTD database were antineoplastics and anesthetics and were administered intravenously and/or intramuscularly. When separate MRTDs were reported for different routes of exposure, only the oral MRTD was included in the database. In addition, some pharmaceuticals have different MRTD values for male and female adults, children, or elderly patients. In this situation only MRTD values for the average adult patient were used.
Pharmaceuticals that are administered orally are usually tested over a limited range of doses and have MRTDs reported as mg/day. We converted the mg/day unit to mg/kg-body weight (bw)/day based upon an average adult weighing 60 kg. In contrast, the dose unit for most antineoplastic drug MRTDs is reported as mg/m2 which was converted to mg/kg-bw/day using the formula mg/kg-bw/day = mg/m2/37 for an average adult. Additionally, a few drugs had MRTDs reported in parts per million (ppm) which were converted to mg/kg-bw/day on the basis that 1000 ppm equals 25 mg/kg-bw/day for an average 60 kg adult. MRTD values for the 1233 chemicals in this dataset range from 0.00001 to 1000 mg/kg-bw/day.
Some classes of chemicals were excluded from the MRTD database due to their unsuitability for most QSAR modeling programs. These were inorganic chemicals, high molecular weight polymers (MWt > 5,000 Daltons), fibers, salts, mixtures of organic chemicals and small molecules (MWt \<100 Daltons). Predictions lower than 3.16 mg/kg-bw/day indicate a compound with significant potential for side effects, i.e., a "positive." Predictions higher than 3.16 mg/kg-bw/day indicate a compound for which side effects are less likely, i.e., a "negative."
|
Model |
Set |
Negatives |
Positives |
Total |
Correct |
Concordance |
Sensitivity |
Specificity |
|---|---|---|---|---|---|---|---|---|
|
Max RTD
|
Training |
447 |
539 |
986 |
795 |
80.6% |
80.5% |
80.7% |
|
Test |
72 |
102 |
174 |
143 |
82.1% |
81.3% |
83.3% |
|
|
MaxRTD
|
Training |
426 |
558 |
984 |
814 |
82.7% |
81.2% |
84.7% |
|
Test |
99 |
90 |
189 |
150 |
79.4% |
75.6% |
82.8% |
ADMET Predictor employs ANNE models to classify the MRTD value for both 2D and 3D representations of molecules. Max_RTD predictions are reported as mg/kg of body weight/day. The cutoff used for the models is approximately halfway, 0.5 units on the logarithmic scale, between those used by Matthews et al.
Phospholipidosis
Phospholipidosis is a characterized by the accumulation of phospholipids in tissues throughout the body. The accumulation occurs in lysosomes, cellular organelles containing enzymes which break down waste cellular materials for excretion. In individuals with lysosomal storage disorders, materials that are normally metabolized by the lysosomes become trapped in the cells. Metabolic disorders can be hereditary, but they can also be drug-induced, which is the case with phospholipidosis.
Cationic amphiphiles and other drugs have been shown to induce phospholipidosis in cells of different type (Lowe 2010). Compounds that induce phospholipidosis typically form part of the cell wall and are continuously present in low levels. Pathologically, the level of phospholipidizers rises significantly, contributing to the development of structures known as myeloid bodies. These lamellar inclusions are most reliably identified by electron microscopy (Tomizawa 2006), but light microscopy can also be used identify cells which appear vacuolated and contain the foamy macrophages indicative of phospholipidosis (Reasor 2001).
A variety of classes of drugs can induce phospholipidosis and despite numerous studies, the mechanism through which phospholipidosis occurs is not fully understood. Fortunately, the observation of compound-induced phospholipidosis in the drug development process is considered manageable as the effect often only occurs at very high doses, many times that of the intended therapeutic dose (Pelletier 2007). In cases where phospholipidosis occurred due to therapeutic treatment, termination of the treatment resulted in the drug being expelled from the cell followed by phospholipid levels returning to normal in a matter of weeks and in some cases months (Nioi 2007).
Phospholipidosis is considered to be particularly important in the context of the nervous system, where the presence of phospholipids may disrupt neuronal cell signaling and may be linked to genetic diseases such as Niemann-Pick disease (Nioi 2007; Sawada 2005). The identification of phospholipidosis can delay or halt drug development because of extra testing needed to satisfy regulators.
A data set of 578 compounds (429 non-inducers and 149 inducers of phospholipidosis) was derived from literature (Lowe 2010; Przybylak 2011; Orogo 2012) and used to build a classification model. 462 compounds were used to train/verify the model (94.8% concordance) and 116 compounds were set aside, as an external test set (94% concordance) for validation purposes. Negatives (non-inducers) are classified as ‘Nontoxic’, while positives (inducers) are classified as ‘Toxic’ by PLipidosis.
|
Model |
Set |
Negatives |
Positives |
Total |
Correct |
Concordance |
Sensitivity |
Specificity |
|---|---|---|---|---|---|---|---|---|
|
PLipidosis |
Training |
346 |
116 |
462 |
438 |
94.8% |
92.2% |
95.6% |
|
Test |
83 |
33 |
116 |
110 |
94.8% |
96.9% |
93.9% |
Note: The data set used to train and validate PLipidosis has evolved over the years. New data obtained from Przybylak et al. and Orogo et al. were combined with the data from Lowe et al. All redundant duplicate compounds were removed. In cases where duplicate compounds contained discordant observations, a literature search was performed to assign the most appropriate value. In the case where no definitive value could be assigned, the compound was dropped.
Furthermore, data from Orogo et al. was obtained from a keyword search that spanned published literature, internal FDA archives and PharmaPendium. When a search indicated a compound was associated with a keyword (such as ‘phospholipid accumulation’ or ‘accumulation of foamy macrophages’, etc.), then the compound was designated an inducer of phospholipidosis. When the search did not return an association between a compound and the keywords, the compound was labeled as a "non-inducer."
This approach casts a wide net but can get confused by context - e.g., "not observed to cause phospholipidosis" can get scored as a positive. Even though some efforts were made by Orogo et al. (Orogo 2012) to distinguish the confidence based on the data returned from the keyword searches, further curation was necessary. Data that could not be modeled (e.g., because it contained metals) was excluded from the data set used to train and validate PLipidosis.
Endocrine receptor binding
The potential environmental damage done by exposure to endocrine disruptors has gone unappreciated until relatively recently. There, the compounds compete for binding with estrogenic or androgenic sex hormones, blocking the timely transmission of normal hormonal signals or, in a few cases, producing them. Assays are run on rat endocrine receptors but the results are applicable to vertebrates in general. Though the most common application of these models is connected with environmental release, they can also flag unwanted off-target effects of drug candidates. This is a particularly relevant consideration for virtual screening hits drawn from commercial databases.
Numerous studies have been coordinated by the US Food and Drug Administration’s National Center for Toxicological Research to characterize a wide variety of natural and synthetic estrogens (Fang 2001; Blair 2000; Branham 2002) and androgens (Fang 2003; Zhao 2006; Söderholm 2008). This data has been gathered in the US Environmental Protection Agency’s DSSTox database, which was used to train ADMET Predictor's models of endocrine receptor binding.
Two neural network ensemble models are used to assess a compound’s likelihood of binding to the estrogen receptor. Estro_Filter is a straightforward prediction of whether the molecule will have a appreciable affinity for the estrogen receptor at all. A negative (“Nontoxic”) classification indicates that the compound is unlikely to cause endocrine disruption by binding to the receptor, whereas a positive (“Toxic”) indicates only that the compound is likely to bind detectably to the receptor – the degree of toxicity is not specified.
|
Model |
Set |
Negatives |
Positives |
Total |
Correct |
Concordance |
Sensitivity |
Specificity |
|---|---|---|---|---|---|---|---|---|
|
Estro_Filter
|
Training |
79 |
96 |
175 |
162 |
92.5% |
93.7% |
91.1% |
|
Test |
19 |
28 |
47 |
43 |
91.4% |
92.8% |
89.4% |
|
|
Estro_Filter
|
Training |
79 |
99 |
178 |
170 |
95.5% |
93.9% |
97.5% |
|
Test |
19 |
25 |
44 |
41 |
93.2% |
92.0% |
94.7% |
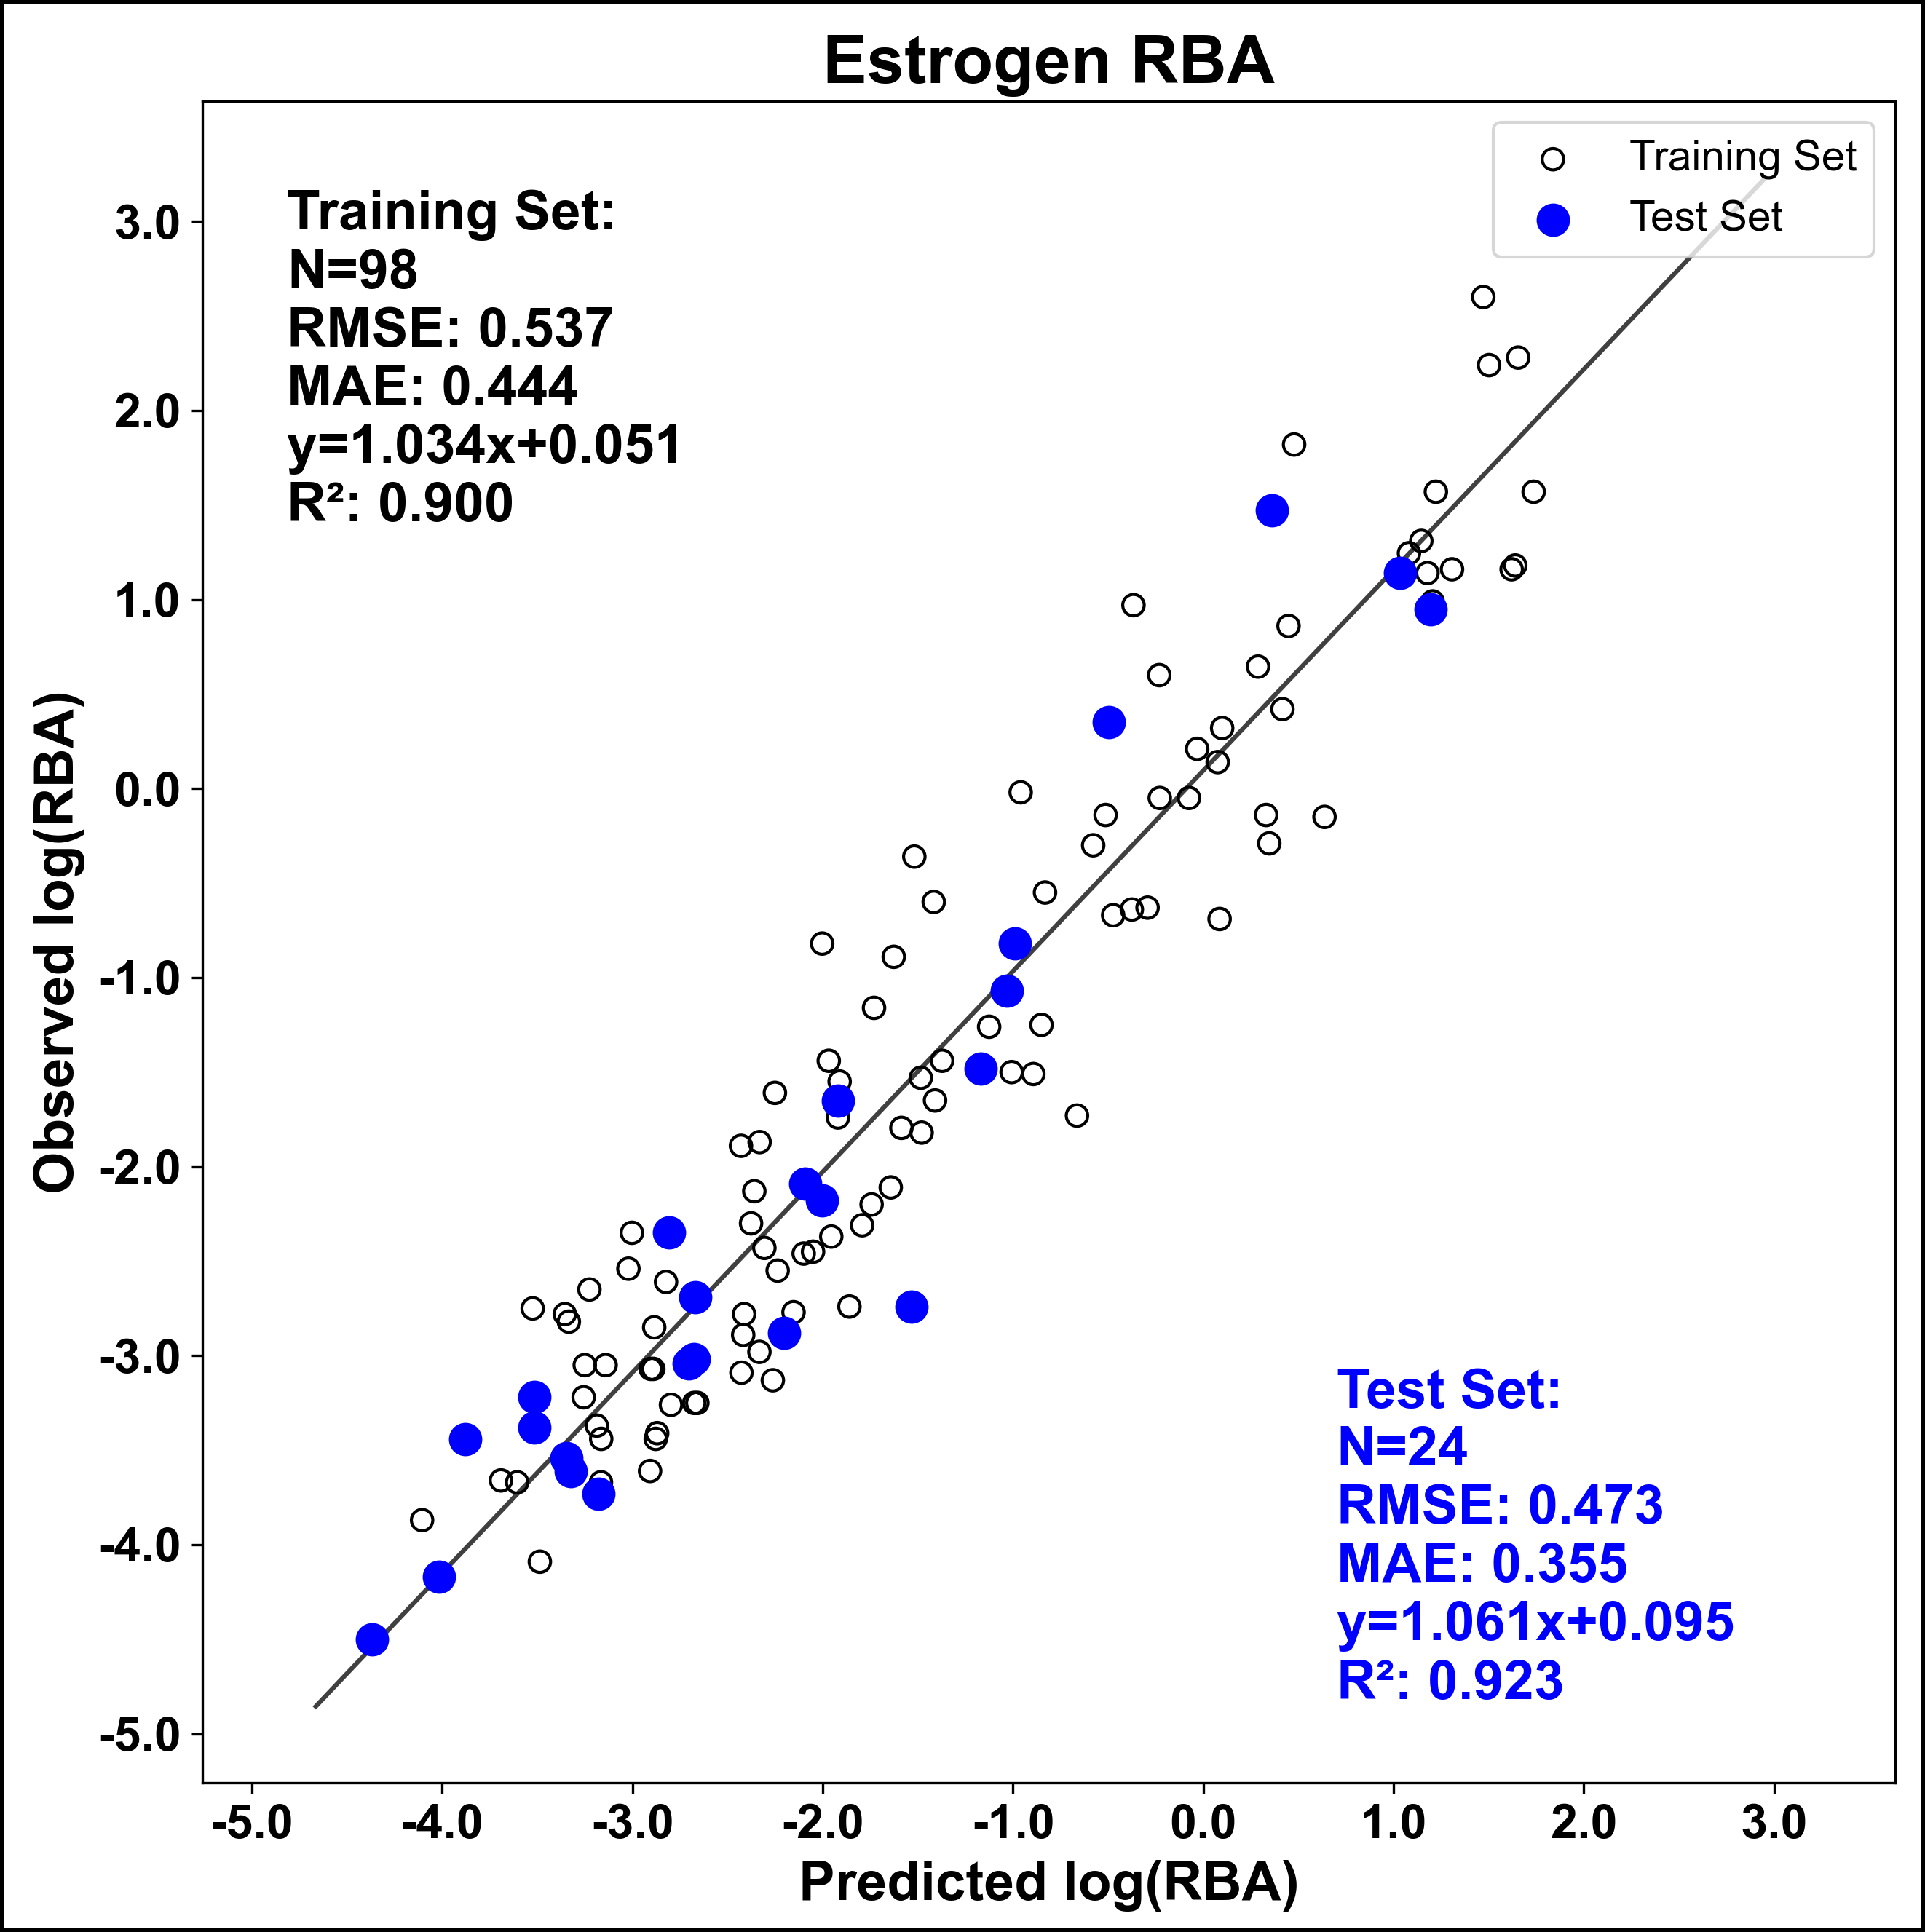
The companion regression model (Estro_RBA) predicts the strength of binding for those compounds identified by Estro_Filter as “Toxic”. It predicts the relative binding affinity (%RBA) of a molecule determined by a radioligand displacement assay. The RBA is a dimensionless number expressed as the percent ratio:
100% * (IC50 for 17-estradiol)/(IC50 for the drug in question)
The model was developed in the logarithmic space, but the final output is in %RBA for compounds classified by Estro_Filter as "Toxic." Those classified as "Nontoxic" are by construction out of scope for Estro_RBA, so the output is "Nontoxic" rather than any numerical value. Higher RBA values indicate greater binding affinity and an increased likelihood of causing endocrine disruption.
Likewise, two neural network ensemble models are used to assess a compound’s likelihood of binding to the androgen receptor. Andro_Filter is a classification model for predicting whether the compound will have affinity for the receptor. The reference ligand here is the synthetic androgen 17R-methyl-[3H]-methyltrienolone (R1881), which binds more strongly than testosterone. Because of this, the LC25 of R1881 displacement was used to determine toxicity rather than the LC50. Compounds with LC25 less than or equal to 10 μM were taken as positives (“Toxic”) while those greater than 10 μM are taken as negatives (“Nontoxic”) (Vinggaard 2008; Li 2010).
|
Model |
Set |
Negatives |
Positives |
Total |
Correct |
Concordance |
Sensitivity |
Specificity |
|---|---|---|---|---|---|---|---|---|
|
Andro_Filter |
Training |
302 |
281 |
583 |
474 |
81.3% |
81.4% |
81.1% |
|
Test |
70 |
76 |
146 |
120 |
82.5% |
82.8% |
81.4% |
The companion regression model Andro_RBA predicts the strength of binding for those compounds that are identified by the filter as “Toxic”. In this case IC50 measurements were used from R1881 displacement assays. The %RBA, model’s output, is a dimensionless number that is calculated by dividing the IC50 of R1881 (3.07×10⁻⁹ M) by the IC50 of the competing ligand, expressed as a percentage. Higher values indicate greater binding affinity and increased likelihood for androgen-related toxicity.
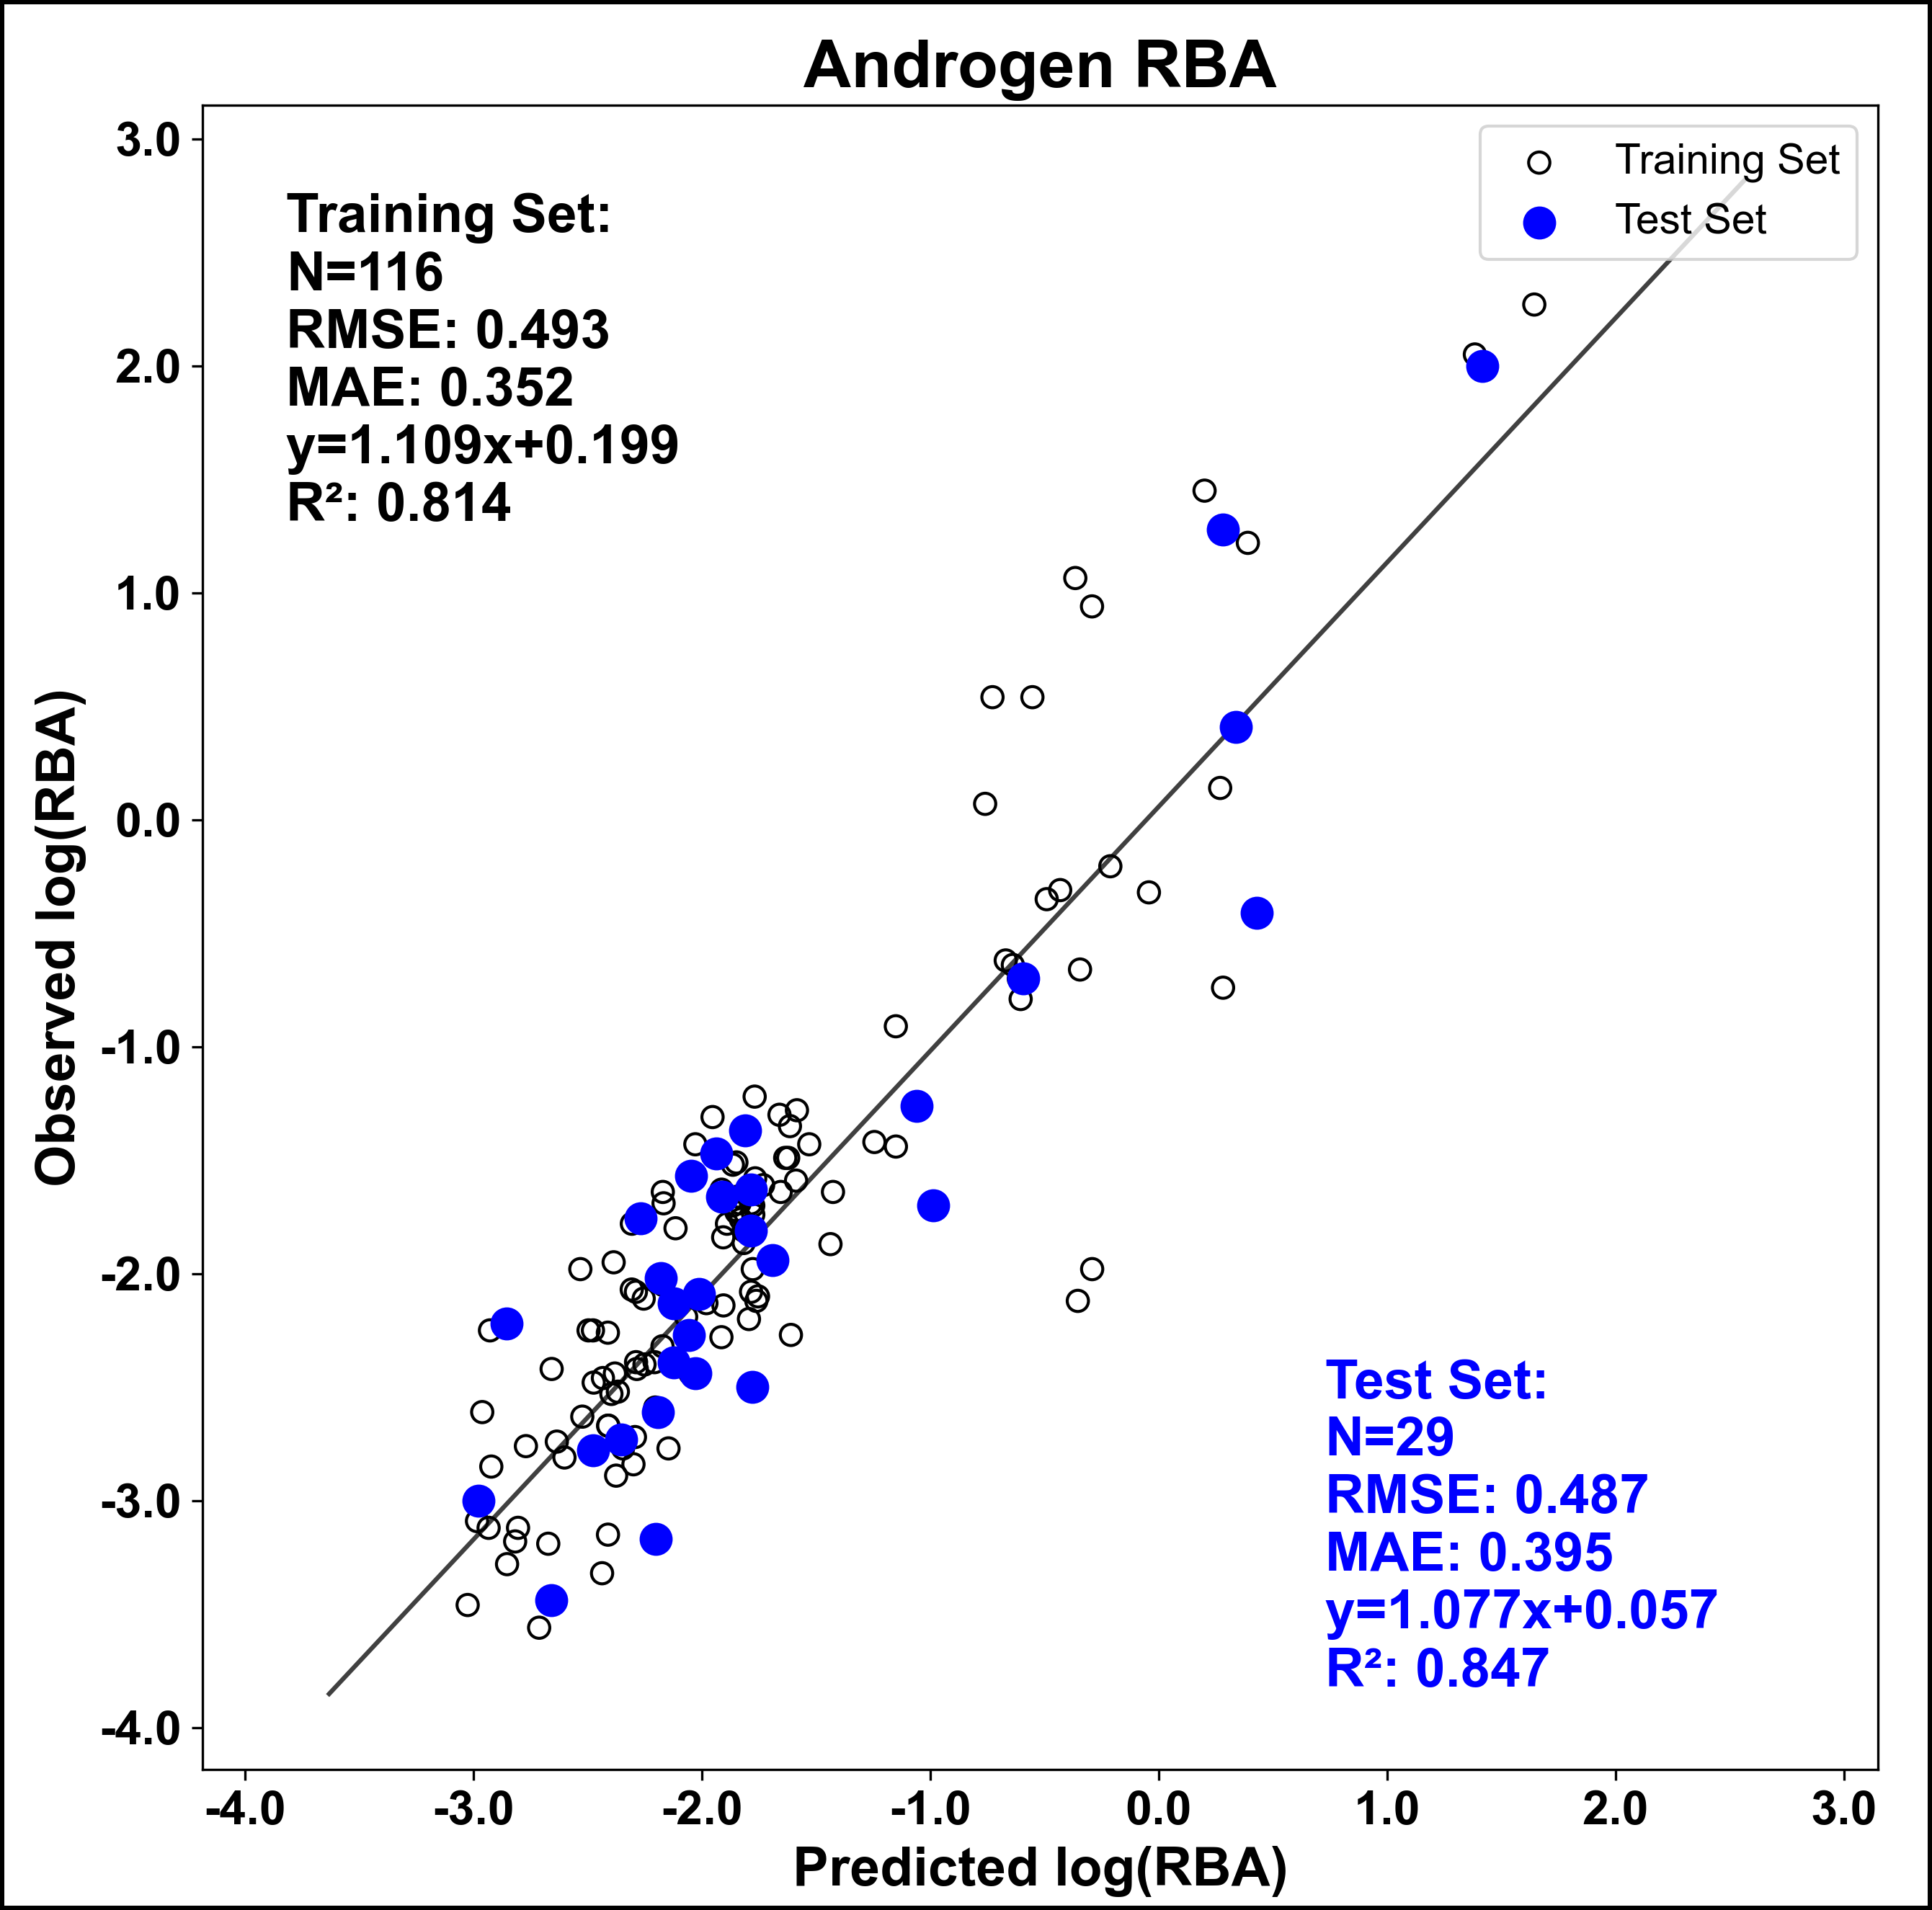
Andro_RBA models were trained only on compounds classified as "Toxic" under the definition used to create Andro_Filter. Consequently, the Andro_RBA output for compounds predicted to be “Nontoxic” by Andro_Filter is "Nontoxic" rather than a numerical value.