2.8.4. Ecotoxicity
Environmental effects of small molecules have been studied for many years, in part to prepare for accidental release from production plants, with exposure to aquatic species being of particular regulatory concern. ADMET Predictor provides two models for environmental persistence (bioconcentration and biodegradation), where high and low values (respectively) signal exposure risks. Expected acute toxicity can be characterized at three different trophic levels (Tetrahymena, water flea (Daphnia) and fathead minnow), whereas developmental effects due to interference with sex hormones are predicted by paired classification and regression models: Estro_Filter and Andro_Filter identify potential estrogen and androgen disruptors, respectively, whereas Estro_RBA and Andro_RBA indicate how well a compound flagged by one of the filters is likely to compete with the corresponding natural ligand for its receptor.
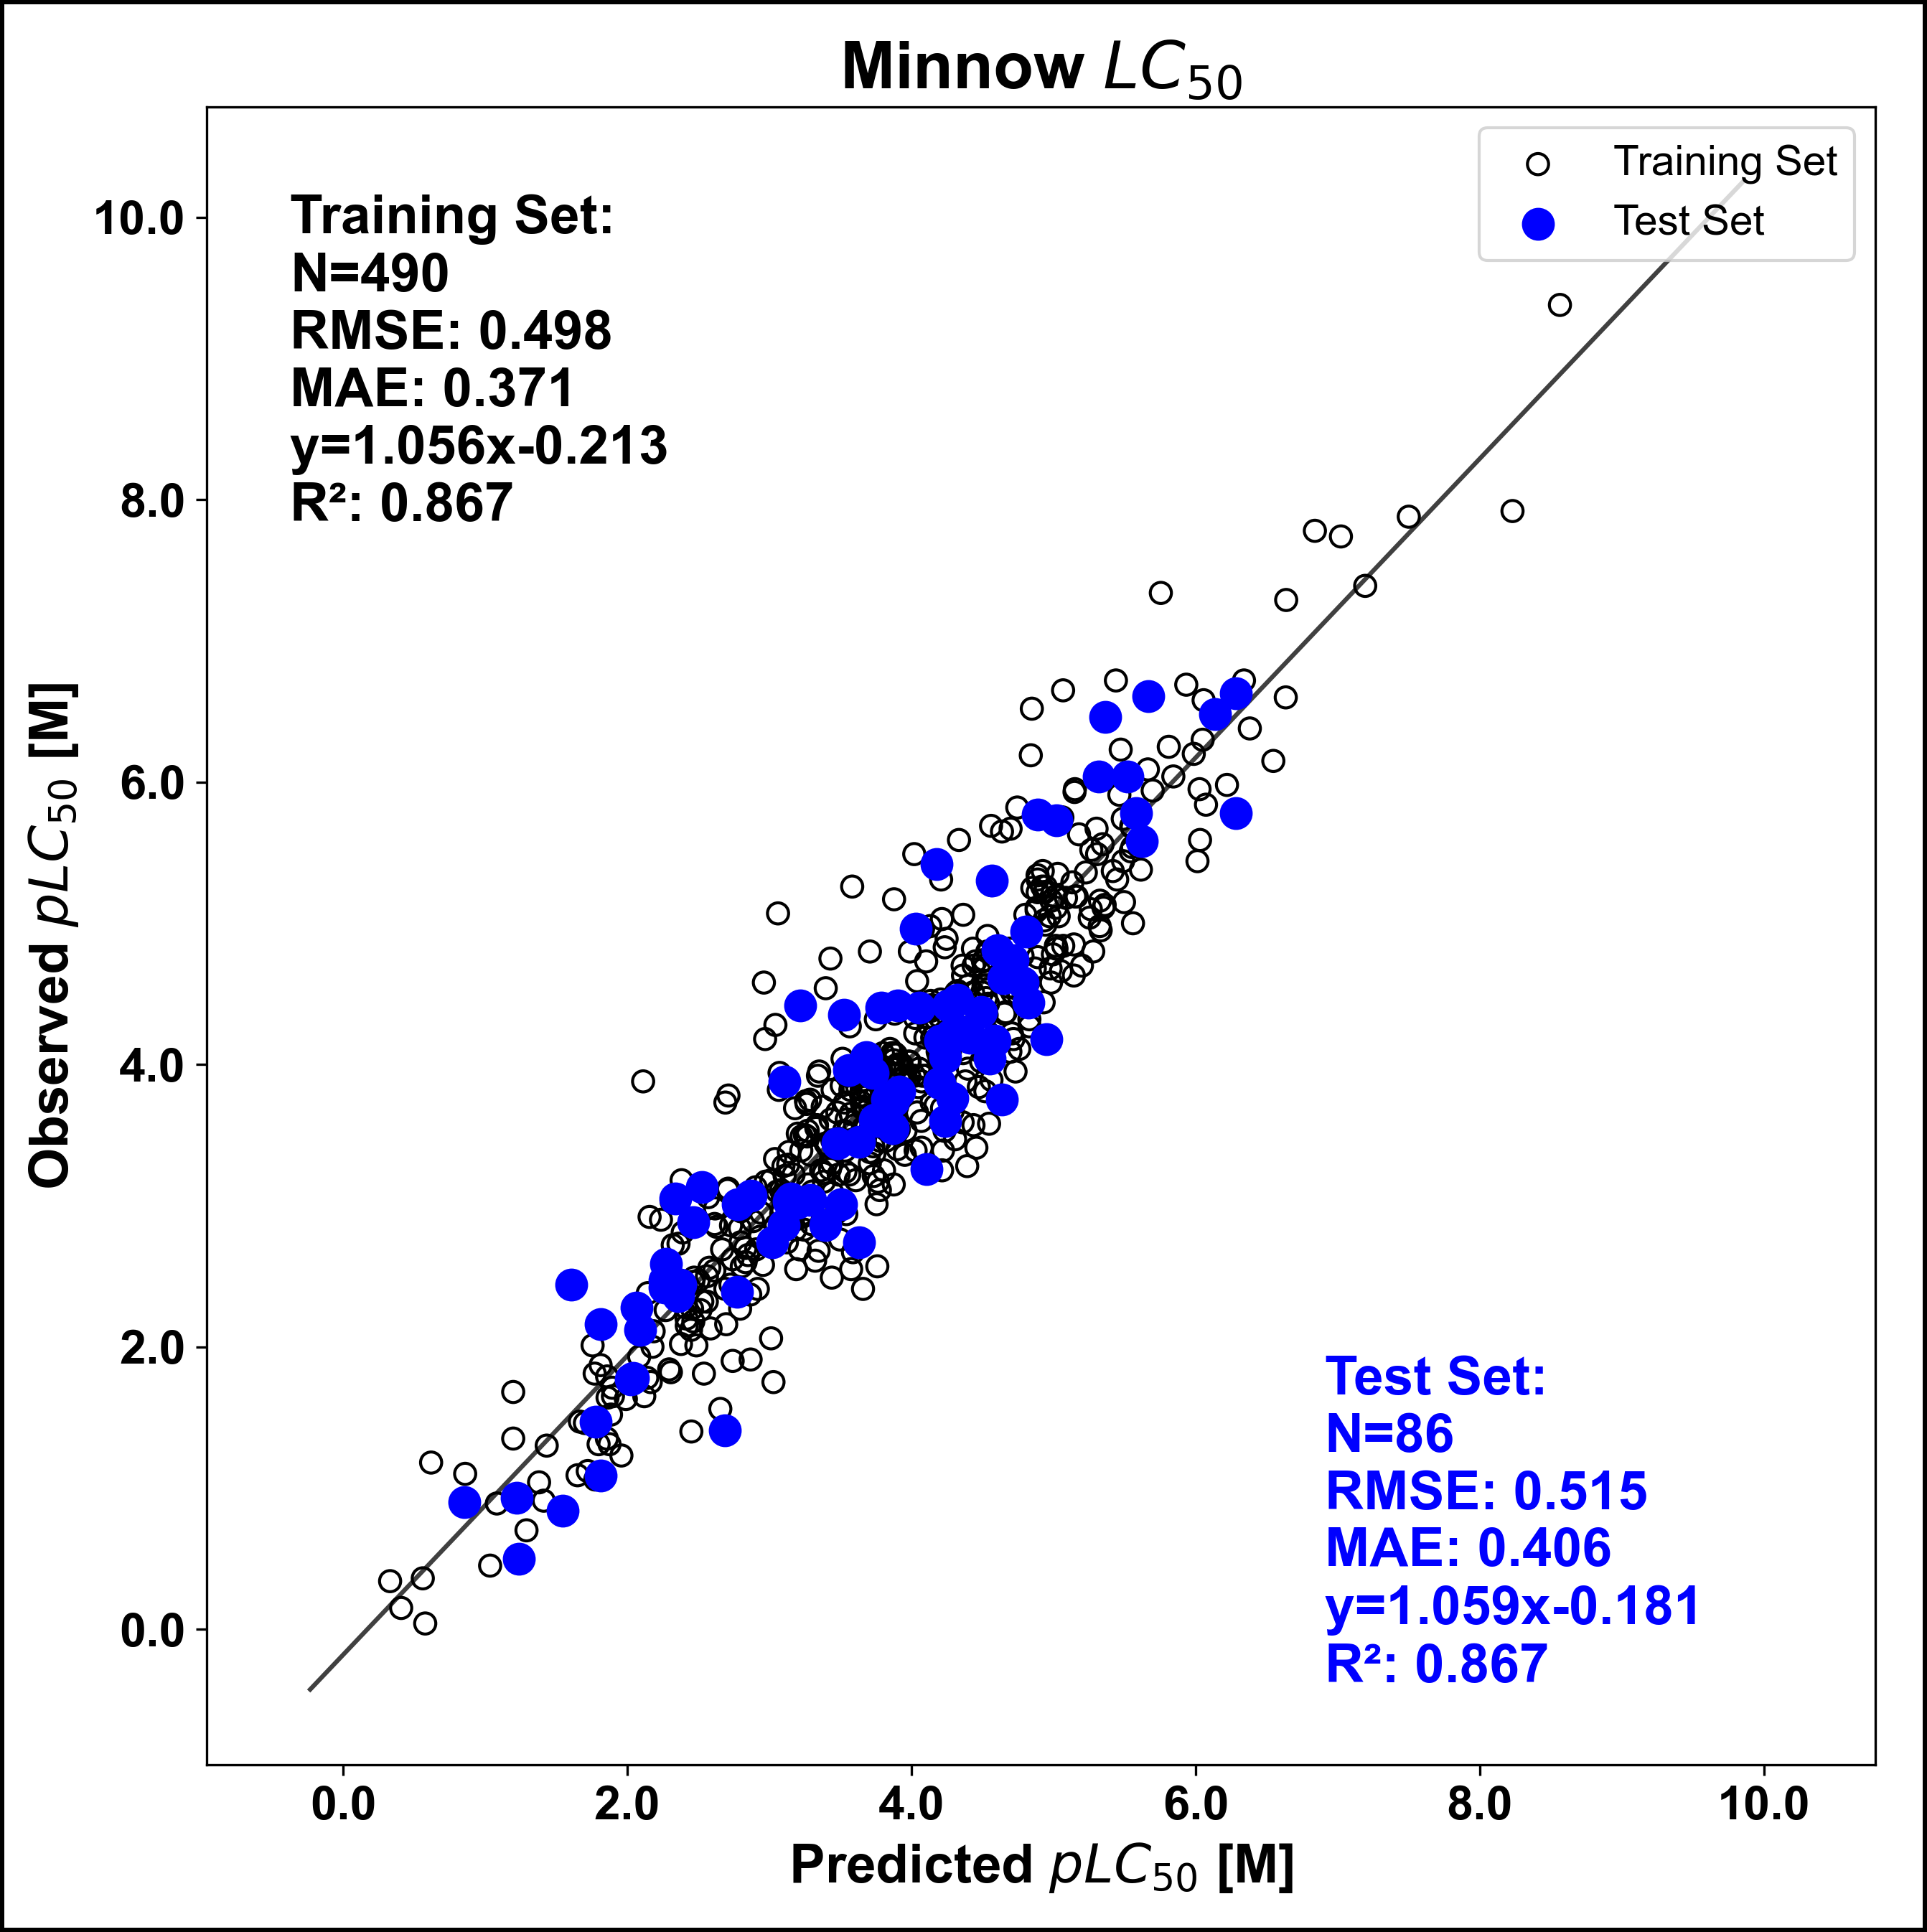
Most of the compounds assayed in the compounds included in the aquatic toxicity models (Bioconcn, Biodegradn, Th_pyr_pIGC50, Daphnia_LC50 and Minnow_LC50) are large-volume production chemicals where environmental exposure is a concern. As a result, they include many phenols and anilines. Coverage of the drug-like structural and property space, on the other hand, is somewhat limited. That said, compounds that do fall within model scopes (i.e., those whose predictions are not highlighted in the spreadsheet in red or by being underlined) should generally be predicted quite accurately, however, as can be seen by the model performance plots below. This is less of a concern for the endocrine disruption models. They contain many more drug-like molecules than the aquatic toxicity models do because of extensive pharmaceutical efforts to develop antiestrogens and antiandrogens for treating breast and prostate cancer.
The aquatic toxicity models are built on a log molar (M) concentration basis to match the way our descriptors are calculated, but most outputs are transformed to the linear mg/L (ppm) scale more typical of US regulatory applications. The exception is [Th_pyr_pIGC50] for Tetrahymena, which is left on a cologarithmic scale (pIGC50).
Bioconcentration
The bioconcentration factor (BCF) is defined as the ratio of the chemical concentration in biota to that in water at steady state, as a result of absorption via respiratory surfaces (Hamelink 1977). Environmentally, the BCF describes the accumulation of pollutants partitioning from the aqueous phase into an organic phase (typically fish) and does not include uptake due to diet. The BCF has no units, as seen by the equation below:
Here, the ‘BCF’ and ‘steady-state BCF’ are synonymous with the steady-state reached once the fish has been exposed for long enough that the ratio does not change substantially thereafter.
Environmentally, there may be concern if a substantial amount of material is injected into the environment through dumping, spillage, production, etc. and the BCF is significantly greater than 1. The European Union’s REACH framework (Registration, Evaluation and Authorization of Chemicals) indicates that BCF measurements must be made for any chemical produced or imported in amounts exceeding 100 tons per year, as the BCF can be useful for classification and labeling, test prioritization, and safety assessment purposes. In particular it has been suggested that the BCF could be used in first tier risk assessment of secondary poisoning in wildlife and humans though dietary exposure. The OECD 305 guideline indicates that an appropriate incubation period for BCF testing is between 44 and 116 days.
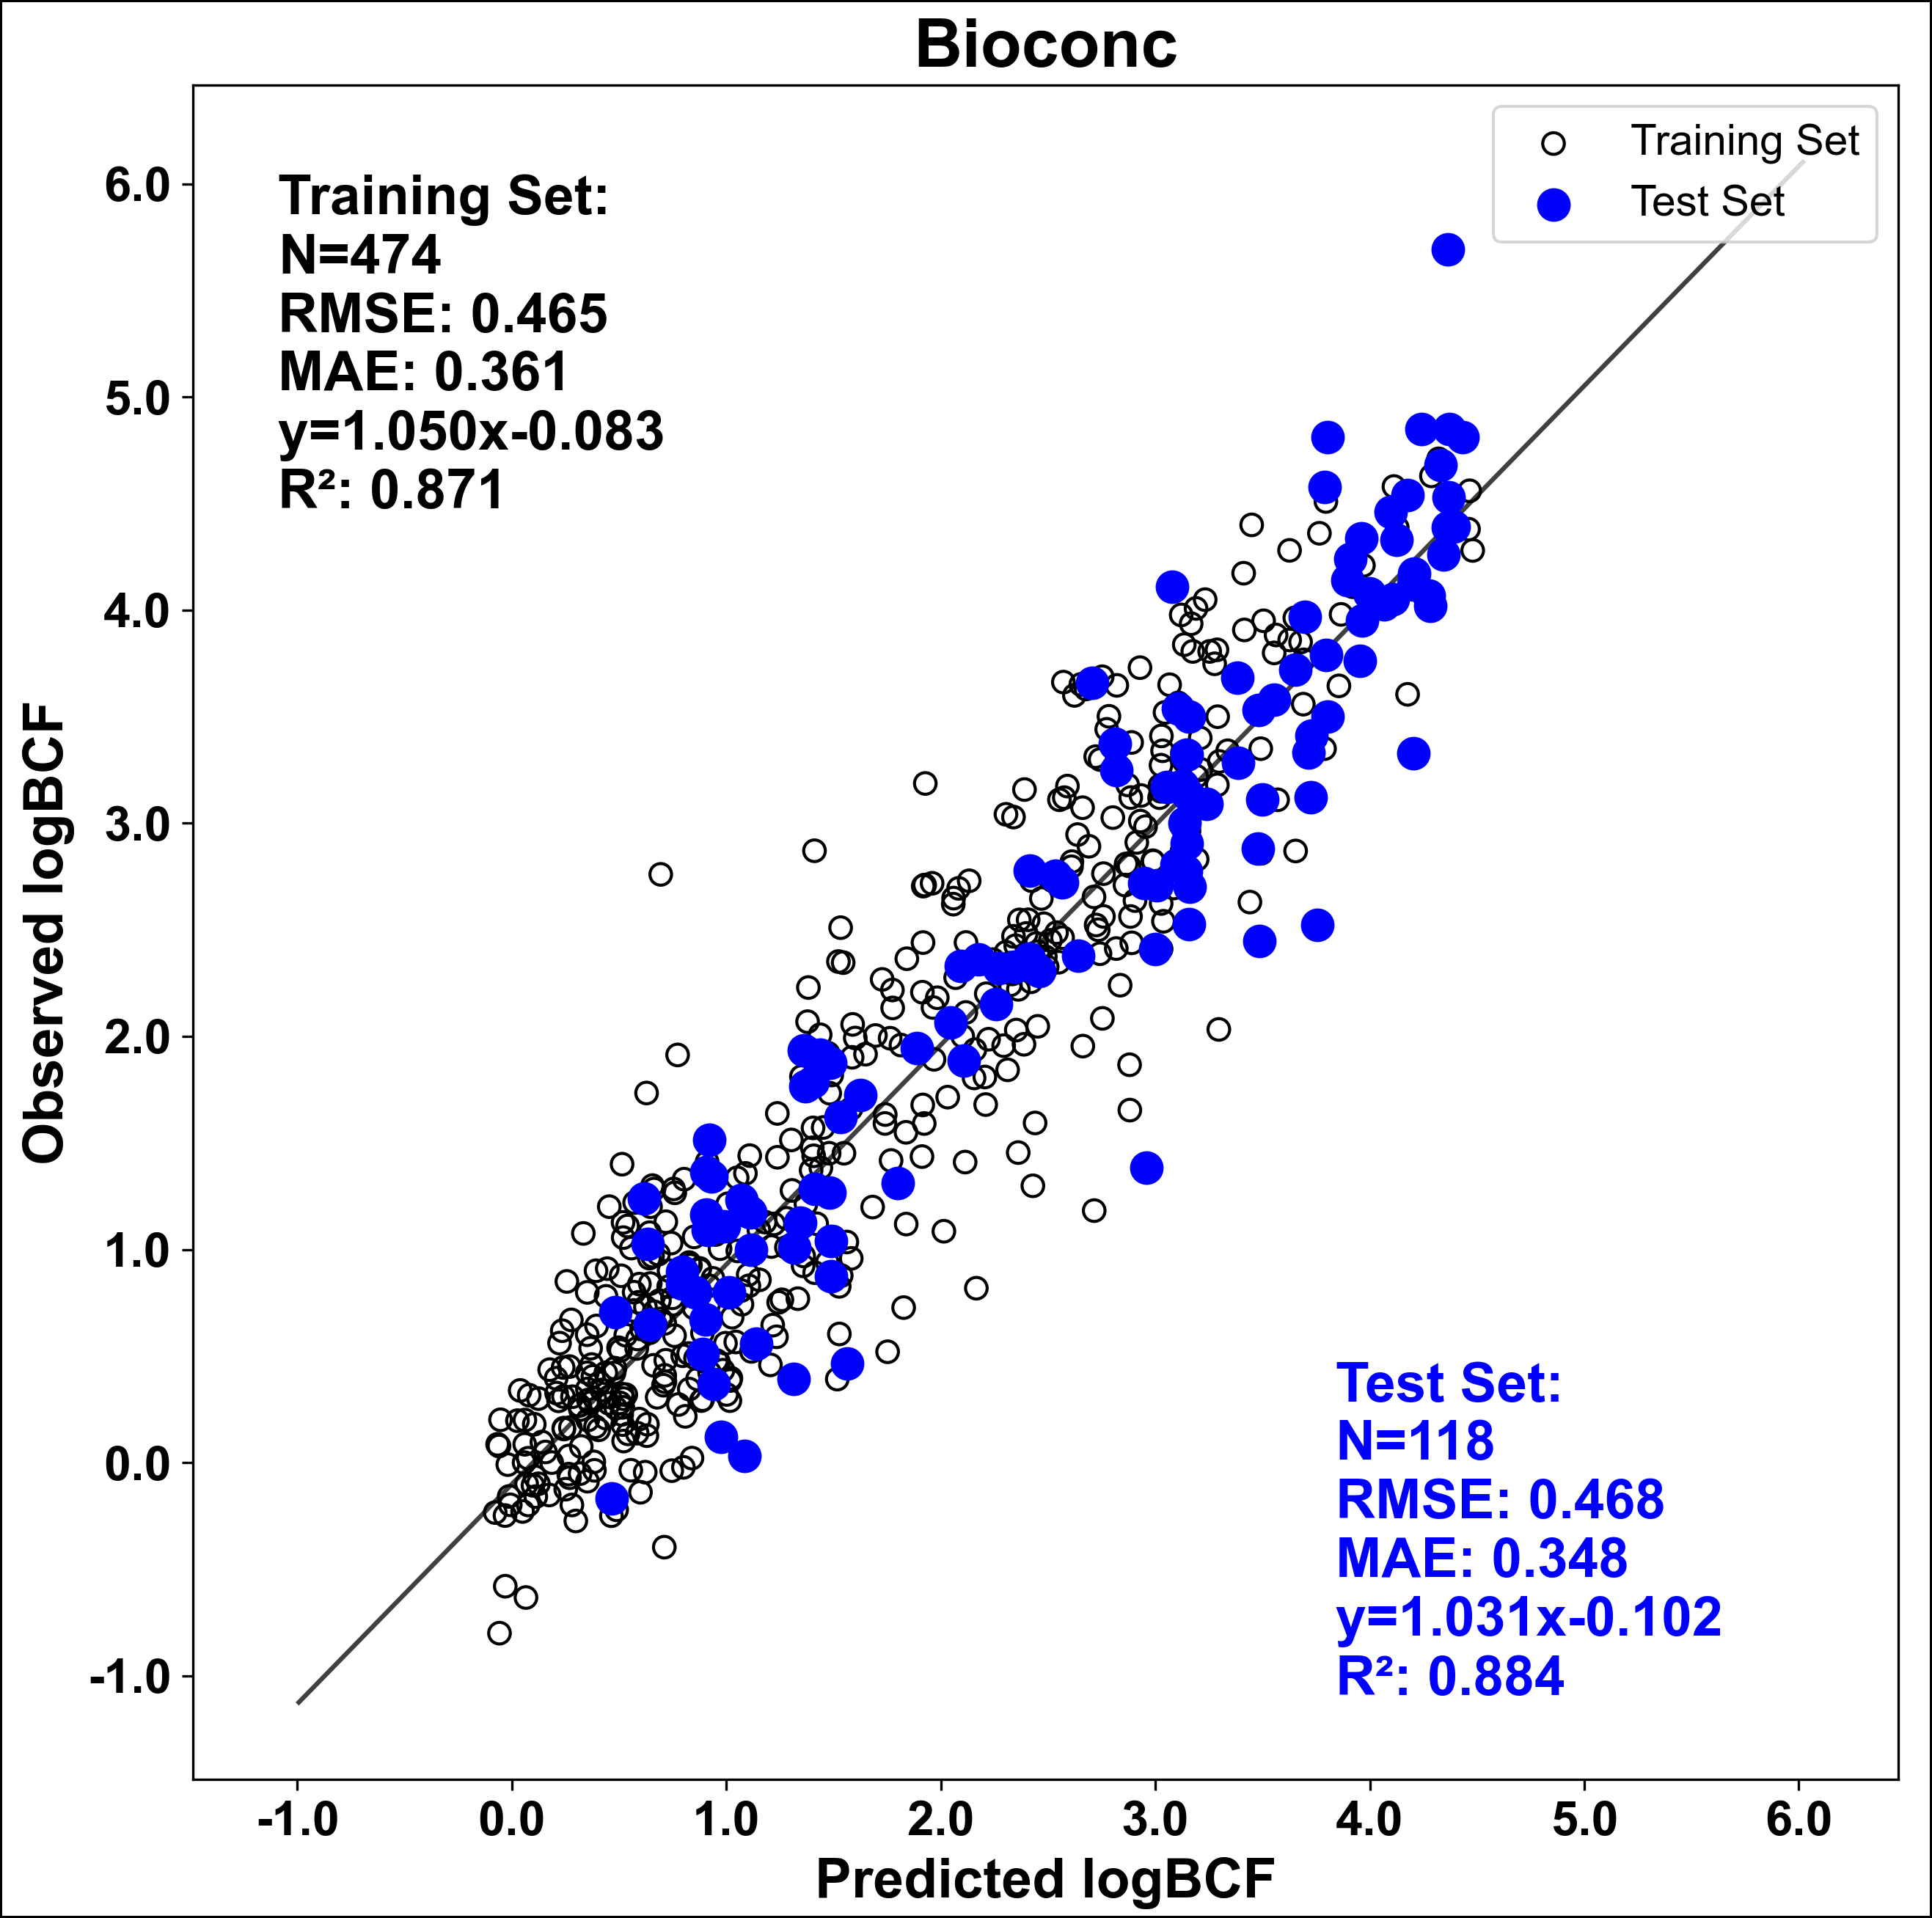
The Bioconcn model was built from a data set of 592 compounds with experimentally measured data points compiled from the open literature (Dimitrov 2005; Arnot 2006; Zhao 2008) and the EURAS database. Performance plots for the Bioconcn regression model are shown below. Note that values in the graph are in logarithmic space, reflecting the fact that the dependent variable was log transformed for model building. An antilog transform is applied to the model output so as to return a value in the original linear space.
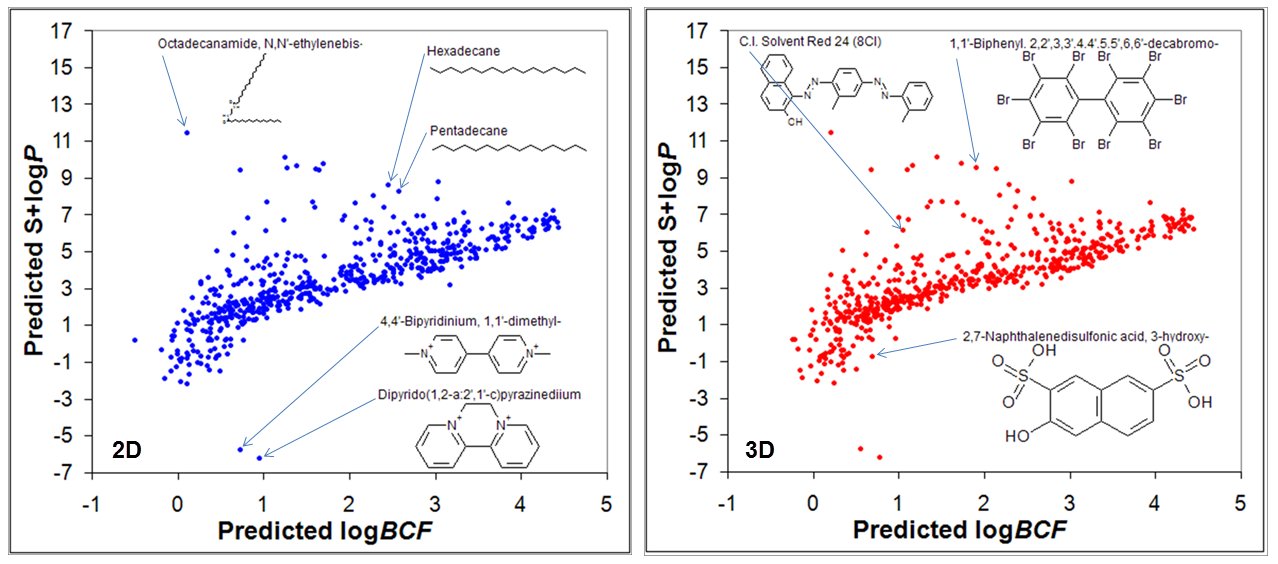
Compounds with high logP tend to bioaccumulate in fatty tissues. Hence substances having a low logP and a high logBCF, or vice versa, defy expectations and so may be of specific mechanistic interest. Examining the outliers indicates that a few kinds of molecules (long aliphatic chains, aromatic quaternary amines, polyaromatics, phosphates, and sulfates) appear to deviate from the strong logP vs. logBCF correlation at physiological pH (see below). Many polyaromatics and sulfates, by contrast, are found close to the best correlation line.
Biodegradation
Understanding biodegradation of chemicals in the environment is becoming increasingly important. There are several assays available to determine if a compound is biodegradable. (Cheng 2012) provided data and references for a set of 1604 compounds that have undergone either the Japanese MITI (14 day) or the OECD 301C (28 day). After removing all metal containing compounds and retaining only a single stereoisomer or tautomer of structurally redundant entries, 1581 compounds remained.
Under both protocols, the compound of interest is mixed with sludge from several different geographical locations, then oxygen consumption is measured for the specified period of time. Biological oxygen demand (BOD) and percent biodegradation are calculated from the following equations:
The percentage biodegradation is obtained from:
where ThOD represents the amount of oxygen consumed in converting all of the compound to carbon dioxide (CO2), i.e., the theoretical oxygen demand. A compound was categorized as a positive (readily biodegradable) if %biodegradation is greater than or equal to 60% and as a negative otherwise. The model returns a "Yes" or "No" answer to the question: is this compound readily biodegradable?
Approximately 20% of the 1581 compound data set was set aside as an external test set. The remaining 1264 compounds were used as the training pool from which a 12 descriptor, 8 neuron artificial neural network ensemble was built. The model's sensitivity and specificity exceeded 81% on both the training pool and external data set.
|
Model |
Set |
Negatives |
Positives |
Total |
Correct |
Concordance |
Sensitivity |
Specificity |
|---|---|---|---|---|---|---|---|---|
|
Biodegradn |
Training |
798 |
466 |
1264 |
1053 |
83.3% |
81.9% |
84.0% |
|
Test |
200 |
117 |
317 |
273 |
86.1% |
89.7% |
84.0% |
Protozoan growth inhibition
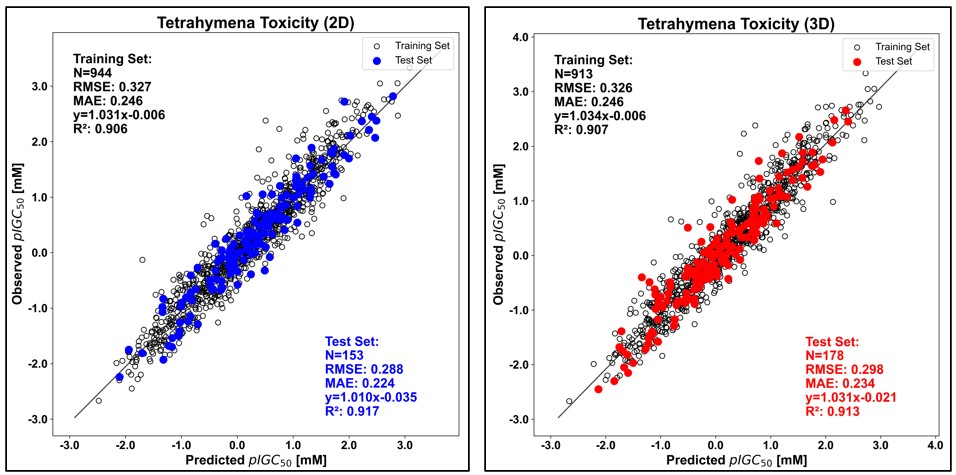
Prof. T.W. Schultz of the the College of Veterinary Medicine at the University of Tennessee has developed an extensive aquatic toxicity database for the effect of test compounds on Tetrahymena pyriformis growth (Schultz 1997). The assay measures the concentration of toxicant needed to inhibit growth by 50% (IGC50) in the protozoan after approximately 40 hours exposure (8-9 cell cycles in the control group) at 27° C. Publicly available data from this assay have been employed to assess various QSAR modeling approaches by Zhu et al. (2008) and by the Environmental Protection Agency (EPA). The performance of our models matched or exceeded the performance of theirs when the same test sets were used. We were able to improve performance further by using Kohonen mapping to partition the full data set into training, verification and test sets while maintaining a strict separation of the test set from the model building process.
The resulting 2D ANNE Th_pyr_pIGC50 model has an RMSE of 0.288 log units for the 153 compounds in the external test set, whereas the test set RMSE for the 3D ANNE model is 0.298 log units for 178 compounds.
Daphnia toxicity
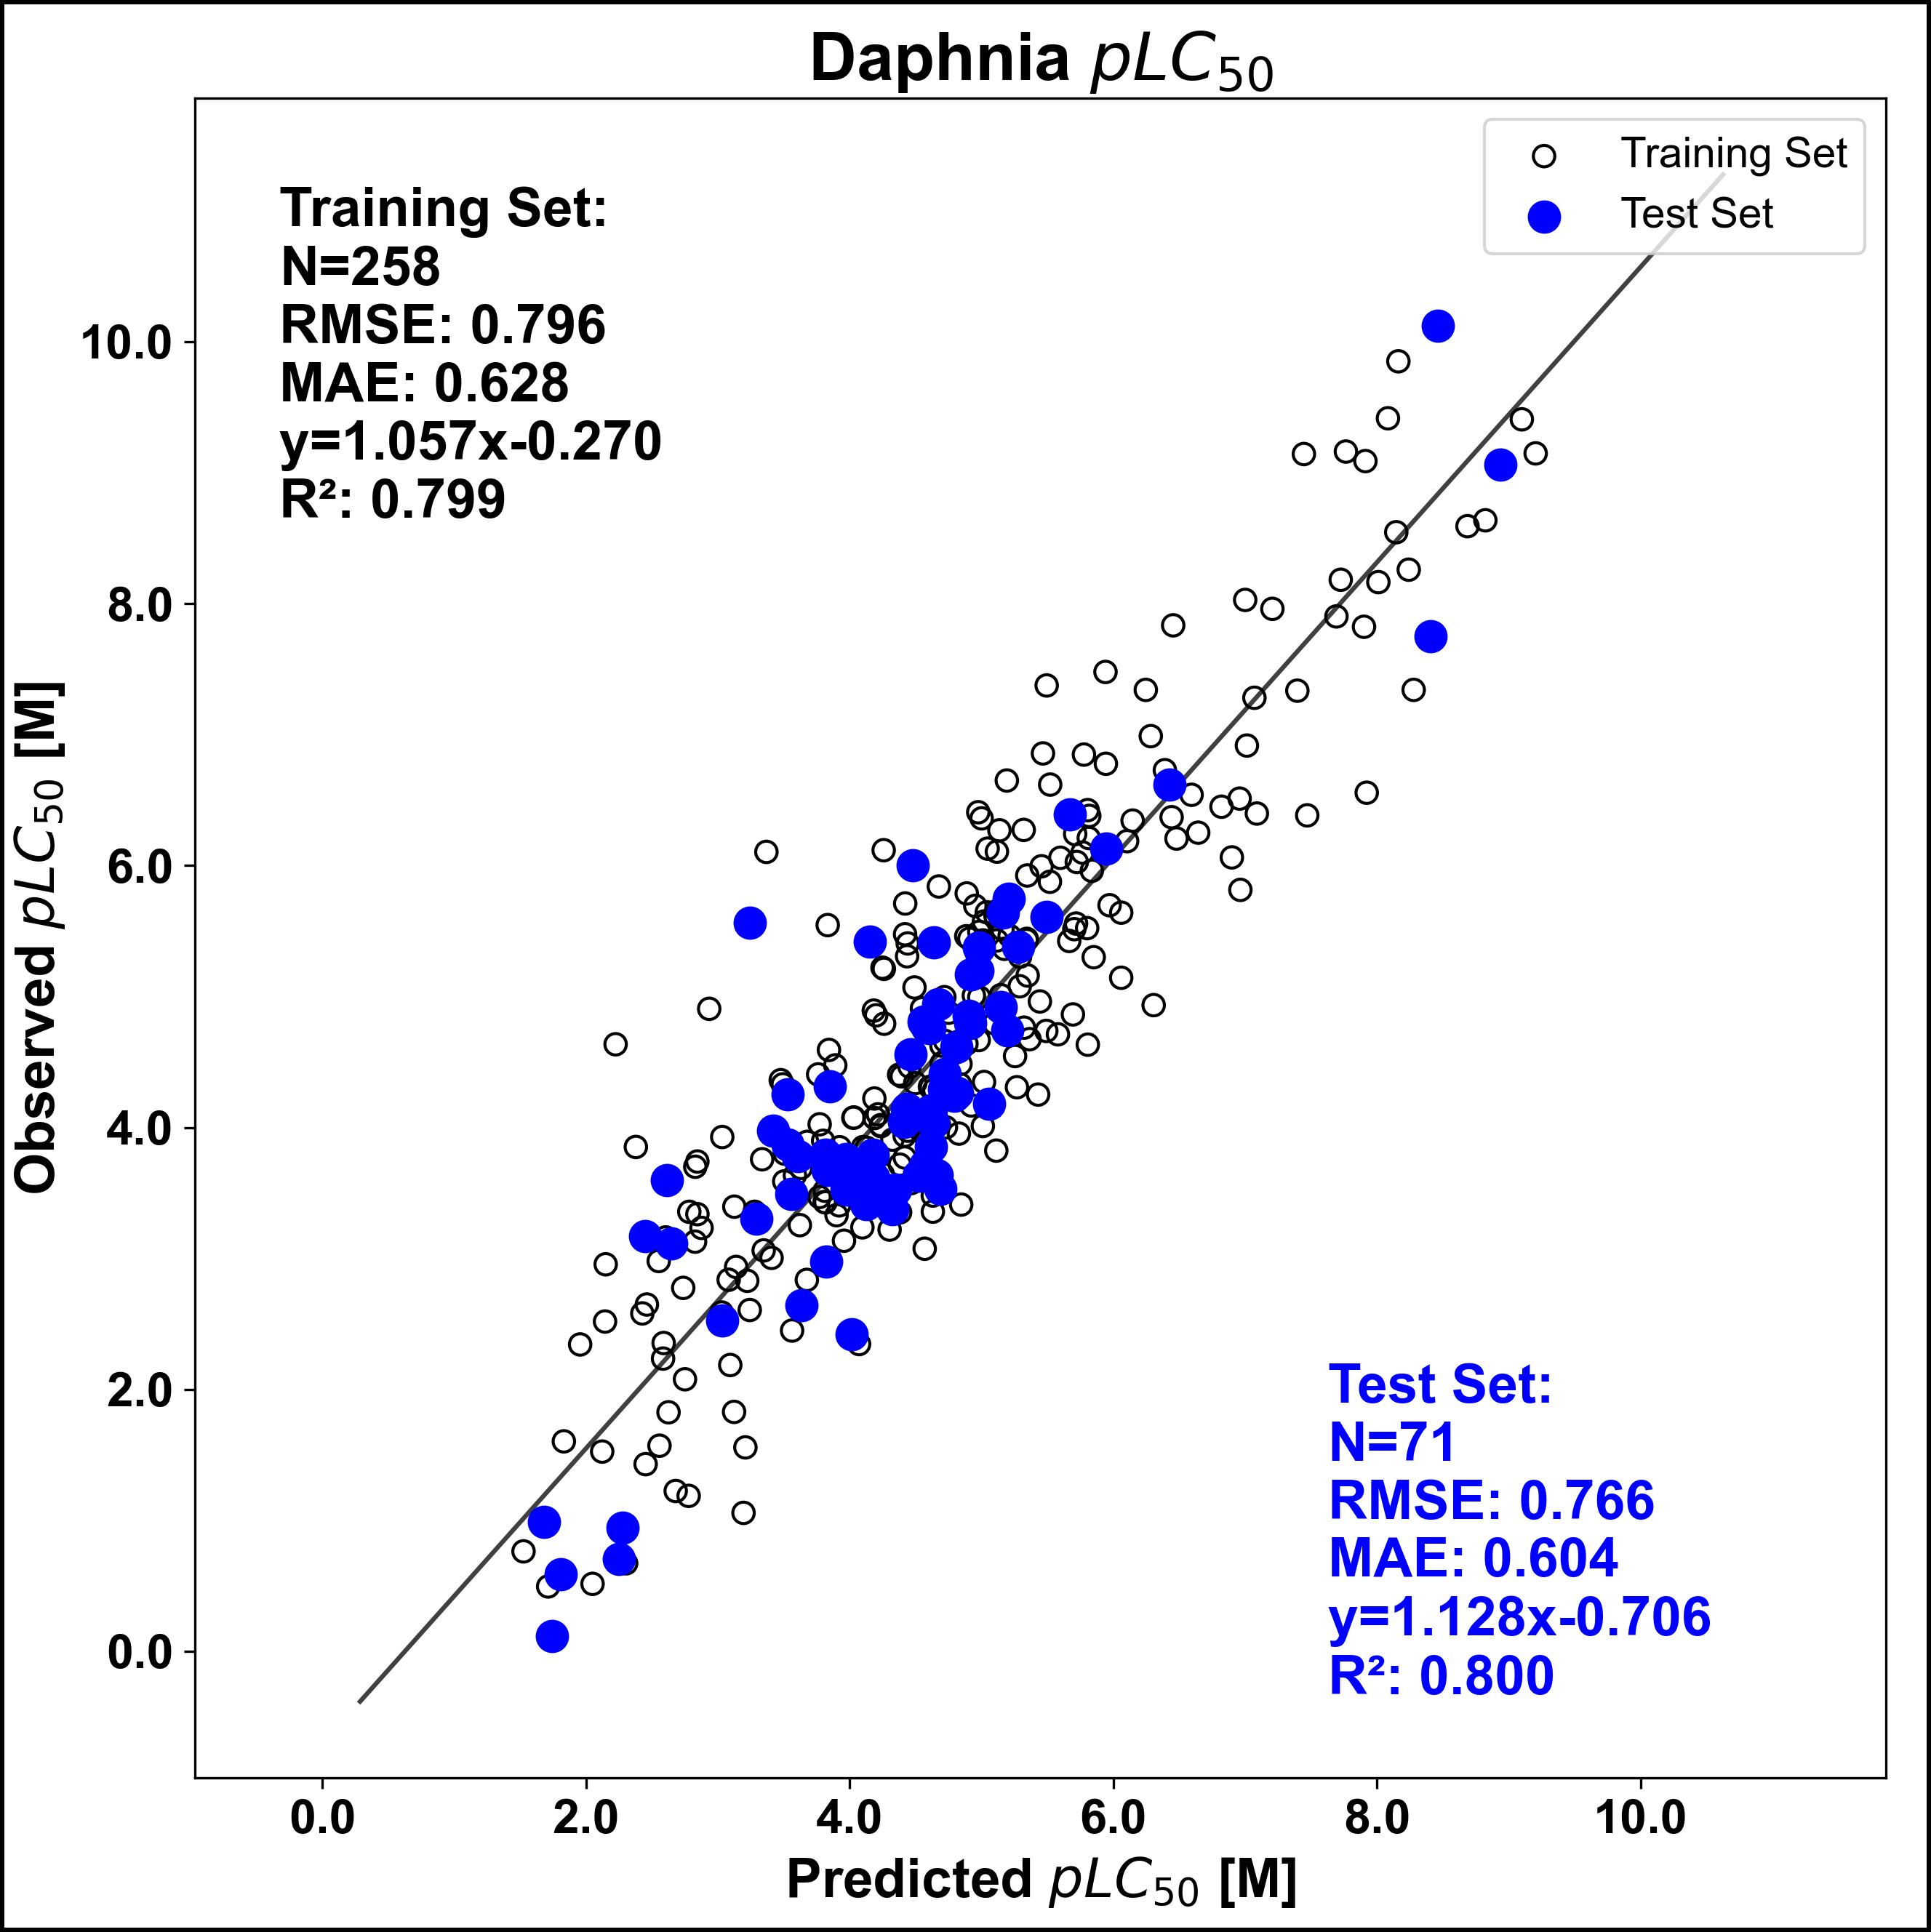
Water fleas (Daphnia magna) occupy the next rung up on the aquatic food chain from Tetrahymena. Daphnia_LC50 predicts the concentration of compound required to kill 50% of a D. magna population within 48 hours. The data for this study was obtained from the EPA’s ECOTOX database. Values in mg/L were converted to mol/L for model building for the 329 unique compounds used to model pLC50. The model output is rescaled and reported back in the more common regulatory units of mg/L.
It should be noted that approximately 10% of this data set was composed of pLC50 values derived from replicate measurements that varied by more than one log unit, which is not unusual for in vivo data obtained from different sources. The training/verify and test set both exhibit an RMSE below 0.80.
Fathead minnow toxicity
In 1995, the Mid-Continent Ecology Division of the US Environmental Protection Agency began testing industrial compounds for lethal effects on the fathead minnow (Pimephales promelas). The resulting database was used for internal efforts to develop a structure-activity relationship model and was also made available for public use under the EPA’s DSSTox program. This published data were the basis for training and validating ADMET Predictor’s fathead minnow acute toxicity model, Minnow_LC50.
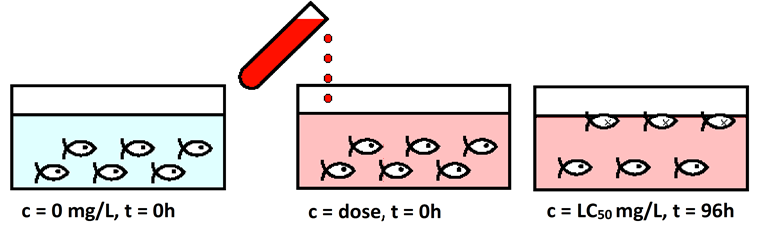
The experimental protocol used to determine the concentration of a compound that kills 50 percent of a population of minnows after an exposure time of 96 hours is illustrated schematically below.
The model is best applied to aromatic, amine-rich, halogenated, or non-polar compounds. There are relatively few pharmaceutical compounds in the training set for this model, but those molecules that do fall into within its applicability domain still have a high predictive confidence. The ANNE model yields an RMSE of 0.515 log units for the 86 compounds in the external test set. Note that though the model was created using pLC50 with units of log(mol/L), the prediction results in ADMET Predictor are returned in units of mg/L.