2.9.1. Mitochondrial Dysfunction
Three models, Mito_Tox, Mito_MEC, and Mito_AC50, were built using the available data. The Mito_Tox model is a classification model that predicts Yes or No for mitochondrial toxicity based on the Seahorse assay. The dataset contains 204 molecules with a large percentage (86%) of experimental positives. Thus, the dataset is highly skewed towards mitochondrial toxicants. The table below shows the statics for the model where 12% (25 compounds) are in the test set. There are only 4 negatives in the test set and the one that is mis predicted as a positive is fenclozic acid, which according to Wikipedia was withdrawn due to jaundice.
|
Model |
Set |
Negatives |
Positives |
Total |
Correct |
Concordance |
Sensitivity |
Specificity |
|---|---|---|---|---|---|---|---|---|
|
Mito_Tox |
Training |
25 |
154 |
179 |
155 |
86.6% |
85.7% |
92.0% |
|
Test |
4 |
21 |
25 |
20 |
80.0% |
81.0% |
75.0% |
The Mito_MEC and Mito_AC50 models predict the minimum effective concentration (MEC) that significantly crosses the control vehicle threshold and the concentration at which 50% maximum effect is observed (AC50), respectively. The graph below illustrates the MEC and AC50 values for an electron transport chain (ETC) inhibitor where complete inhibition is assumed at high concentrations. OCR is the oxygen consumption rate ratio of control, and Conc is the compound’s concentration in µM.
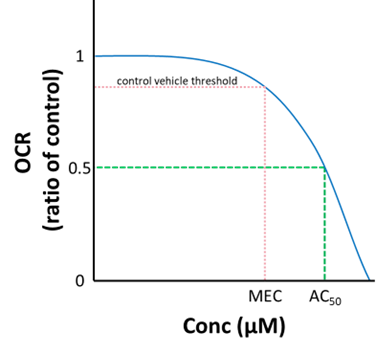
The plot above shows ETC inhibition with a complete knockdown of OCR at high concentrations. Other ETC inhibitors may exhibit a saturable effect on OCR whereby a decrease in OCR is observed but then OCR reaches a plateau and maintains that OCR as concentrations increase. In contrast to ETC inhibitors, mitochondrial uncouplers will induce increases in OCR.
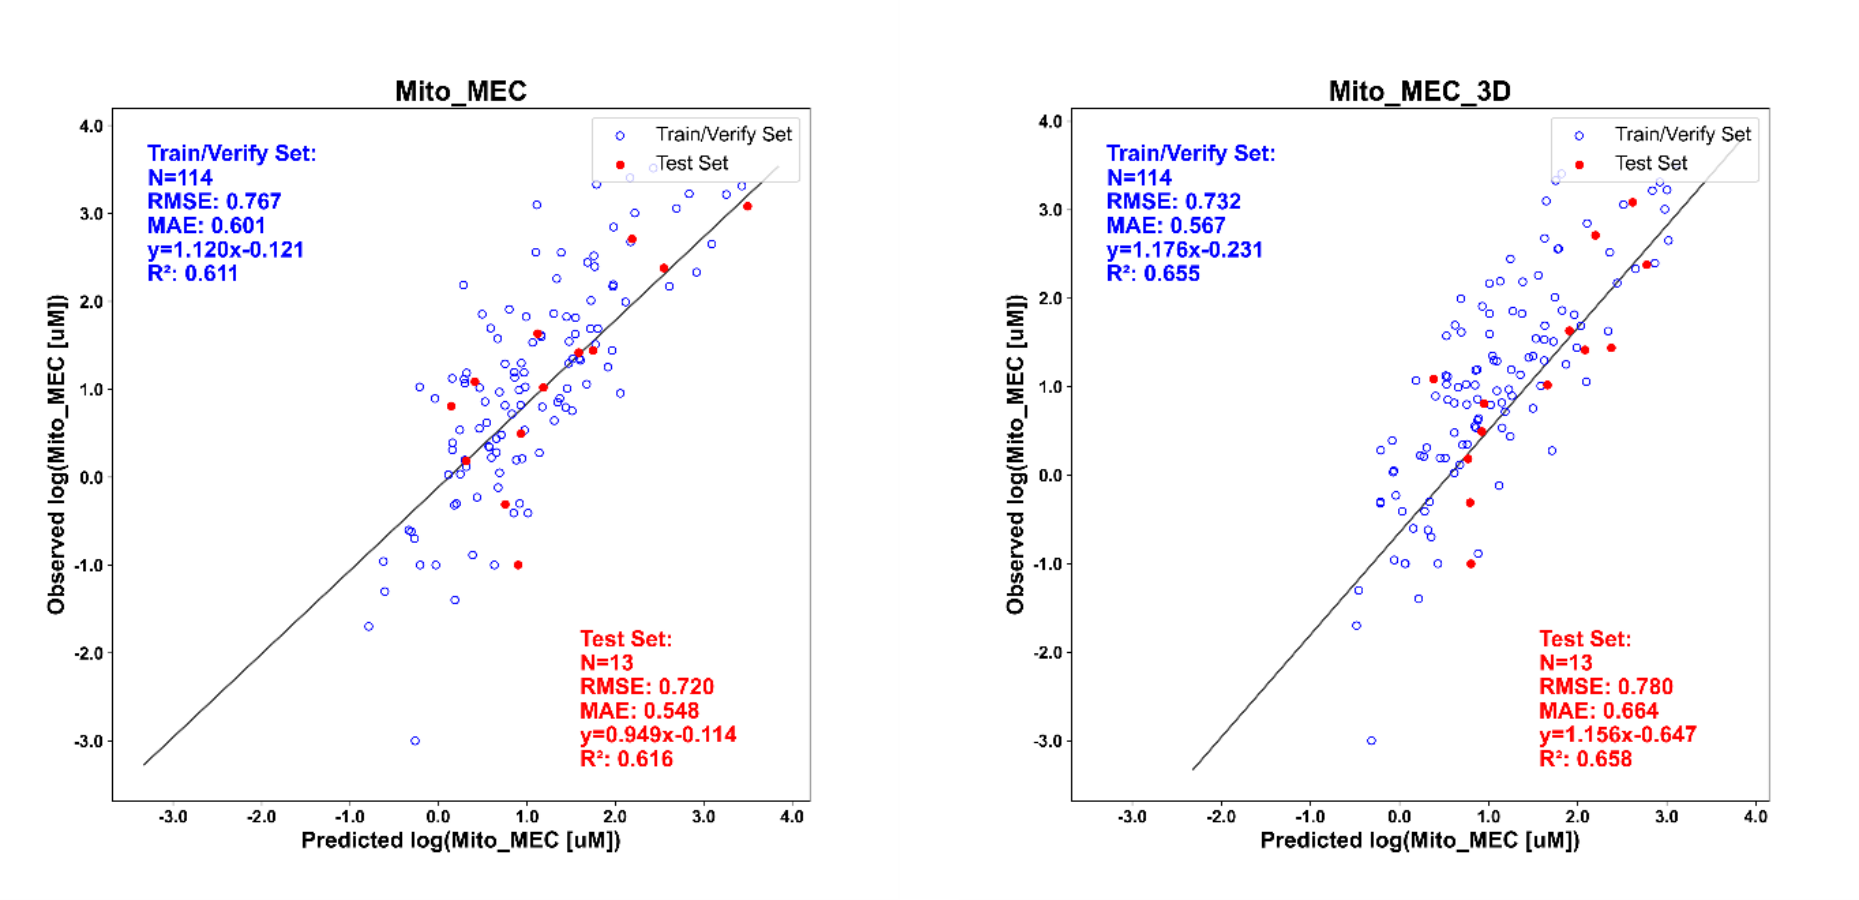
Models using 2D descriptors and 2D and 3D descriptors were created. The plots below show the log of the experimental Mito_MEC value in micromolar units (µM) versus the log of the predicted value. The dataset contains 127 compounds with 13 (~10%) in the test set. The most active compound is rotenone, with an observed MEC value of 0.001 µM.
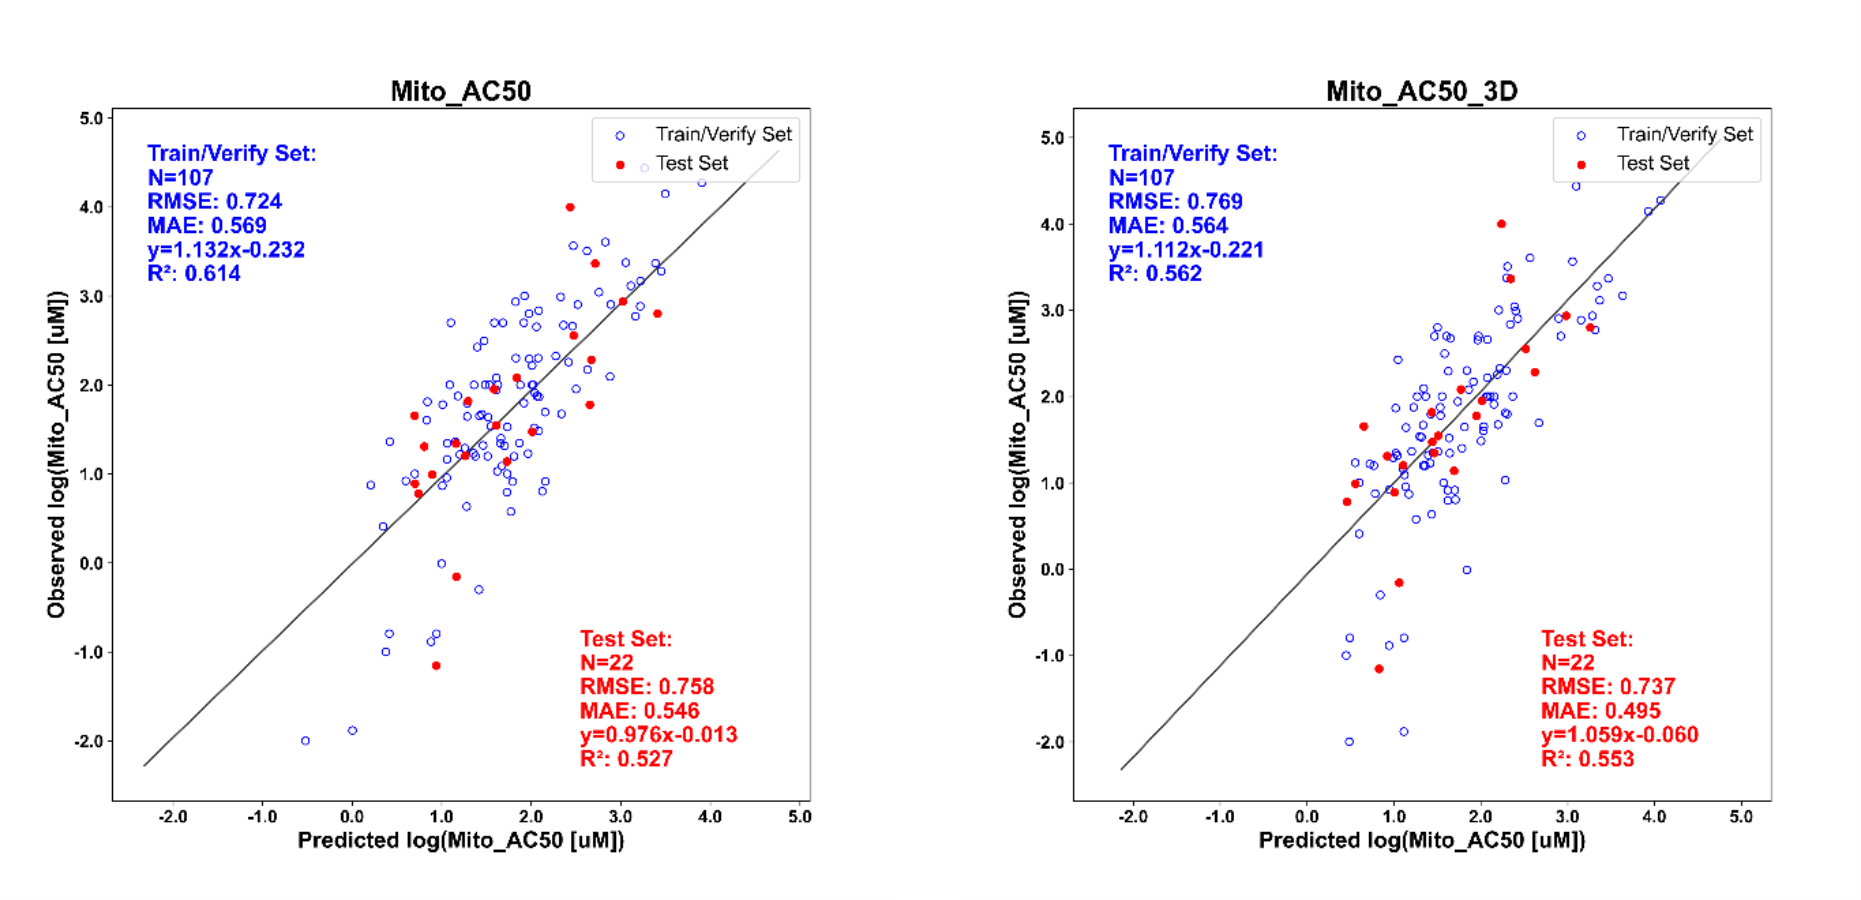
2D and 3D models were also created for the Mito_AC50 endpoint. The plots below show the log of the experimental Mito_AC50 value in micromolar units versus the log of the predicted value. The dataset contains 129 compounds with 22 (17%) in the test set. The two most active compounds are antimycin A (Mito_AC50=0.01 µM) and rotenone (Mito_AC50=0.013 µM).