2.9.2. Reactive Oxygen Species
The reactive oxygen species models mirror the mitochondria models in that there are ROS_Tox, ROS_MEC, and ROS_AC50 models. The statistics for the ROS_Tox model are shown in the table below. The dataset contains 243 compounds with 25 (~10%) in the test set.
|
Model |
Set |
Negatives |
Positives |
Total |
Correct |
Concordance |
Sensitivity |
Specificity |
|---|---|---|---|---|---|---|---|---|
|
Mito_Tox |
Training |
70 |
148 |
218 |
172 |
78.9% |
80.4% |
75.7% |
|
Test |
6 |
19 |
25 |
22 |
79.8% |
81.4% |
76.3% |
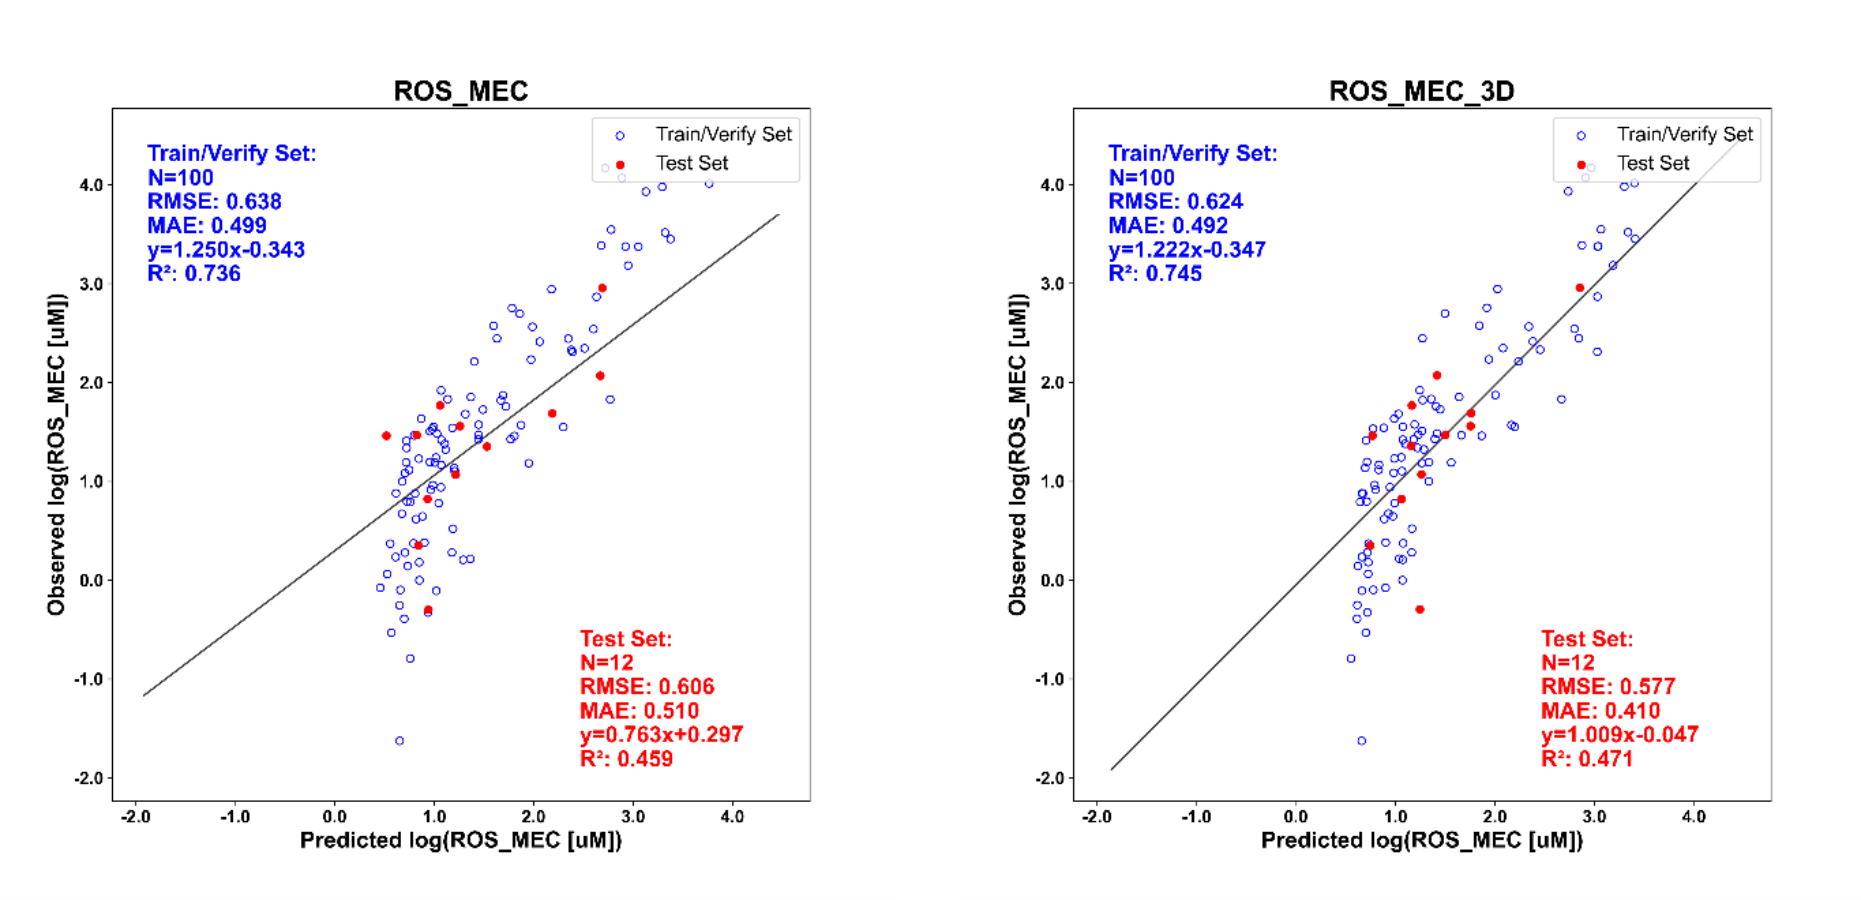
The plots below show the log of the experimental ROS_MEC value in micromolar units versus the log of the predicted value for the 2D model (left) and the 3D model (right). The dataset contains 112 compounds with 12 (~10%) in the test set. The most active compound is rotenone with a ROS_MEC value of 0.024 µM.
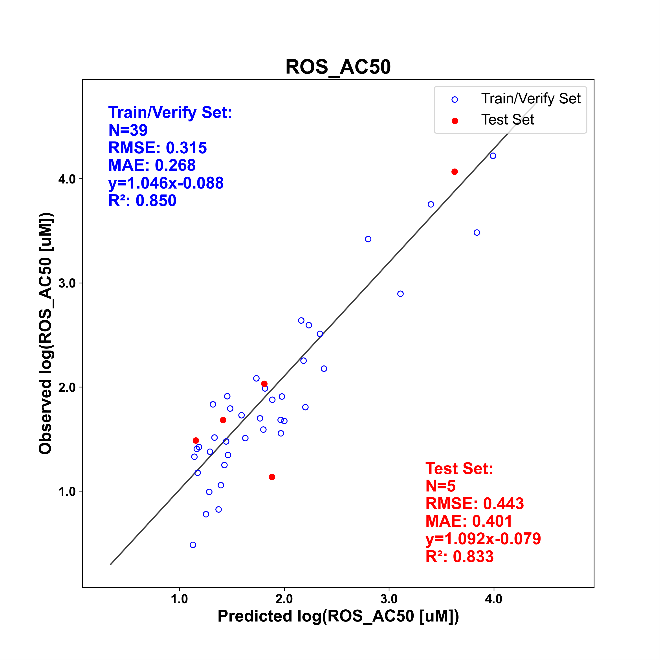
The plot below shows the log of the experimental ROS_AC50 value in micromolar units versus the log of the predicted value. The dataset contains 44 compounds with 5 (11%) in the test set.