

4.2.2. Data Spreadsheet
In the Classes tab, each row of data in the spreadsheet represents a group of molecules called a class. A class is allowed to contain any number of molecules, including only one. When an SD or SMILES file is first opened, every molecule in the file becomes a separate class containing exactly one molecule. Once the file is opened, you can group molecules together in a variety of ways, producing classes that contain any number of different molecules. Thus the Classes tab can operate both as a simple SD/SMILES-file browser, where molecules are viewed and manipulated individually in the spreadsheet, and as a clustering tool, where molecules can be flexibly combined to produce a simplified, organizational view of the data.
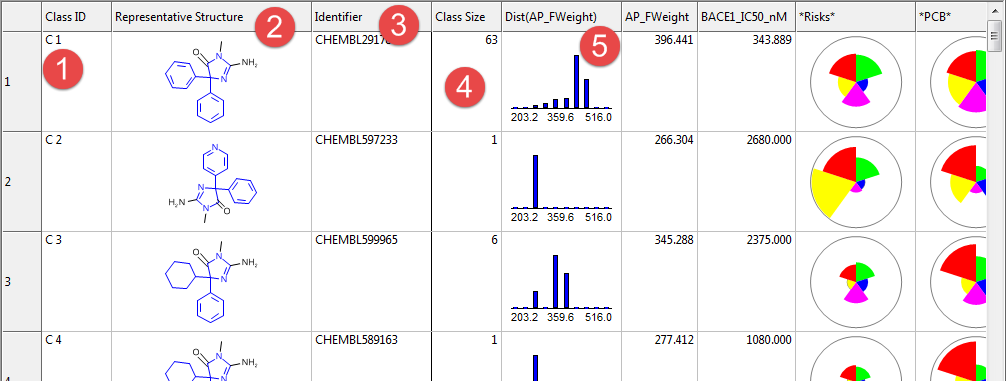
(1) Class ID. A text ID that identifies the class. When an SD or SMILES file is first opened, ID values are set to “S 1”, “S 2”, etc., to represent a list of singleton classes (classes containing a single molecule). Following class generation, ID values of non-singleton classes generally have the form “C 1”, “C 2”, etc.
(2) Representative Structure. A depiction of a representative molecule from the class. By default this is the molecule having the lowest molecular weight, but it can be changed to the molecule with highest/lowest activity or any other property of interest. The details can be found in CLASSES menu.
(3) Identifier. The name of the displayed molecule. If you have not specified molecule names, the name will be a unique integer ID.
(4) Class Size. The number of molecules contained within the class. Initially this will be equal to one.
(5) Dist(AP_FWeight). A graphical distribution of formula weight for molecules in the class. You can change the distribution to any numeric attribute loaded from the original data file. The easiest way to change the attribute is to right click the column header and choose Modify Plot from the context menu. This displays the following dialog:
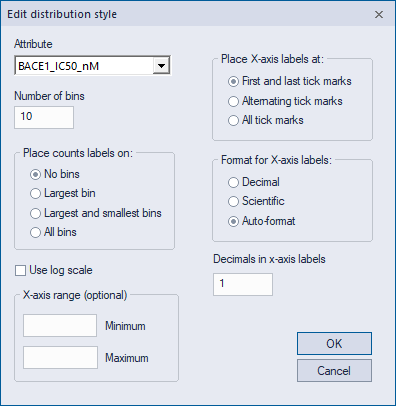
You can specify any attribute and can modify other options to change the distribution plots.
User-Defined Molecule Attribute. If the user has loaded molecule attributes, these attributes can be displayed in the Classes-tab spreadsheet. The default aggregation function for numeric attributes is the average, though users can change the function (also called an aggregation) from average to, for example, minimum or maximum. To change the function, right click on the column name and select the option "Set Function" from the context menu and select the function of interest.
User-Defined Class Attribute. Class attributes, described in subsequent sections, can also be displayed in the Classes-tab spreadsheet.