

3.2.5. Performance Grid
For ANNE models, the Model Performance Grid shows the performance profile across the range of regression or classification architectures explored based on the method settings you chose. For an ANNE regression model:
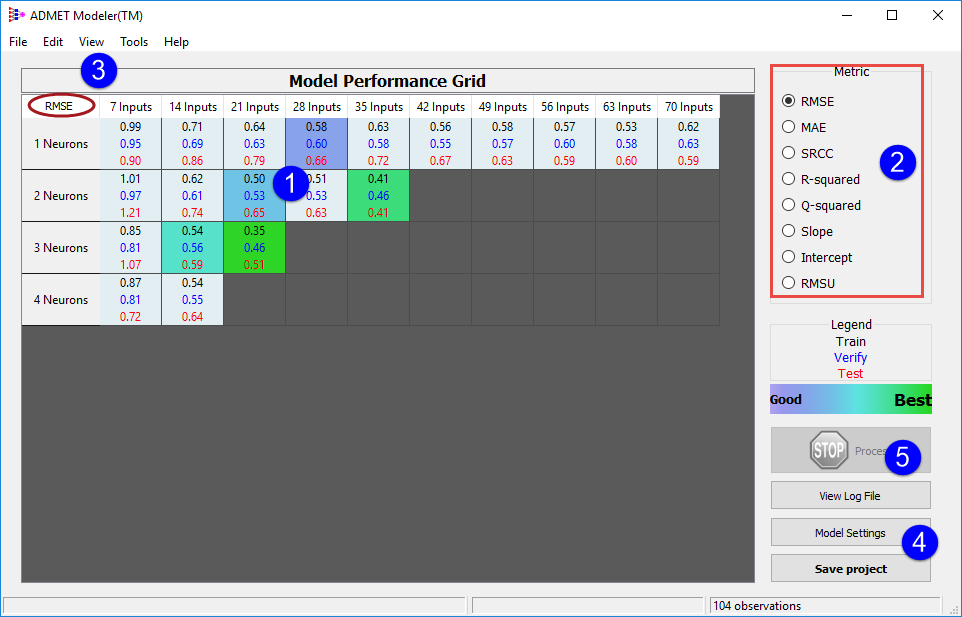
The cells in the grid (1) show the aggregate performance of all networks in the ensemble on three different groups of data points, the training set (black), the verification set (blue) and the test set (red).
The radio buttons at the top right corner of the dialog (2) control which performance metric is shown in the grid; your selection is shown at the top left corner (3) for reference in the event that you want to include an image of the grid in a document or presentation. For regression models, the choices are: root mean square error (RMSE); mean absolute error (MAE); the square of Pearson's correlation coefficient (R-squared); coefficient of determination (Q-squared); the Slope, and Intercept for the linear regression of the observed values on the predicted ones, and the root mean square uncertainty (RMSU). For classification models, the relevant metrics are Sensitivity; Specificity; Youden's index J (Youden); Matthews correlation coefficient (MCC); the minimum confidence value from the uncertainty profile (Min Confidence); and the fraction of incorrect predictions (FalseRate).
The Save project button (4) allows you to save the modeling project for later recall. If the model is not saved, it and the information used to build it - which is stored in the Temp folder in your Modeler application directory - may be overwritten or deleted.
The STOP Process button (5) is only enabled while the model building process is underway. Clicking on it will shut down model building; any incomplete models will be lost. The option is disabled once model building is complete.
Once model building ends, models will automatically be ranked and the best ones will be highlighted. Green indicates the "best" model and blue indicates the lowest ranked of those identified as "best." This example uses the default settings, which specify that five models be highlighted. The relevant parameters used can be accessed via [Tools >> Best Ensemble Settings]. The Min Confidence metric, which is only available for ANNE classification models, is not currently used for ranking ensembles.
RMSU metric
As of release AP-X, ADMET Modeler now builds an uncertainty model for regression models that make use of ensembles via the variance across the individual ensemble predictions. Thus, uncertainty models are built for ANNE, SVM, and KPLS models, but not MLR models. See the Theory Section for a detailed discussion of the approach used to build uncertainty models. The RMSU metric helps to assess the quality of the uncertainty model. It is analogous to RMSE except the calculation uses the estimated uncertainty for each model prediction instead of the observed error. Note that because the RMSU is based on the variance of the ensemble predictions, separate RMSU statistics are not calculated for the training and verify subsets of the training pool. The RMSU metrics shown are for the overall training pool and for the test set while the verify set statistic is omitted (shown with a "-" in the Performance Grid). Additionally (as explained in the Theory Section), the protocol for building an uncertainty model may result in an invalid uncertainty model (one in which the fitted parameters result in the uncertainty decreasing while ensemble variance increases, which is considered to be an invalid/unphysical model). In such cases, the uncertainty model is rejected for that particular model architecture, and all entries for that cell in the Performance Grid will be shown as "-". When loading old projects not possessing uncertainty models into ADMET Modeler, all entries in the grid will be shown as "-" when displaying the RMSU metric. This will also be the case in the unlikely scenario that all architectures of the grid fail to generate a valid uncertainty model.
The protocol used in building an uncertainty model usually results in the RMSU for the training set being very close to the training set RMSE. Thus, the similarity of the RMSU to the RMSE for the training set is generally not an informative indicator of the quality of the uncertainty model. However, the ability of the RMSU metric to closely approximate RMSE for the test set is one of several indicators of a good uncertainty model. It shows the mean squared uncertainty over a reasonably sized data set is a good estimate of the predictive model’s mean squared error over the same data set.
Min confidence metric
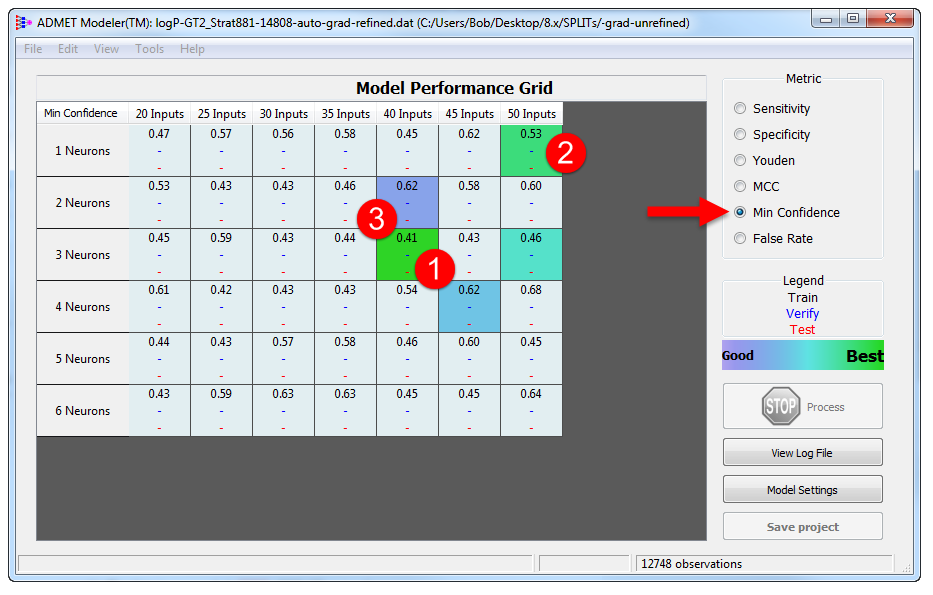
The Min Confidence metric provides an indication of the quality of the confidence model associated with each ensemble, thereby complementing the other classification quality metrics (e.g., Youden's index J), which relate to the ANNE model itself. It also provides an indication of whether that confidence model uses a "unified" beta binomial model fit to the pooled positive and negative errors or whether separate beta binomials have been fit to the positive and negative predictions - i.e., it is a "split" error confidence model. Which type of error model - unified or split - is chosen is based on which fits the observed uncertainty profile better. A Min Confidence below 0.5 is characteristic of a split confidence model, whereas one above 0.5 is typical of a unified confidence model.
Error model construction only uses training pool data, so only one value is displayed in each cell in the grid. A minimum confidence above 0.50 usually indicates that the associated error model uses a unified beta binomial, whereas a value below 0.50 is typically a split error model. This is illustrated below by the minimum confidence metrics seen for classification models built on 587 positives and 636 negatives with logP's greater than or less than 2.00, respectively. The error model for the top ranked ANNE (1) is split, whereas the error models for the second and fifth-ranked architectures (2 and 3, respectively) are unified (see the following section for details).
Displays for different model types
When displaying ANNE model results, the Model Performance Grid shows the overall performance for all ensemble architectures (number of descriptors and number of hidden neurons). Each entry represents the performance of all of the networks in the ensemble on three different groups of data points: the training set, verification set (when calculated separately) and test set. Empty cells indicate architectures where the number of weights exceeds the maximum specified in the Model Type Settings dialog.
When displaying KPLS model results, the Model Performance Grid shows the training, verification, and test set performances of the ensemble of KPLS models.
Separate verification set performance statistics are not shown in some cases. Data from SVM "verification sets," for example, are used in determining hyperparameters for the model and so are involved to a degree in model building. Similarly, the entire training pool is used to set final thresholds in averaging and when threshold refinement is applied in ANNE classification models. Verification statistics are not reported separately in these cases, and Train should be interpreted as "training pool" rather than "training set."
The MLR model generation process is completely determinate, so the training pool is not partitioned into test and verification sets. Hence only training and test performance statistics are presented.
Cell operations
Left-clicking on a cell (1) will bring up that ensemble's Performance Plot, whereas right clicking lets you begin the Model Export process.