

1.1.1. Basic Manipulations
Many of the interface features only become apparent once structures and data have been loaded into the program. The example below shows some of the molecules used to construct our model for cytochrome P450s-mediated intrinsic clearance in human liver microsomes (CYP_HLM_CLint). It only shows a small part of what the program can do, and is presented here primarily to motivate you to familiarize yourself with topics in this section that explore the available options in detail.
The structural and activity data were compiled as an SD file (.sdf) that was opened in ADMET Predictor, and ADMET properties for all compounds were calculated by clicking on the ADME icon (1). The 200 compounds with a formula weight above 500 were selected by clicking on EDIT >> Query By Structure/Property, then entering "AP_FWeight > 500" as the query in the Search using a query dialog. The keyboard shortcut Ctrl+Alt+H was then used to hide them. A second search for "logCLint > 2," launched this time via the Ctrl+Q keyboard shortcut, highlighted 227 of the 750 unhidden rows, as indicated in the status bar (2).
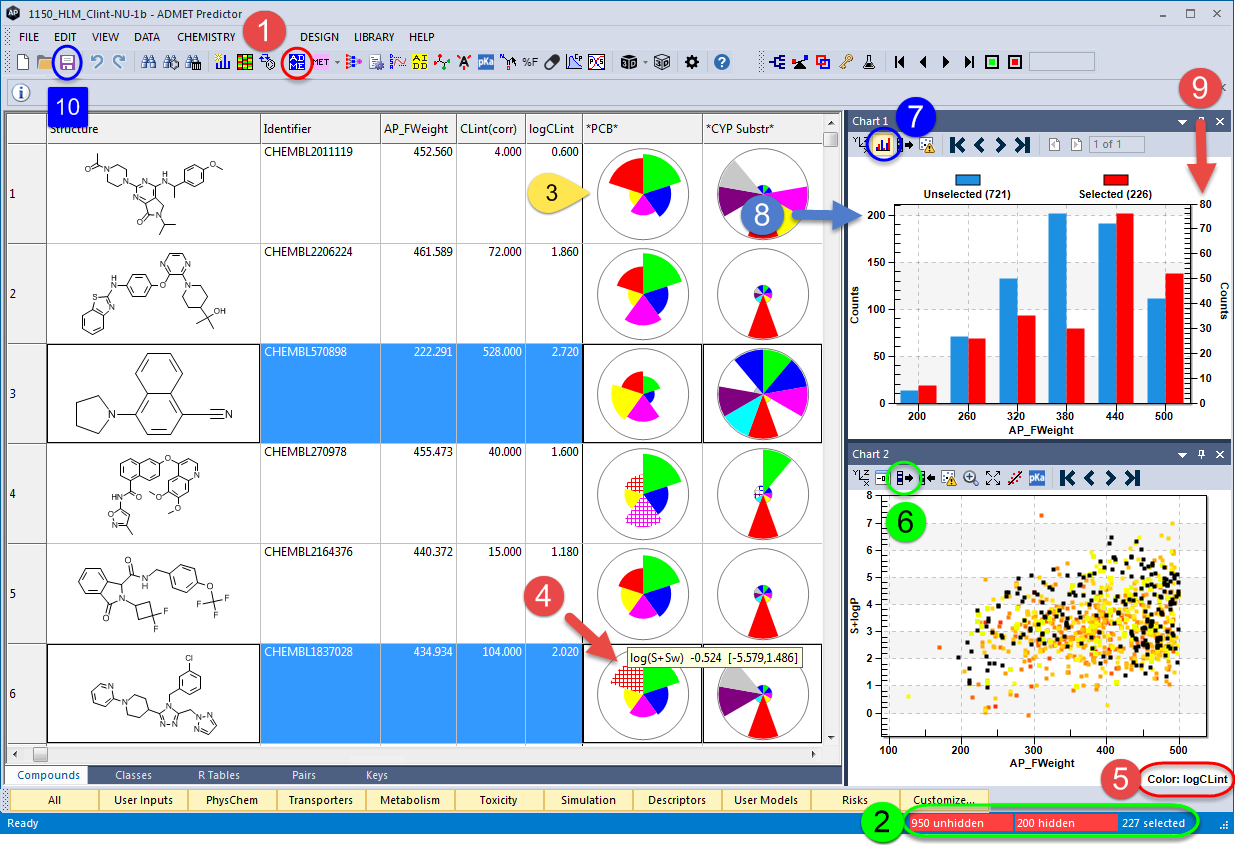
Most of the spreadsheet columns contain textual or numerical information, whereas the leftmost column displays the structure for each row and the right-most pair of columns shows star plots (3) that provide graphical summaries of predicted properties. Here, Physicochemical and Biopharmaceutical (*PCB*) and CYP substrate classification (*CYP Substr*) star plots are shown. Wedges representing out-of-scope predictions - i.e., those for compounds lying outside that model's applicability domain - are hatched (4). Hovering the mouse over this or any other star plot wedge will pop up a message indicating what the property is (here, water solubility S+Sw) along with that property's value and the minimum and maximum values accommodated by the star plot.
Any wedge extending out to the edge of the *CYP Substr* plot indicates that the compound in question is predicted to be a substrate of the corresponding enzyme. Short wedges indicate that the compound is not a substrate. In cases where the attribute displayed in the star plot is not well-defined, the small wedge is left uncolored to indicate that fact. CYP kinetic parameters, for example, are by default not predicted for compounds not predicted to be substrates, because there were of necessity no non-substrates in the training set.
Chart 1 shows a histogram of formula weights (AP_FWeight) for this data set, whereas Chart 2 shows the relationship between the predicted log P (S+logP) and formula weight, color coded by the literature logCLint (5). The points for the selected rows have been highlighted in black by clicking on the transfer icon (6) in Chart 2's toolbar, whereas clicking on the two-color icon 7 splits out the distribution of selected rows (red) from that of those rows that are not currently selected (blue), each with its own Y axis (8 and 9). These compounds were originally entered as single molecules, so the formula weight equals the molecular weight. Compounds can also be read in as salts or other mixtures (e.g., hydrates), in which case counter-ions and waters of hydration can be removed as the compounds are read in or after the fact. Exactly how this is handled is controlled through the Change applications settings dialog, which can be launched from the keyboard (Ctrl+Alt+P), from the menu bar (FILE >> Preferences...) or via the Settings icon on the toolbar (1).
The *CYP_Substr* star plot is made up of nine wedges. Moving clockwise from 1 o'clock, the wedges indicate that the compound represented by the corresponding row's structure is (long wedge) or is not (short wedge) predicted to be a substrate for CYP1A2, CYP2A6, CYP2B6, CYP2C19, CYP2C8, CYP2C9, CYP2D6, CYP2E1 or CYP3A4, respectively. Positioning the mouse over one of wedges pops up a notice of the model to which that wedge maps, the value it represents and the range of values for the predicted property across the spreadsheet; accessing these models requires a Metabolism license.
Moving clockwise from 2 o'clock, the five wedges in the second star chart column provide a graphical indication of the structure's molecular weight (MWt); the number of freely rotatable bonds it contains (N_FrRotB); its lipophilicity (S+logP); its human jejunal permeability (S+Peff); and the log of its solubility in water (log(S+Sw)). The first two are calculated molecular properties that are used as descriptors in some models. The latter three are predicted values from models included in the Physicochemical and Biopharmaceutical Module - hence the *PCB* in its column header.
Some of the top-level menus and icons on the toolbar require having a license to the MedChem Studio module. If your site does not have such a license or you opt to turn the display of these options off, they will not appear in the menu bar or on the toolbar.