

Confidence factor analysis (CFA) is a powerful tool for selecting robust classification models, especially when performance metrics like sensitivity and specificity are not definitive. Here we work through an illustrative example; the theory underlying the analysis is handled elsewhere.
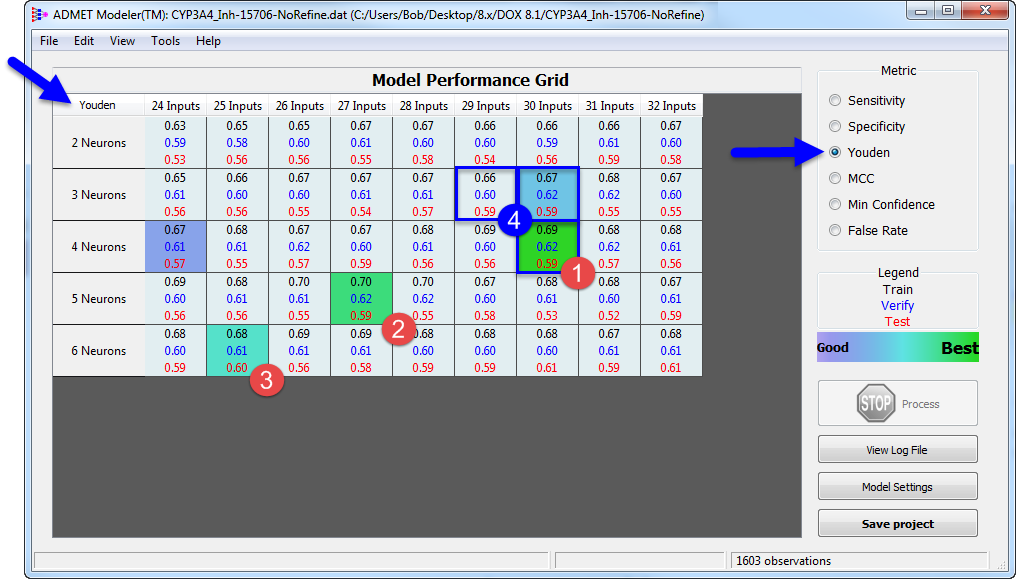
The performance grid for a CYP3A4 inhibitor classification model built on 1603 observations is shown below; it is the same example used to illustrate the split beta binomial CFA Performance Plot in the previous section. The resolution is step increments of 1 for both inputs and neurons, a common level of resolution at the final stage of model development. Earlier analyses at bigger step increments across a larger range of architectures had identified this as a promising part of the grid to focus on. The relatively narrow range of architectures accounts for the fact that the performance statistics are broadly similar across the grid. As expected, however, it is still evident that training set performance tends to be poorest for the simplest models (top left) and best for the most complex models (bottom right).
The ensemble selection tool highlighted the model with 30 inputs and 4 neurons (the 30x4 ensemble architecture; 1) as having the best overall performance, followed by the 27x5 (2) and 25x6 (3) ensembles. This pattern is fairly typical as far as test set performance is concerned, in that there is often a "band" of good models running from the lower left corner (fewer inputs but more neurons) to the upper right (more inputs, fewer neurons). More descriptors generally imply a narrower applicability domain, so otherwise comparable models with fewer inputs usually have larger applicability domains and are to be preferred. In this case, this favors the 25x6 model (3).
The 29x3 and 30x3 ensembles (4) "adjacent" to (1) are not among the three best, but they still have respectable Youden indexes - which is the performance metric selected for display, as indicated by the blue arrows. Indeed, the test set Youden indexes are the same as for the slightly more complex 30x5 model. The sensitivities are quite high as well (not shown).
Performance Plots for the three best models are shown below, numbered as in the grid above. They differ in several small ways, but there is a best choice.
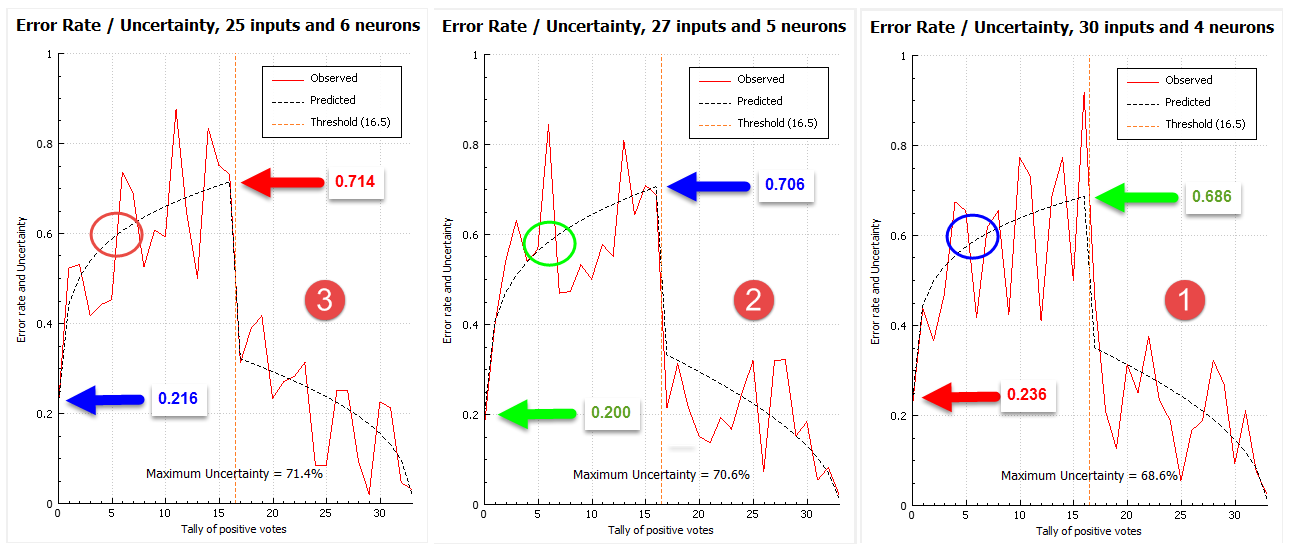
The highest (worst) maximum uncertainty (0.714) is seen for the 25x6 model (3) at left. The corresponding cell entry when the minimum confidence metric is displayed in the grid is 1 - 0.71 = 0.29. The lowest (best) maximum uncertainty among the three profiles is seen for the 30x4 model (1) at right.
The negatives are the smaller class in this data set - only 482 out of the 1607 total. The minimum uncertainty in negative predictions is the point where the predicted profile intersects the Y axis. The differences among the intersections are small but can be determined precisely by hovering the cursor over the point of intersection with the Y axis. Here, the 27x5 model in the middle (2) has the best value (0.200) by this criterion. Moreover, the area of the predicted curve between 0 and 5 positive votes is lower for this model, as can be seen by where the respective curves lie with respect to the circled (tally = 5, uncertainty =0.60) grid points. Again, the difference is small but definite.
Most networks in a reasonably good model will agree most of the time. Hence many more predictions fall at the extremes the of the vote tallies - here, 0 and 33 - than in the range of tallies bracketing the decision threshold at 16.5 (see the section on Confidence Analysis theory). The lower uncertainty in negative predictions between 0 and 5 positive votes seen for the 27x5 model (2) will affect many more predictions than will the higher maximum uncertainty at the threshold, making it preferable to the 30x4 model (1), despite the latter's higher ranking on the other performance metrics.
The 27x5 model does have fewer descriptors than the 30x4 model, but the applicability domain is essentially the same: coverage for the 2270 compound WDI reference set that we use for calibrating ADMET Risks is 99.2% for both, vs 99.9% for the 25x6 model.