

1.12.6. Docking Charts
As described elsewhere, charts in the main interface can be moved to new locations. To do so, click on the dark blue title bar at the top of the chart and move the mouse while holding down the left mouse button. Available "anchoring" positions for the plot will be displayed, as illustrated below.
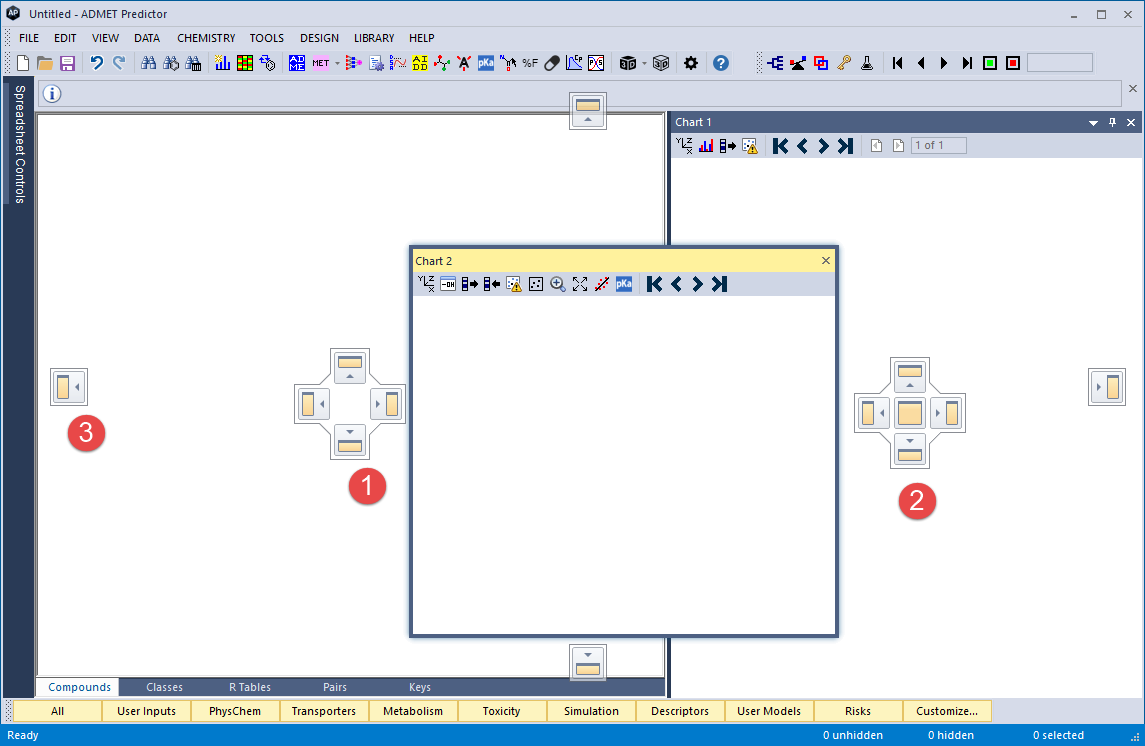
In the image above, (1) represents the docking positions available within the spreadsheet panel, (2) represents the positions available within the chart panel, and (3) is a docking positions along the edge of the ADMET Predictor window as a whole. Simply drag the plot until the mouse is over one of the twelve available arrow boxes. When the chart is brought to one of the anchor points, the program will highlight it. When the mouse button is released, the chart will be docked there. The figures below illustrate the process.
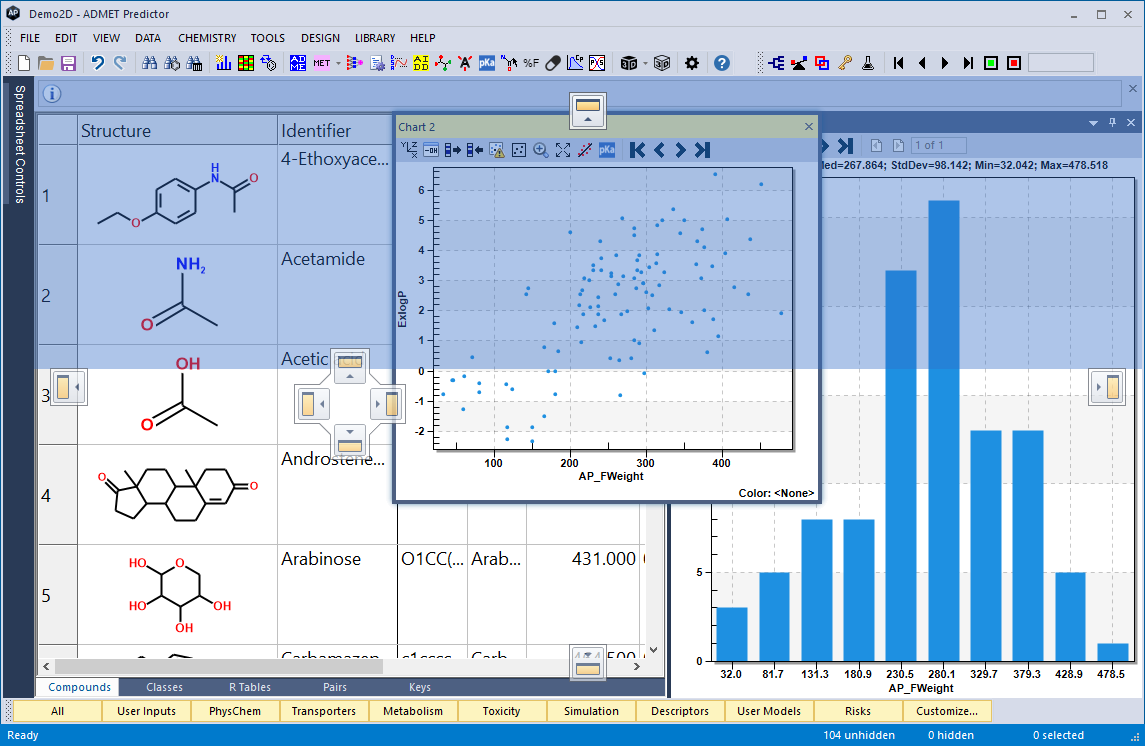
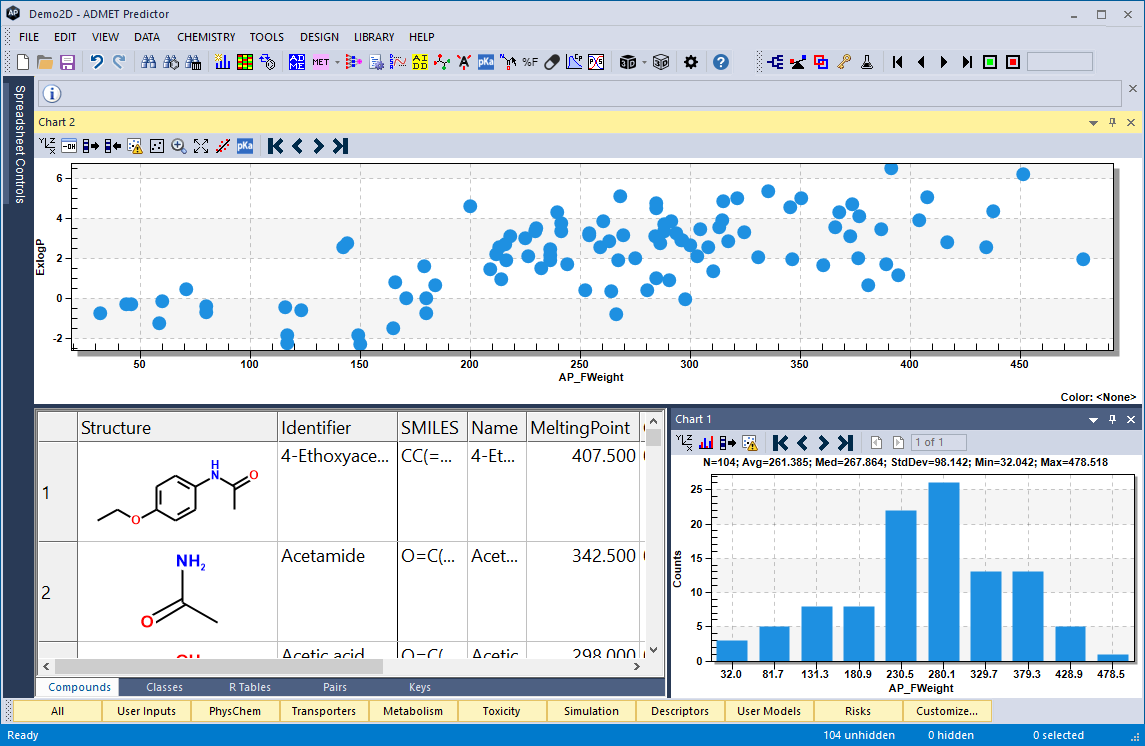
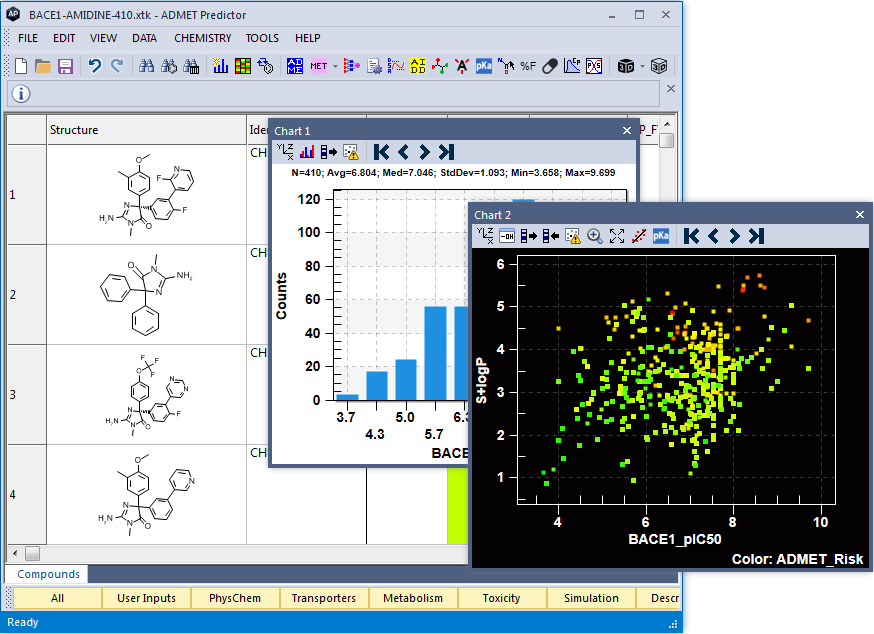
Charts can also be stacked on top of one another. When this has been done, a set of tabs will appear at the bottom left of the chart panel that lets you toggle the display among the stacked charts. In addition to the twelve predefined docked positions, a plot can be made to “float” by dragging it and releasing it away from any anchor point or outside the window altogether. This result of doing so is illustrated below.
If a plot is inadvertently deleted, you can add new ones using the menu item DATA>>Add New Chart.
Similarly, the menu item VIEW>>Dock Charts In Main Window will dock any existing charts in their default locations. This can be useful when a chart has been lost off the screen.