

1.12.8. Miner 3D
Miner3D can be launched from the main menu bar using TOOLS >> Miner3D. After doing so, you will be prompted to select those attributes you wish to pass over to Miner3D to control which data points are shown, what the plot axes will be and how the displayed symbol color, size and shape will be.
The program is a powerful, fully-integrated data visualization and analysis tool that can create many kinds of customized views of the relationships among compound attributes. The Charts menu provides access to Scatter plots (2D and 3D), Bar charts (2D and 3D) and Surface plots; it also lets you control the Default Chart Type Miner3D displays when it first opens. How multiple plots are arrayed is controlled using Window menu options.
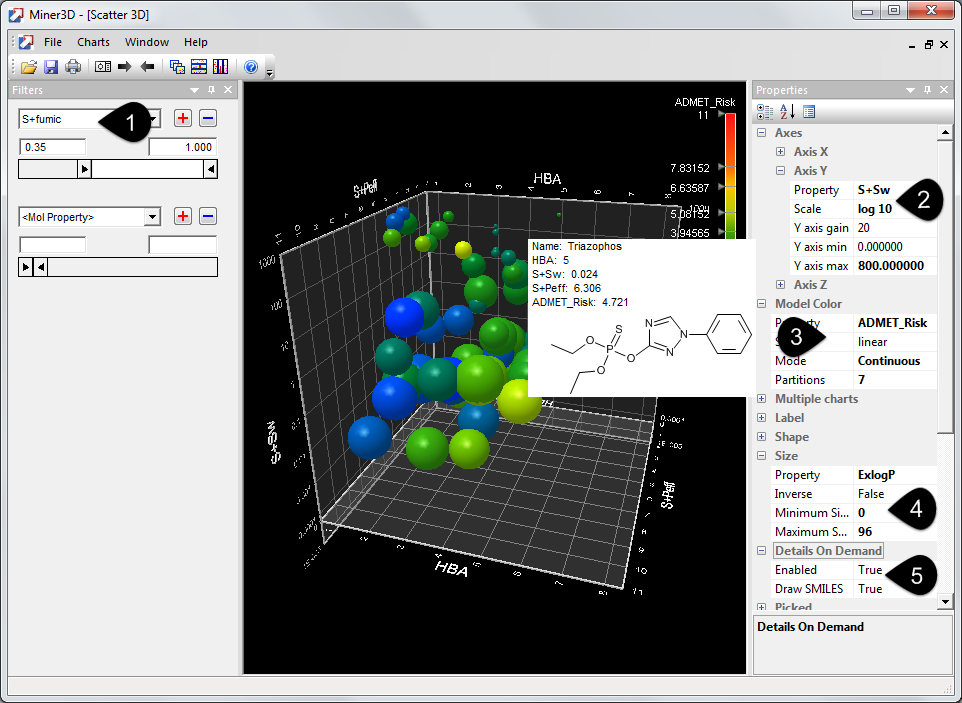
The figure below shows an example of a Scatter 3D plot.
To translate the chart, click inside the main window, hold down the left mouse button and drag the mouse in the direction you want to move the image. To rotate the image, do the same thing while holding down the right mouse button. Zooming is performed by dragging the chart while holding down the left and right mouse buttons simultaneously or by using the mouse wheel.
The Filters panel enables data point selection by range-based criteria. Any numerical attribute can be used to define a range filter (1). In the figure shown above, the compounds are filtered for the property S+fumic. Individual attribute values span their full range by default.
You can modify the range interactively by dragging the slider "handles" to their left or right; the lower limit for S+fumic in the example shown above was raised to 0.35, hiding data points with values below that. The "+" and "-" buttons add and remove filters, respectively.
The Properties panel controls your plotting options. You can for example, modify input values by log or exponential scaling (such as S+Sw), Miner3D supports the log as well as exponential scaling along with linear scaling (2). Property in the Model Color field (3) specifies the attribute to use for coloring points; "not used" turns coloring off. Other setting options are available for Axes, Label, Shape, Size, and Wrapping Label. The last four "dimensions" are similar to Model Color in that they distinguish compounds based on a specified ("mapped") attribute. For example, S+Peff was used to control symbol size in the example shown above, so that small values are represented by small spheres and large values are represented by large spheres (4). These features can effectively make Miner3D an "8D" data mining tool.
Right clicking on any point within the plot provides the chemical structure and associated properties of the compound, as illustrated above. The availability of this capability is controlled by the Details On-Demand setting in the Properties panel (5).