

2.4.2. Partition Coefficients
The equilibrium distribution of compounds between water and other phases is an important ADME consideration. ADMET Predictor provides four relevant models: logHLC, MlogP, S+logP and S+logD.
logHLC provides an estimate of Henry's Law Constant, which relates the partial pressure of a gas to its concentration in aqueous solution. MlogP and S+logP both predict the log of the partition coefficient P for a neutral species between water and n-octanol, which is a stand-in for the lipid component of biological membranes. MlogP is our implementation of one developed by [Moriguchi et al. (1992)]. S+logP , on the other hand, is our own model; its earlier versions consistently out-performed competing models in head-to-head comparisons carried out by independent researchers (Dearden 2003, Tetko 2007, Mannhold 2009). Our implementation of MlogP also did well. In fact, it outperformed the same method as implemented in Dragon Software at the time (Mannhold 2009).
LogP is the octanol-water partition coefficient for neutral molecular species and is independent pH. Many compounds of interest, however, ionize to a greater or lesser degree under physiological condition. In that case, the distribution coefficient D - which includes contributions from ionized molecular species as well as neutral ones - is more relevant. As for logP, it is logD that is of interest in most applications. Our S+logD model is derived from our S+logP model and S+pKa macrostate analysis.
Air-water partition coefficient (Henry’s Law constant)
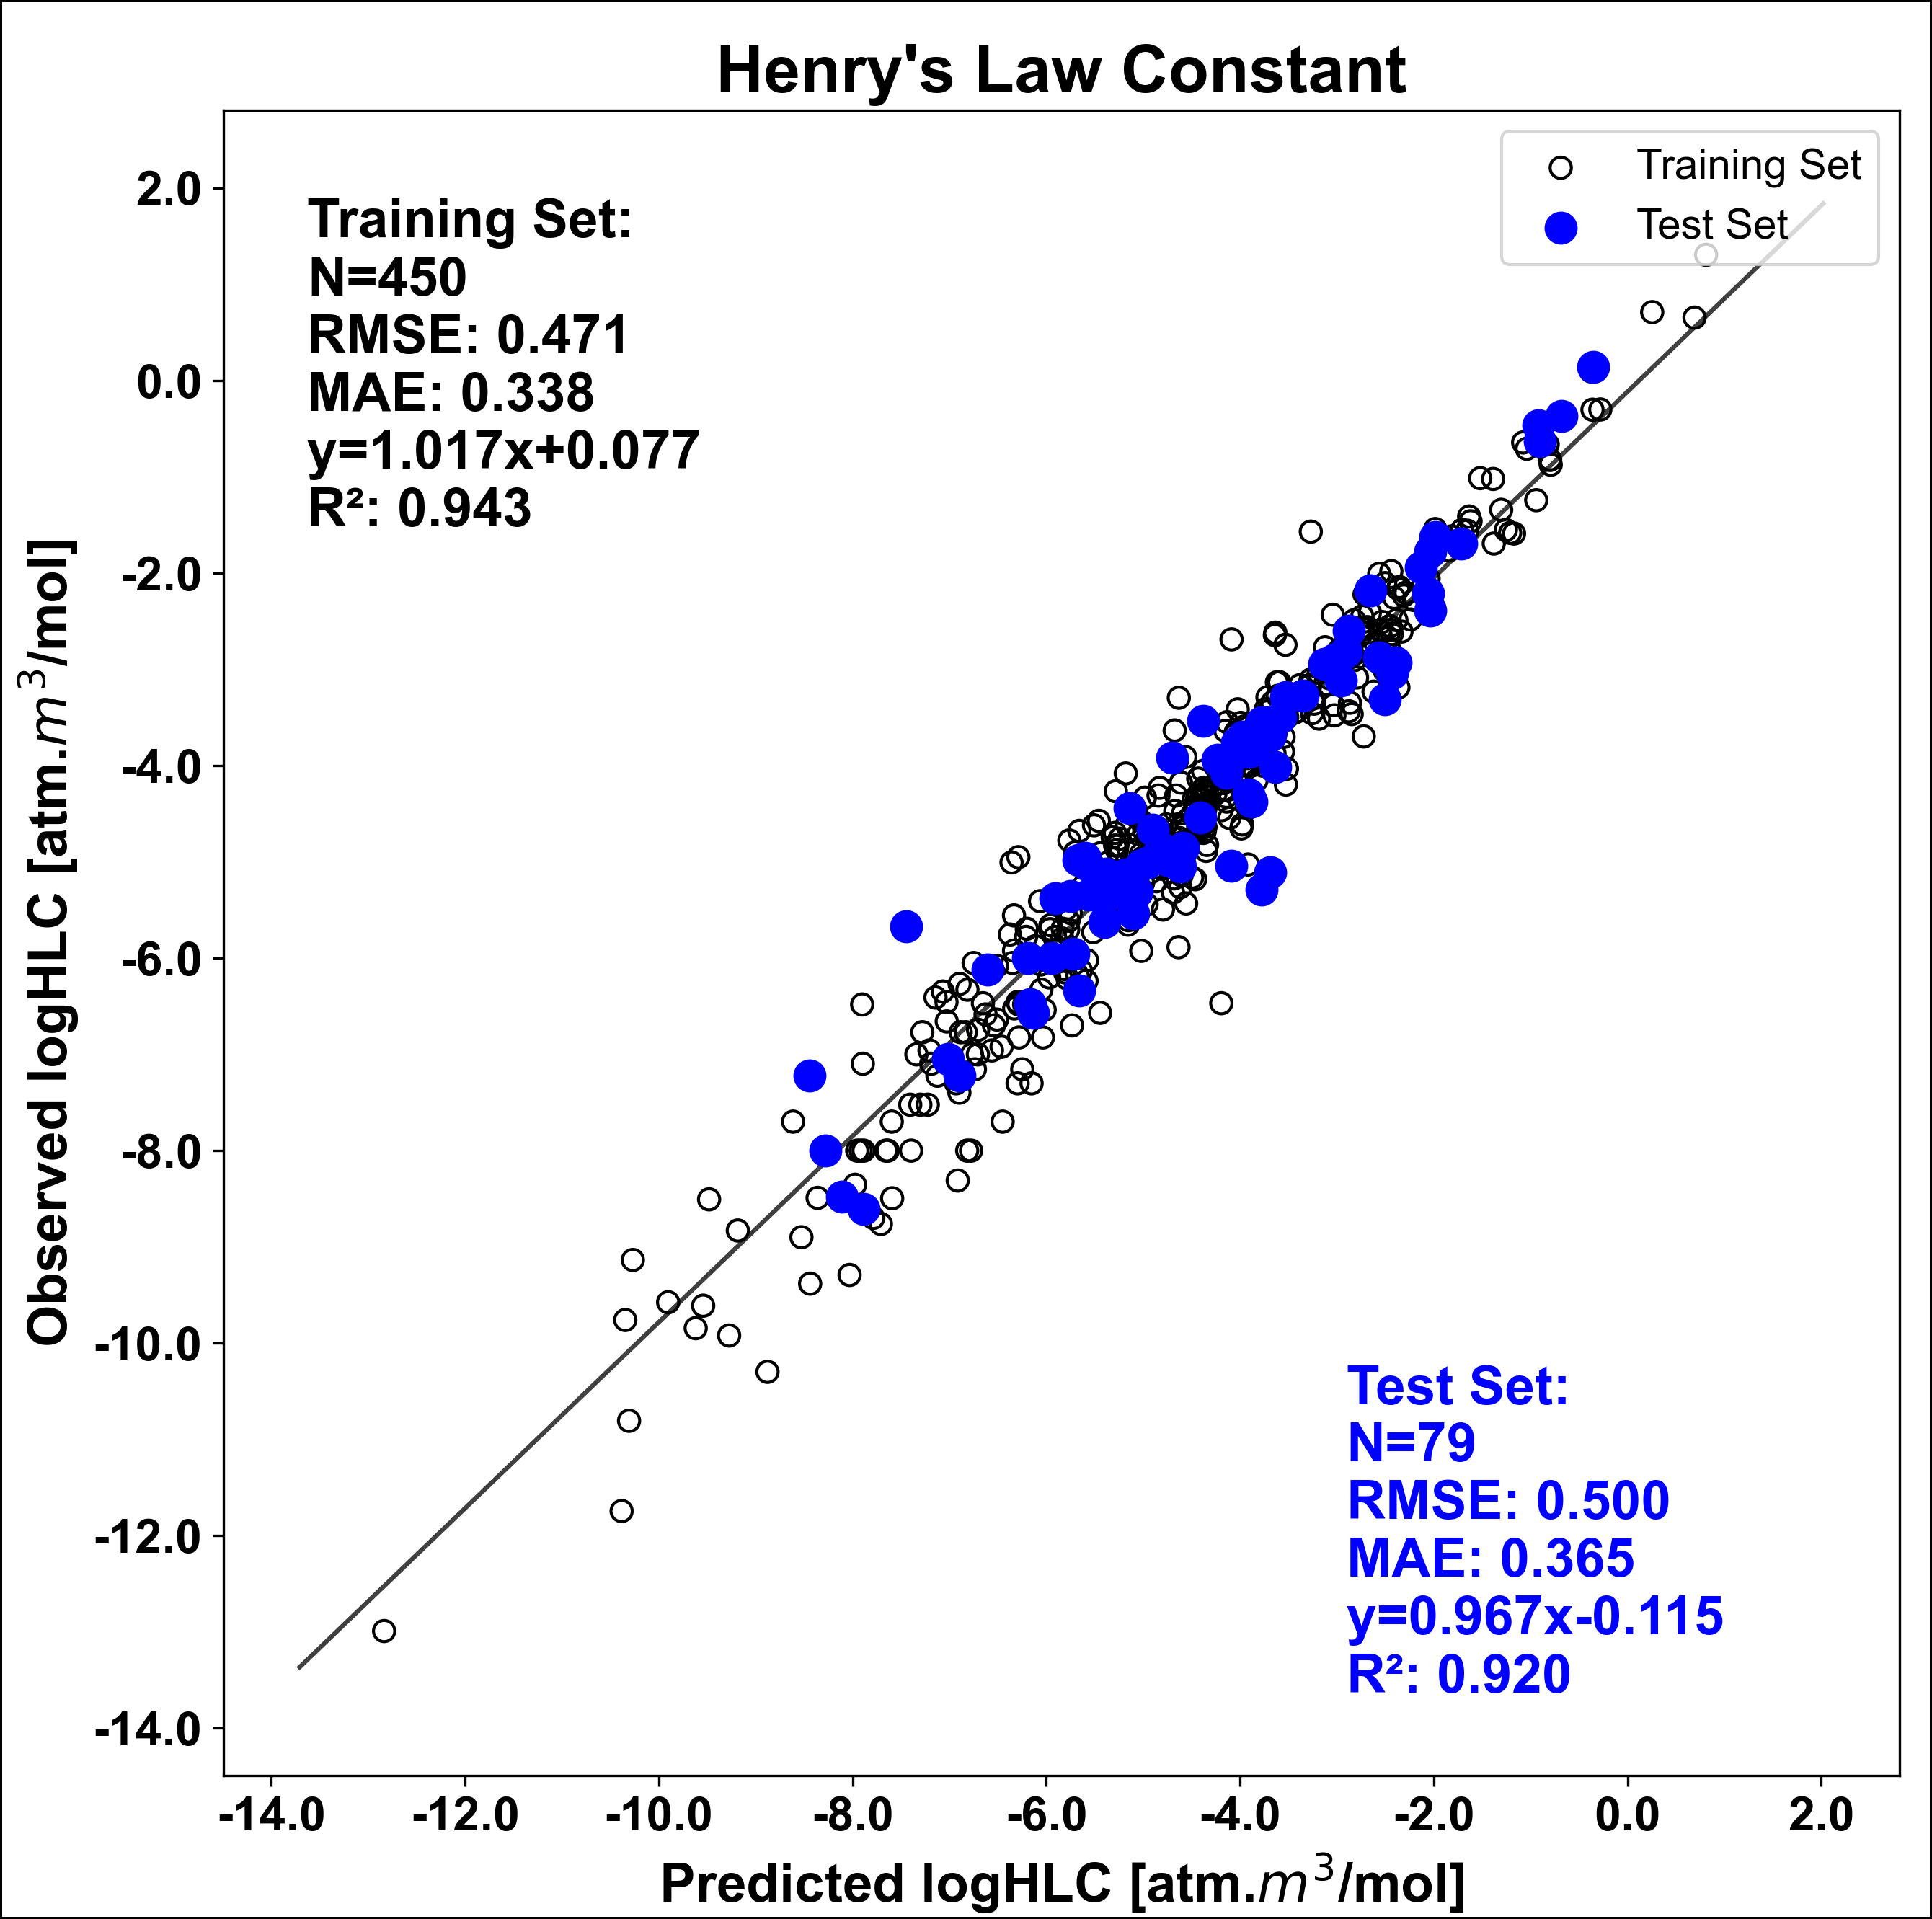
Simulations Plus’ LogHLC model predicts logarithm of the Henry’s Law Constant in the units of atm×m3/mol at 25 °C (298.55 K). The ANNE regression model was based on a dataset of 529 compounds downloaded and curated from the U.S. Environmental Protection Agency (EPA) web site.
logHLC predictions correlated well with observed values, with an RMSE of 0.50 for the test set.
Octanol-water partition coefficient (logP)
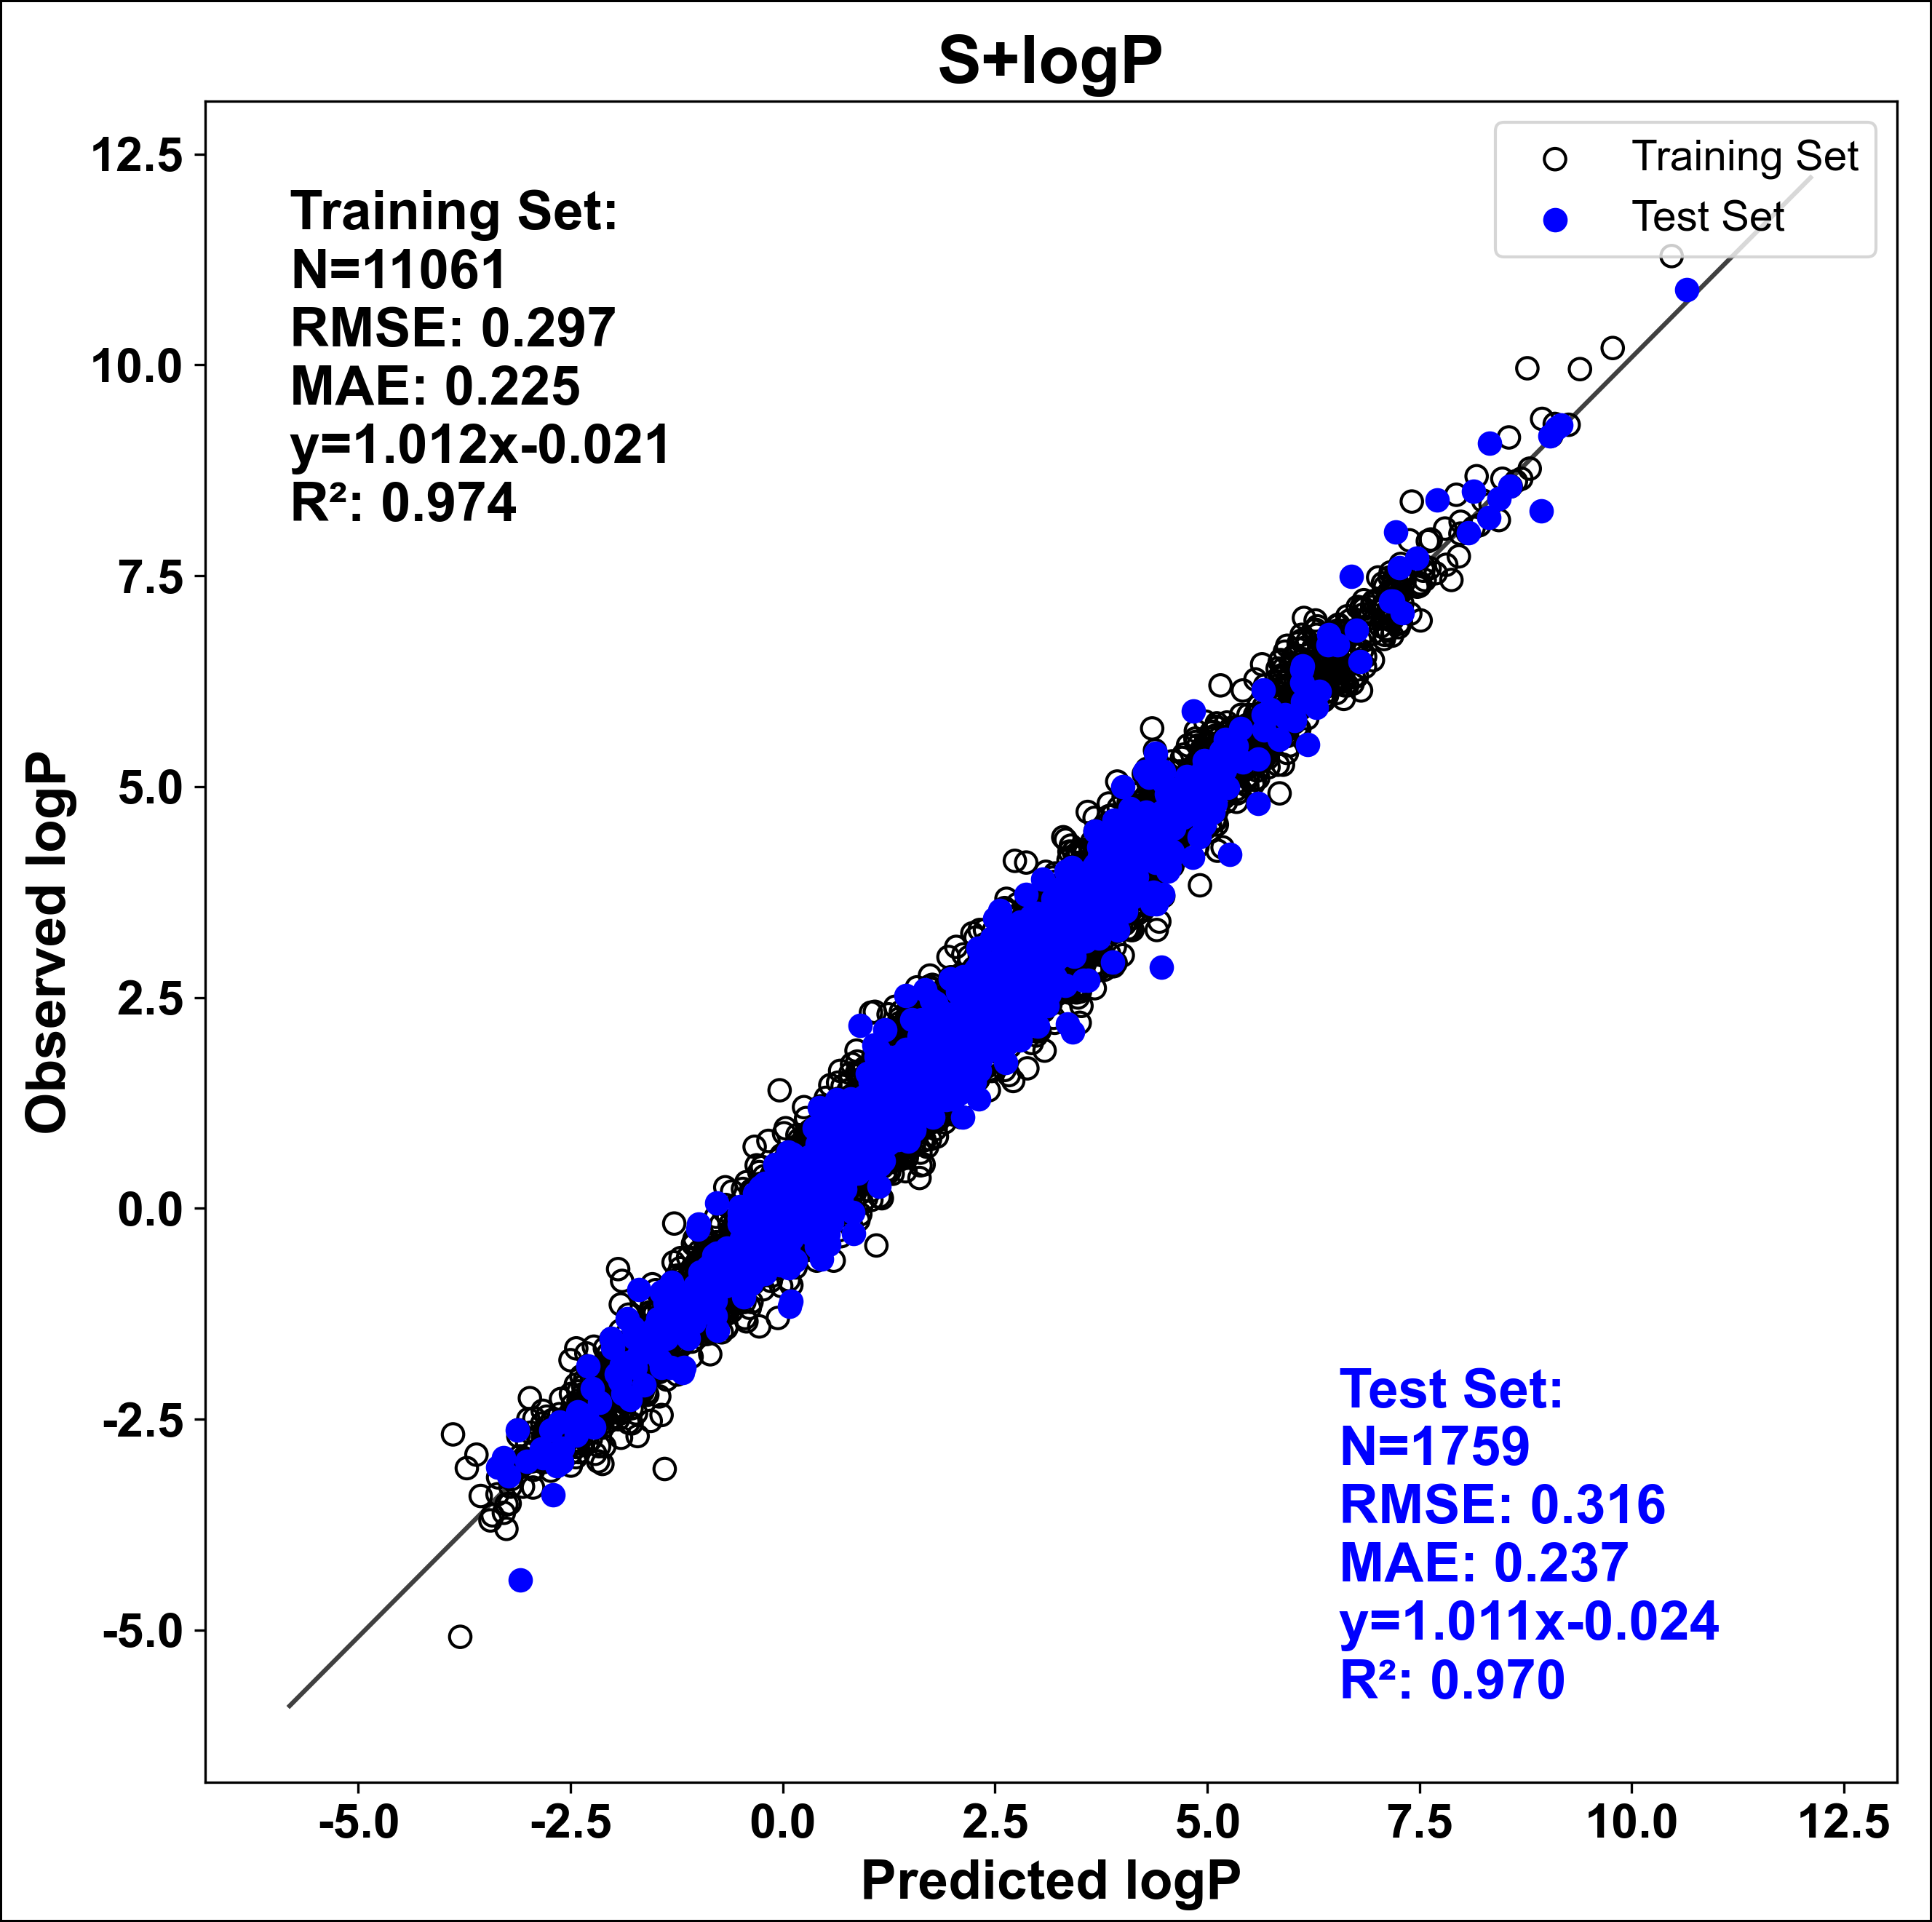
There are two log P models in ADMET Predictor: S+logP and MlogP. Both were developed from 2D descriptors. S+logP is based on ANNEs constructed from 12,820 examples selected from BioByte’s masterfile of ion-corrected experimental logP values (Hansch 1995). The correlation between S+logP predictions and observed logP values is very good, with an RMSE of 0.32 log units for the 1759 compound test set.
The Moriguchi et al. logP model was developed from a much smaller data set - 1,230 examples - using nonlinear regression (Moriguchi 1992 & 1994) to generate predictions from a linear combination of terms based on 13 molecular descriptors. There is some room for interpretation in how those rules are defined and applied, so our interpretation of them is laid out in the chapter under Descriptors Definition.
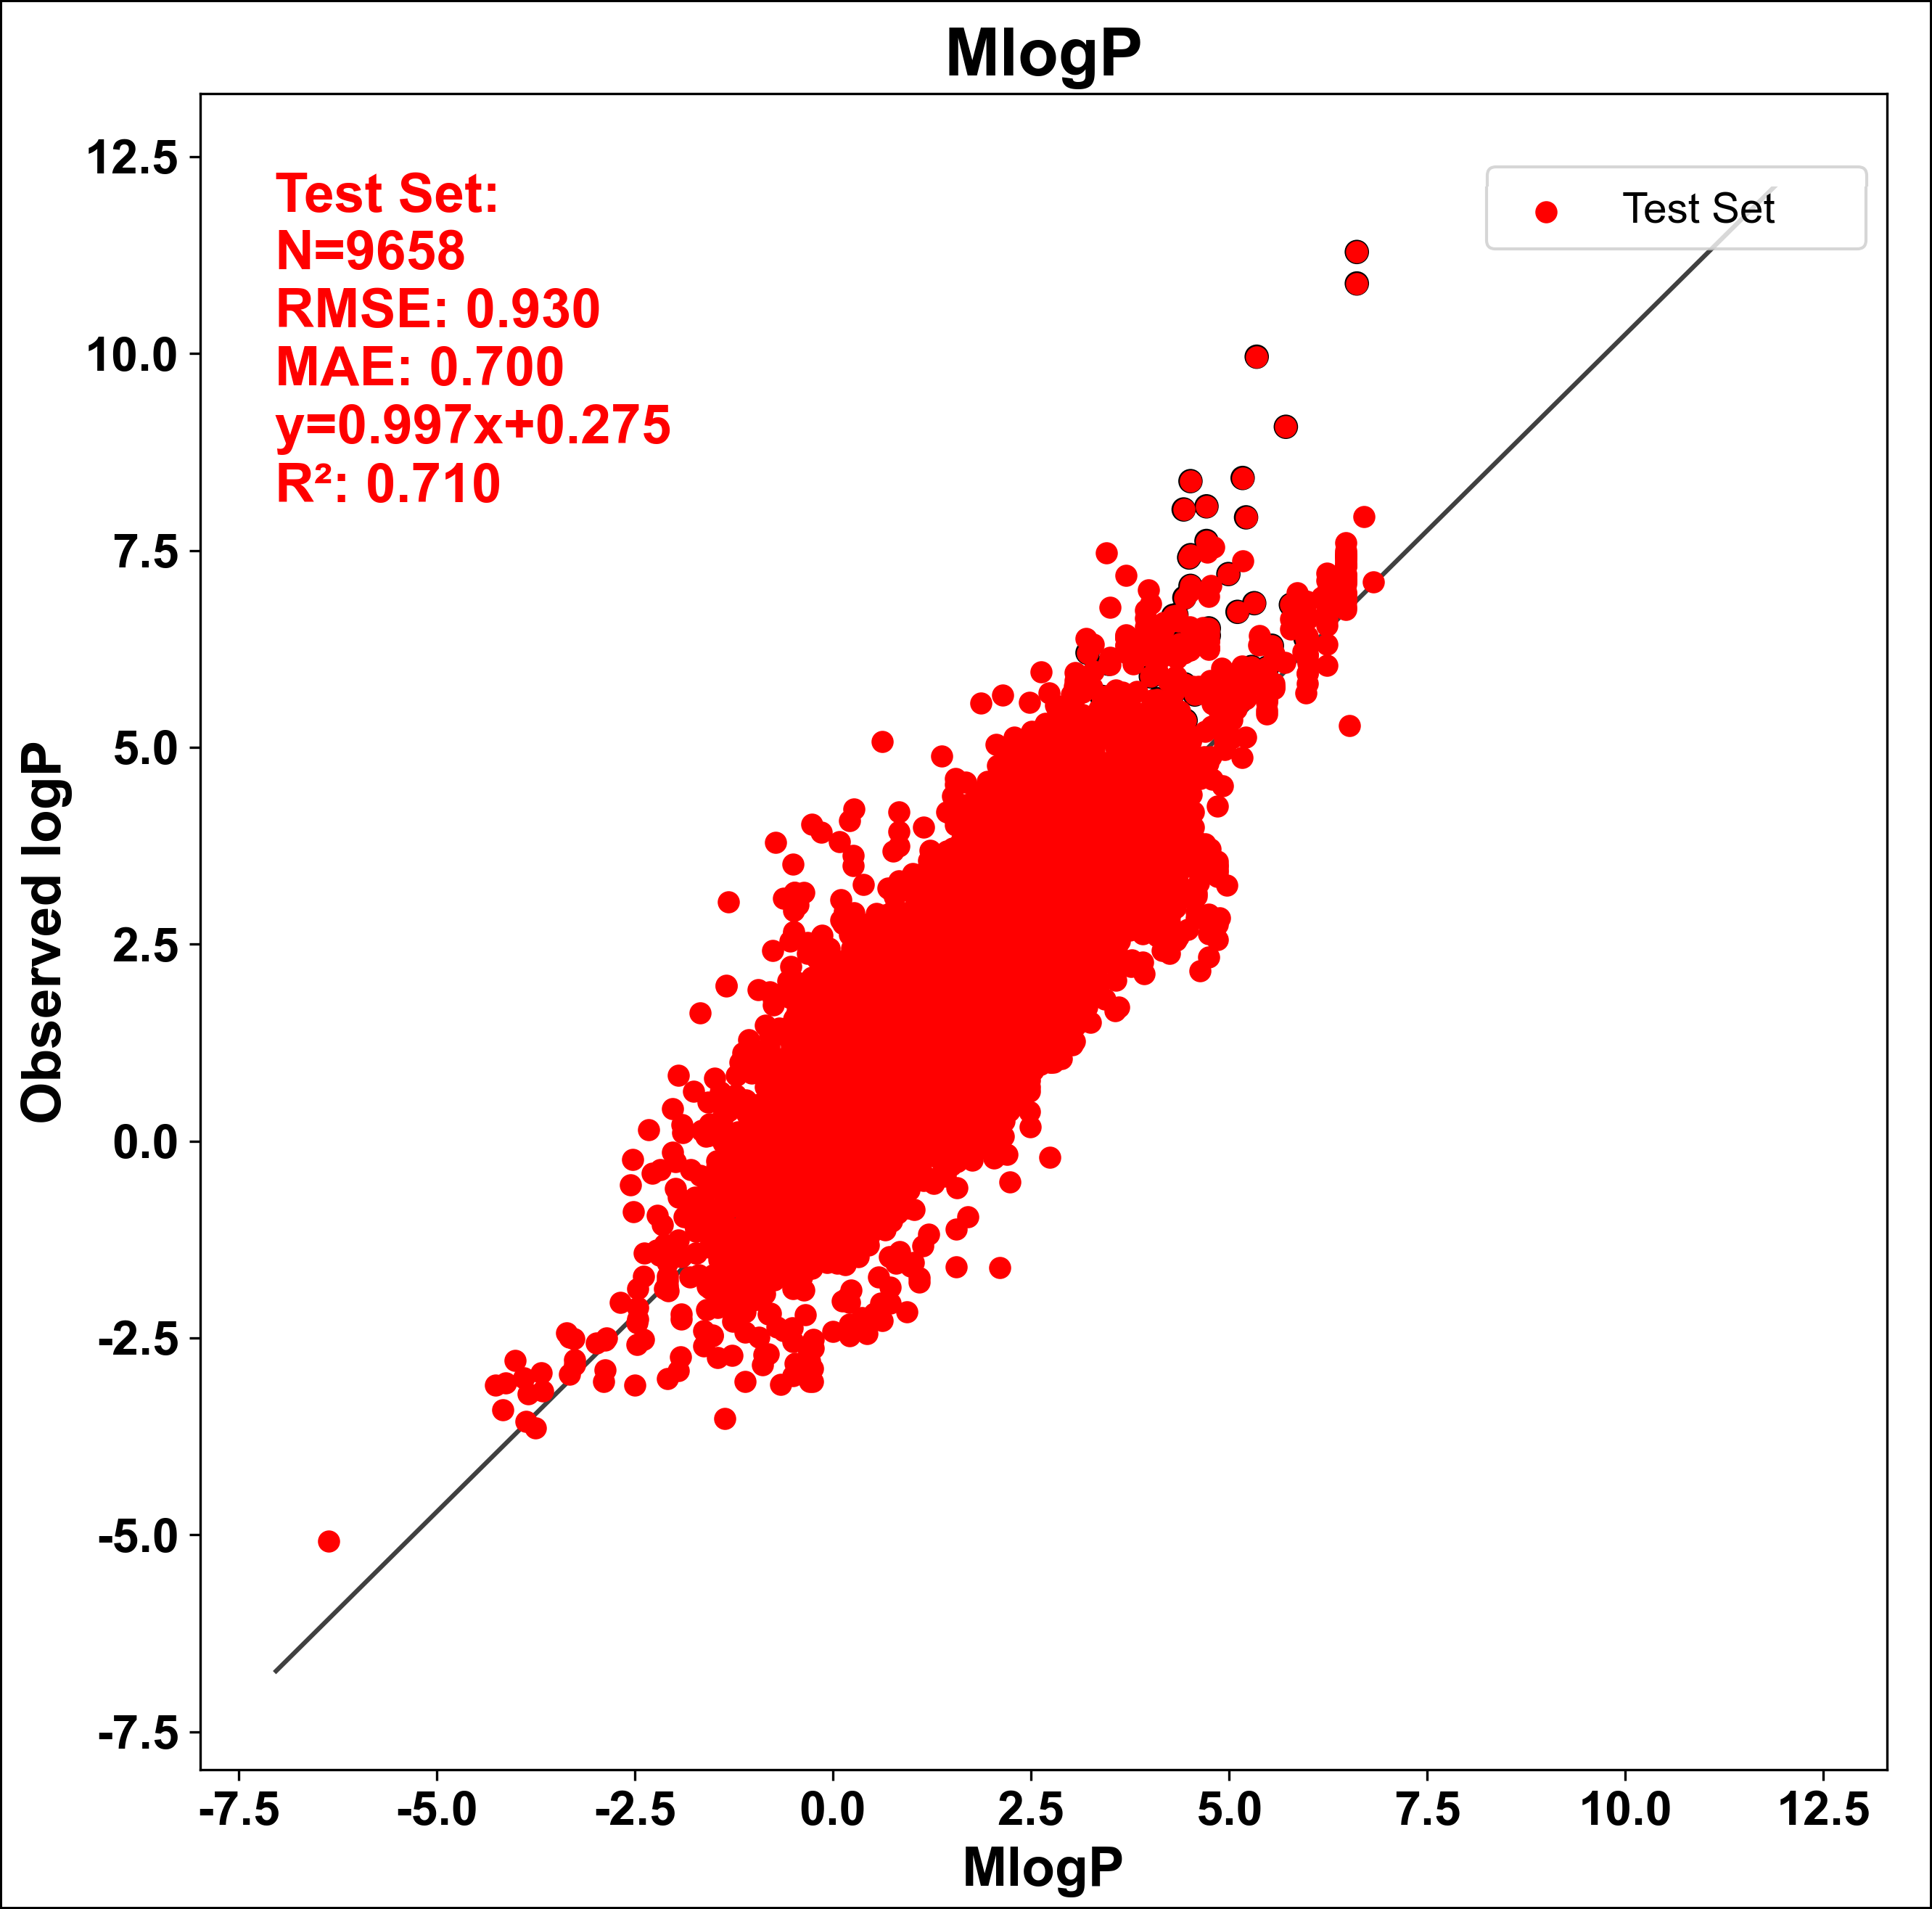
To allow a more direct comparison with the performance of S+logP, we applied MlogP to a test set of 9,658 StarList compounds, with the result shown below. The resulting RMSE is 0.93 log units for MlogP vs the corresponding statistic of 0.31 for S+logP.
Octanol-water distribution coefficient (logD)
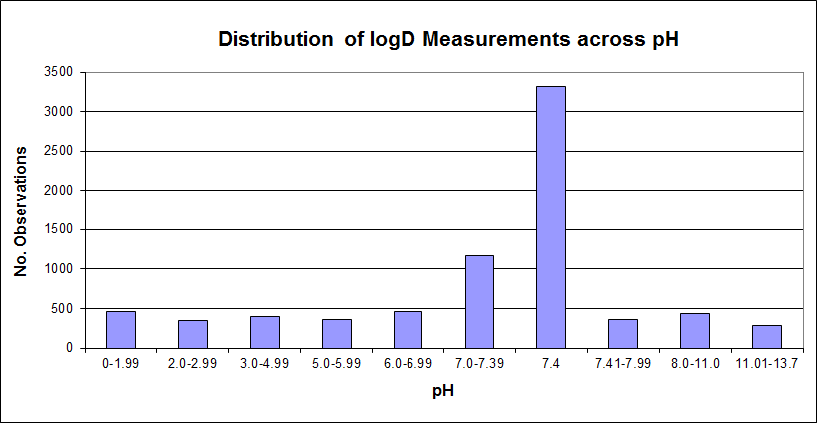
All molecules in the S+logD data set contained at least one acidic or basic group so that logD would vary with pH. Measurements for which a molecule was almost completely in the uncharged state were excluded. Many published values were excluded during curation because of errors in structure or because they were carried out under conditions where ionization was negligible. The final data set consisting of 7582 NON-ion corrected logD measurements on 6017 compounds was drawn from BioByte’s Masterfile and various literature sources. Measured pH values ranged from 0 to 13.7, with the bulk of the measurements done at pH 7.4.
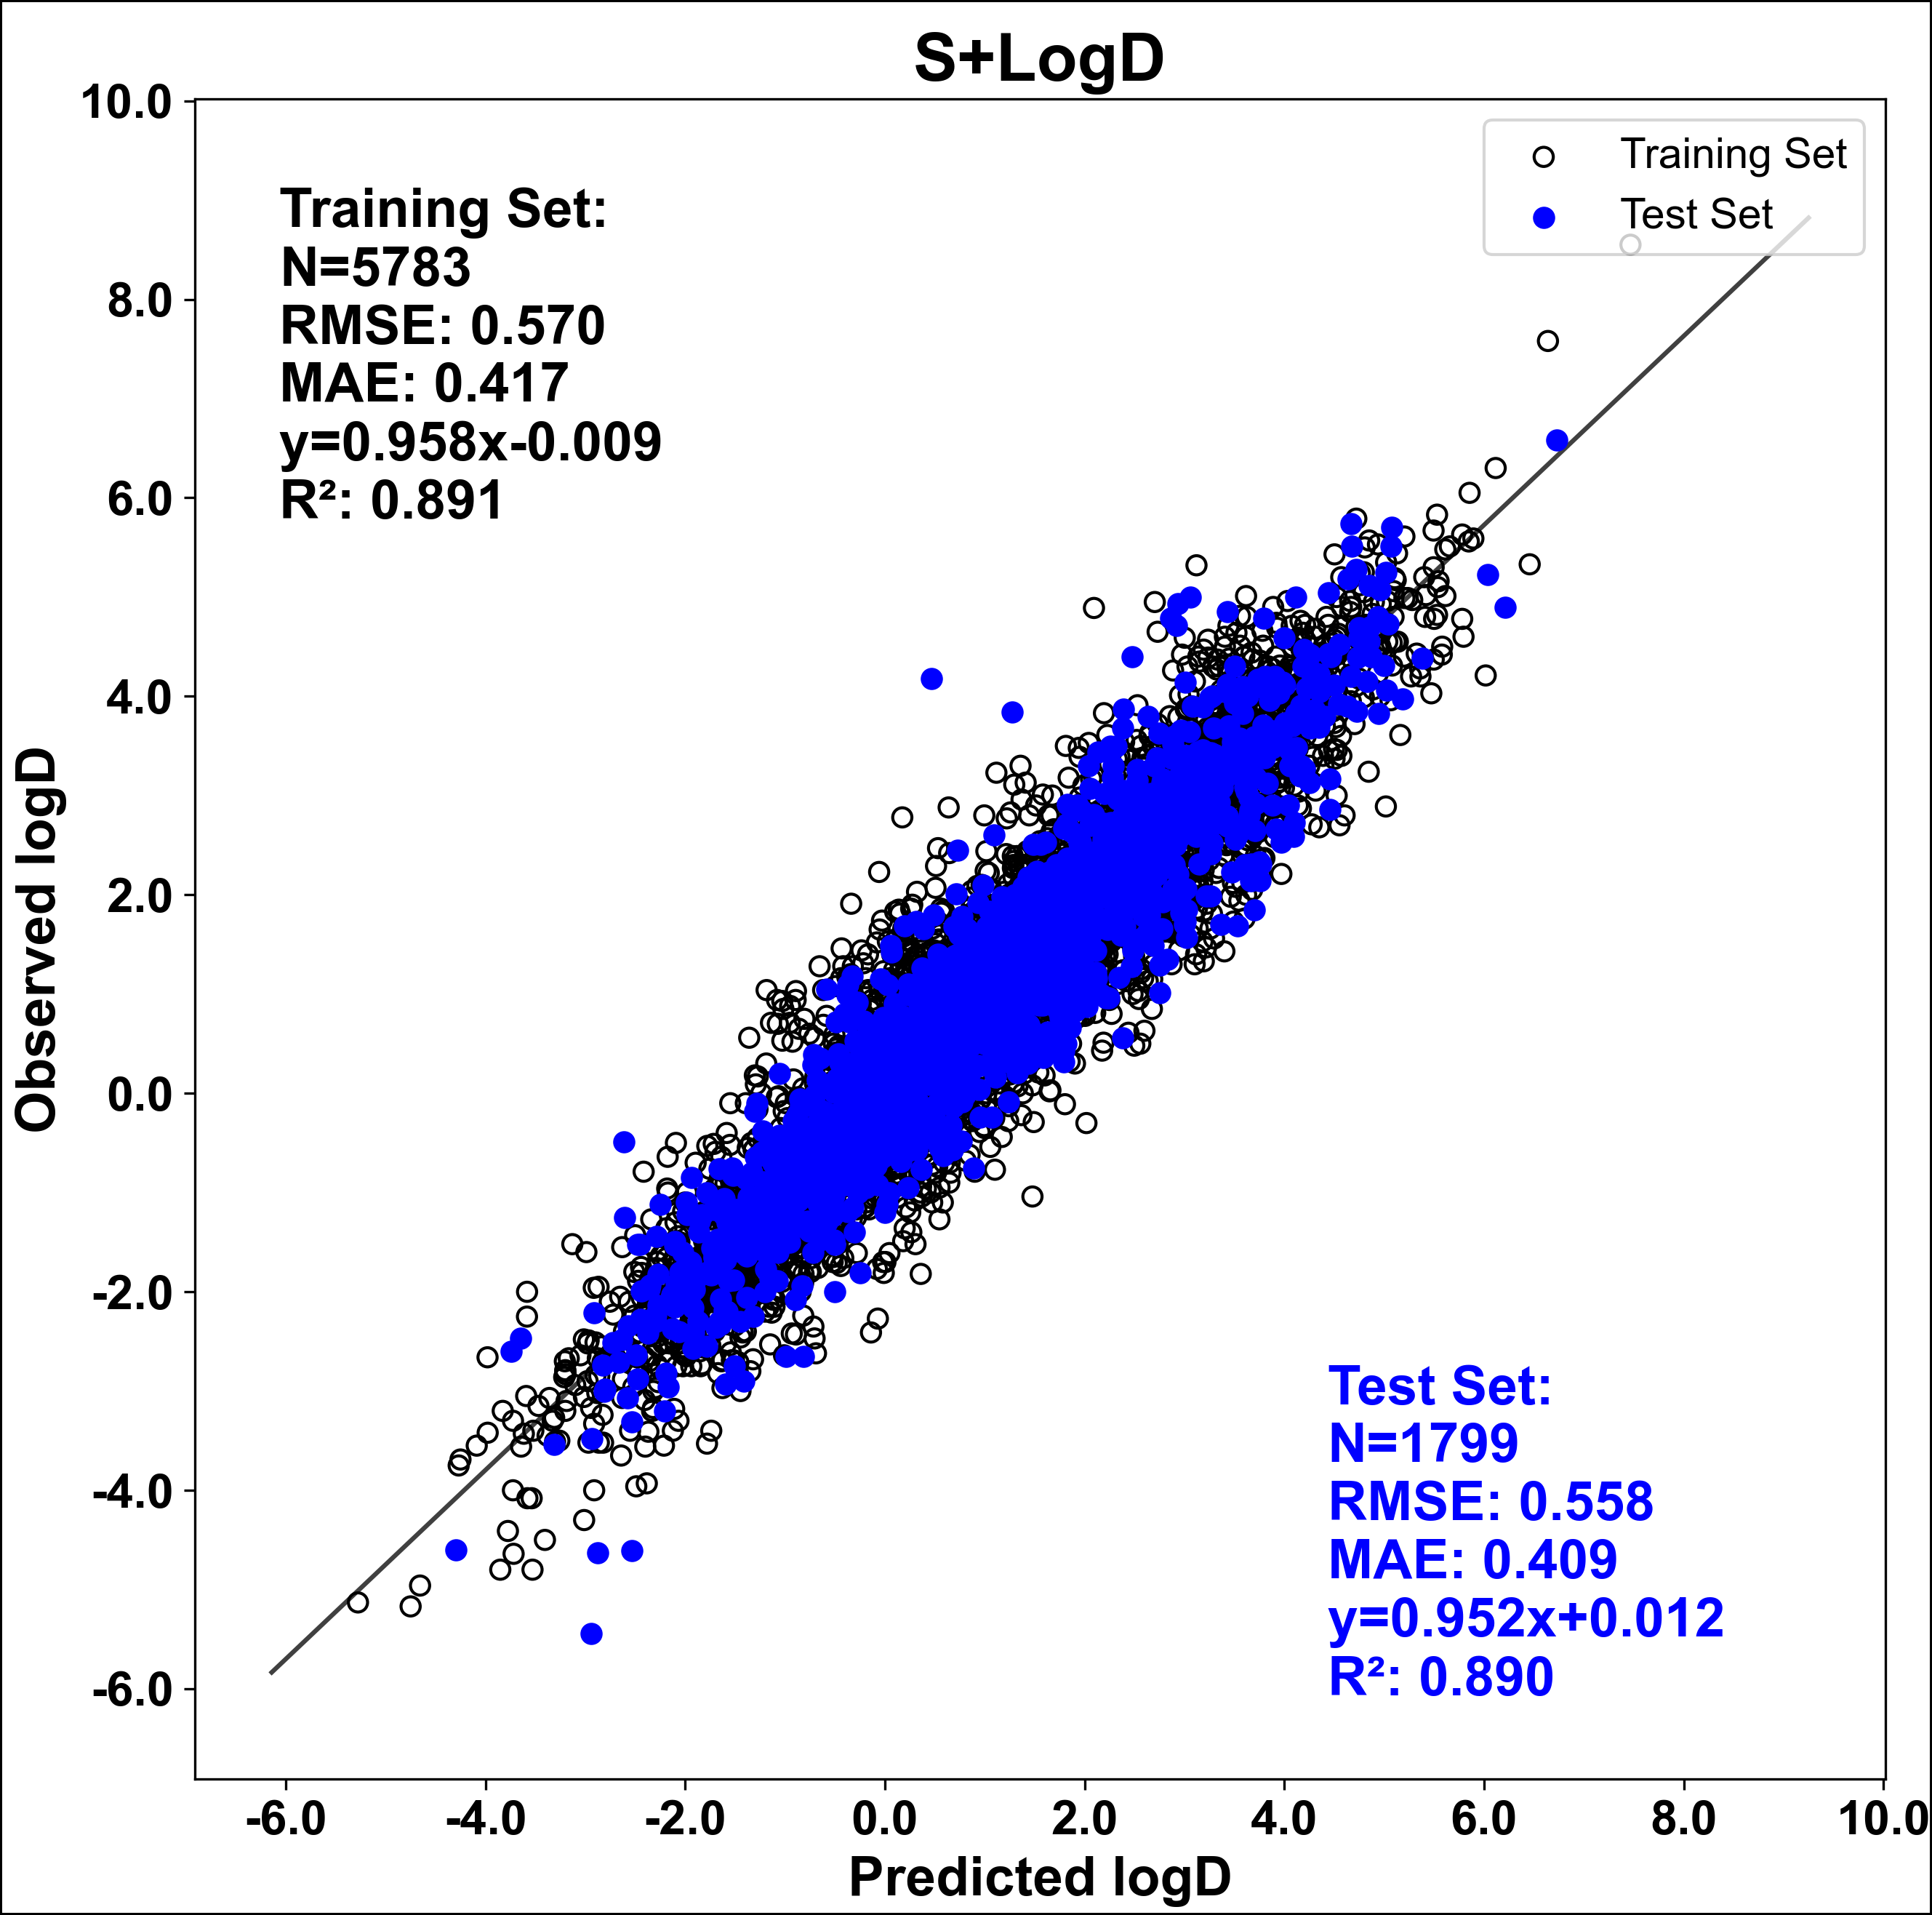
The pH-dependent fractions ionized are taken from the S+pKa macrostate analysis and logP for the neutral species is obtained from S+logP. Because the analysis needed to account for partitioning of ionized species into the octanol phase is quite complex (detailed below), parameterization was done using specialized in-house software. A performance plot for the final S+logD model is shown below. The RMSE on the external test set of 1793 measurements on 1507 molecules (none of which had measurements included in the training pool) was 0.54 log units.
You can examine the effects of changing pH on the LogD for individual compounds. This functionality is accessed using TOOLS >> LogD Profile or the Shift+L shortcut. Doing so will launch the LogD Profile window for the selected compound. The profile for metoprolol is shown below.
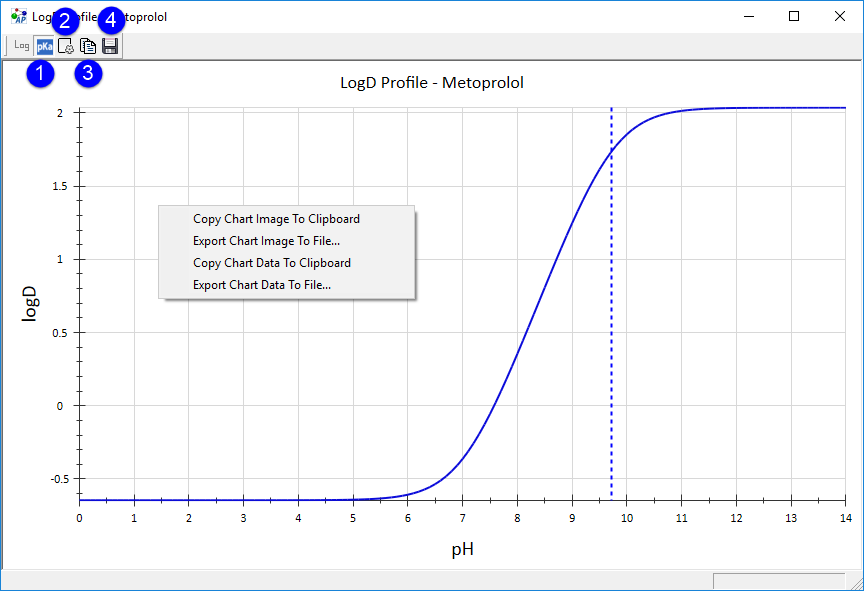
This tool plots S+LogD as a function of pH between 0 and 14. The plot has five toolbar icons at the left-hand top corner. The left-most Log icon has been disabled in LogD profile chart. The pKa icon (1) allows you to show predicted pKa's of the compound as vertical dotted lines, the color of which indicate the nature of the respective macrostate transitions: red for acidic, blue for basic, and green for mixed . The settings icon (2) allows user to change the ranges of both axes. The copy icon (3) and save button (4) allow you to copy and save the chart, respectively.
Right clicking on the chart allows you to Copy Chart Data To Clipboard so you can paste it as text into another program. You can also save the chart data using the Export Chart Data To File option in the pop-up context menu.
Detailed distribution coefficient theory
logD is determined by the ratio of analyte concentrations in octanol and water phases (Pagliara 1997). It thus includes all ionization states of a given compound and therefore depends on pH. Its complete pH profile can be derived from the pH-dependent distribution of protonation species in both solvents as described in the following.
where [X](i) refers to the concentration of species X in ionization state (i); the phase is specified by the subscript as being octanol ("oct") or water ("aq"). The sum is over all macroscopic ionization states of the molecule, as discussed above.
Given the following definitions:
'%3e%3cg transform='translate(167%2c0)'%3e%3cg transform='translate(-13%2c0)'%3e%3cg transform='translate(0%2c-94)'%3e%3cuse xlink:href='%23MJMAIN-394' x='0' y='0'%3e%3c/use%3e%3cg transform='translate(833%2c362)'%3e%3cuse transform='scale(0.707)' xlink:href='%23MJMAIN-28' x='0' y='0'%3e%3c/use%3e%3cuse transform='scale(0.707)' xlink:href='%23MJMATHI-69' x='389' y='0'%3e%3c/use%3e%3cuse transform='scale(0.707)' xlink:href='%23MJMAIN-29' x='734' y='0'%3e%3c/use%3e%3c/g%3e%3cuse xlink:href='%23MJMAIN-2261' x='2006' y='0'%3e%3c/use%3e%3cg transform='translate(3062%2c0)'%3e%3cuse xlink:href='%23MJMAIN-6C'%3e%3c/use%3e%3cuse xlink:href='%23MJMAIN-6F' x='278' y='0'%3e%3c/use%3e%3cuse xlink:href='%23MJMAIN-67' x='779' y='0'%3e%3c/use%3e%3cuse xlink:href='%23MJMATHI-50' x='1446' y='0'%3e%3c/use%3e%3cuse xlink:href='%23MJMAIN-2212' x='2419' y='0'%3e%3c/use%3e%3cg transform='translate(3420%2c0)'%3e%3cuse xlink:href='%23MJMAIN-6C'%3e%3c/use%3e%3cuse xlink:href='%23MJMAIN-6F' x='278' y='0'%3e%3c/use%3e%3cuse xlink:href='%23MJMAIN-67' x='779' y='0'%3e%3c/use%3e%3c/g%3e%3cg transform='translate(4866%2c0)'%3e%3cuse xlink:href='%23MJMATHI-50' x='0' y='0'%3e%3c/use%3e%3cg transform='translate(784%2c362)'%3e%3cuse transform='scale(0.707)' xlink:href='%23MJMAIN-28' x='0' y='0'%3e%3c/use%3e%3cuse transform='scale(0.707)' xlink:href='%23MJMATHI-69' x='389' y='0'%3e%3c/use%3e%3cuse transform='scale(0.707)' xlink:href='%23MJMAIN-29' x='734' y='0'%3e%3c/use%3e%3c/g%3e%3c/g%3e%3c/g%3e%3c/g%3e%3c/g%3e%3c/g%3e%3c/g%3e%3c/svg%3e)
and some algebraic rearrangement, one arrives at:
where the pH dependence of the model is contained in the pH-dependent fractions ionized which can be obtained from knowledge of the aqueous pKa’s of the molecule. Measurements for which a molecule is almost completely in the uncharged state were excluded because there would be no observable dependence of log D on Δ(i) (since the f(i) are nearly zero in this case).
The Δ(i) contain the differences between logP of the neutral species and logP(i), the logP of a given ionization state. An approximation is often made that the Δ(i) are the same for all anionic states of a molecule and can be set to a single value Δ(–). Similarly, all cationic states are set to a single value Δ(+). Then, the formula for log D simplifies to:
where f(–) and f(+) represent the fraction of molecules in all anionic and cationic states at the given pH, respectively.
ANNE’s were employed to estimate Δ(–) and Δ(+) for a given molecule from its molecular descriptors. Attempts to build a more complex model using separate Δ(i) for each ionization state did not improve model performance, so the simpler two parameter Δ model was chosen.
Note: Within ADMET Predictor's Model Editor, S+logD is assigned the special Model Type LOGDPH. In this case, the Determining Descriptor is the name of the logP model from which the logD model is derived (S+logP) while the Auxiliary Factor is the formal charge descriptor (FormalQ) used to “scale” (i.e. shift) the neutral charge state for permanently charged molecules, such as quaternary amines. This model type uses a special input file type with an “.lph” extension that contains the names of the neural network ANNE model files used to estimate Δ(–) and Δ(+). Those names can be replaced with constant factors, if desired.