

2.4.1. Dissociation Constant (pKa)
It is hard to overstate the importance of molecular ionization in water to pharmaceutical research, and the pKa models and visualization tools available in ADMET Predictor are state of the art (Fraczkiewicz 2015, Fraczkiewicz 2024). The pH-dependent distribution of ionized and un-ionized species strongly affects vital properties of molecules such as lipophilicity, solubility, permeability, etc. In silico prediction of complete complex multiprotic ionization equilibria from molecular structure is difficult and only a handful of software vendors offer such a product. (Fraczkiewicz 2013) We use a novel method based on ensembles of artificial neural networks built from proprietary atomic descriptors to predict microscopic pKa's. A complete and quantitative theoretical framework for handling molecules with any number of ionizable groups is then applied to those microscopic equilibrium constants to estimate the corresponding macroscopic dissociation constants.
If the distinction between micro- and macroscopic equilibria is unfamiliar to you, you would do well to read the section on the subtleties of multiprotic ionization in the chapter on Property Theory and Details.
Here we describe how well our S+pKa model predicts macroscopic (observable) pKa's; how the pKa Microstates Window can be used to visualize the microstate analysis that underlies those predictions; how the toolbar allows you to navigate microstate schemes; how microstates relate to tautomers; and how ionization charts can provide further insights into how molecular charge properties are affected by pH.
Those ADMET properties that depend on input pH (e.g., S+logD, S+pH_Satd, and S+S_pH) are calculated directly from S+pKa. A small but important group of Ionization Descriptors that we rely on for our models are pH-dependent. By default we evaluate them at pH 7.4 and our models are built with that as the reference pH. ADMET Predictor does allows you to calculate all descriptors at some other specified pH, but doing so is not recommended. It will compromise the accuracy and performance of the built-in property models. This reflects the statistical basis of most built–in models; they lack the mechanistic underpinning needed to take such changes into account.
ADMET Predictor allows you to supply experimental pKa values to use in lieu of the internally calculated ones for calculating descriptors and estimating ADMET properties. To do this, you will need to import or manually add real-valued attributes starting with Obsd_Acidic_pKa and/or Obsd_Basic_pKa to the spreadsheet. The values provided will override S+Acidic_pKa and S+Basic_pKa, respectively, for those purposes. They are not, however, used in microstate analyses or to generate ionization charts. Only single values per column are allowed. Multiple pKa of the same type can be input by, e.g., appending a number to the column title (e.g., Obsd_Acidic_pKa_1, Obsd_Acidic_pKa_2, etc.). If there are multiple acidic or basic pKa's, enter the one closest to the specified reference pH, which is 7.4 by default.
All the detailed pKa prediction results can be saved from the command line; see Saving pKa results in Tutorials for details.
S+pKa construction and performance
ADMET Predictor’s predictive pKa model - S+pKa – is based on a collection of artificial neural network ensembles (Fraczkiewicz 2015, Fraczkiewicz 2024). The full data set of observed pKa used to train it, described below, has been divided into the following ten classes according to the (dominant) group being ionized:
Acids:
-
Hydroxy acids (-OH group; alcohols, phenols, carboxylates, sulfo acids, etc.)
-
Acidic amides (-NH2 and –NH- groups; imides, sulfonamides, etc.)
-
Acids based on aromatic NH (-NH- group in an aromatic ring; uracils, activated imidazoles, etc.)
-
Thioacids (-SH group; thiols, thiocarboxyls, etc.)
-
Carboacids (-CH2 and >CH- groups; barbiturates, acetylacetone, etc.)
Bases:
-
Amines (-NH2, -NH-, >N- groups; aliphatic amines, anilines, etc.)
-
Bases based on aromatic N (-N- groups that are a part of an aromatic ring; pyridines, pyrimidines, etc.)
-
N-oxides (O=N- group; both aromatic and tertiary aliphatic)
-
Thiones (S= group in delocalized pi systems)
-
Carbobases (protonatable carbon atoms in certain π–excessive rings, e.g., substituted pyrroles, indoles, indolizines)
An artificial neural network ensemble (ANNE) was generated for each of the ten types of ionizable groups. This was followed by a comprehensive optimization of all the ensembles simultaneously within the realm of microequilibrium theory. Each ensemble takes our proprietary atomic descriptors as input. Outputs from these ensembles are the predicted microscopic ionization constants from which the macroscopic pKa's and microstate populations are calculated.
Early versions of S+pKa were trained on a database of 14,176 multiprotic ionization macroconstants from public sources. Thanks to a unique collaborative agreement, in 2011 Bayer HealthCare™ granted Simulations Plus access to a large portion of their experimental ionization data set. Bayer’s data consisted of 19,464 multiprotic ionization macroconstants measured in the course of pharmaceutical research conducted over many years. We used the data to extend the applicability domain of our model to a chemical space characteristic to pharmaceutical drugs and drug candidates. (Fraczkiewicz 2015) In 2022 and 2023 three additional corporations have shared their pKa data with us to expand the S+pKa applicability domain onto their respective chemical spaces. The new data was appended to our existing public+Bayer database, resulting in a respectable number of 70,810 experimental macroconstants, and the model was retrained.
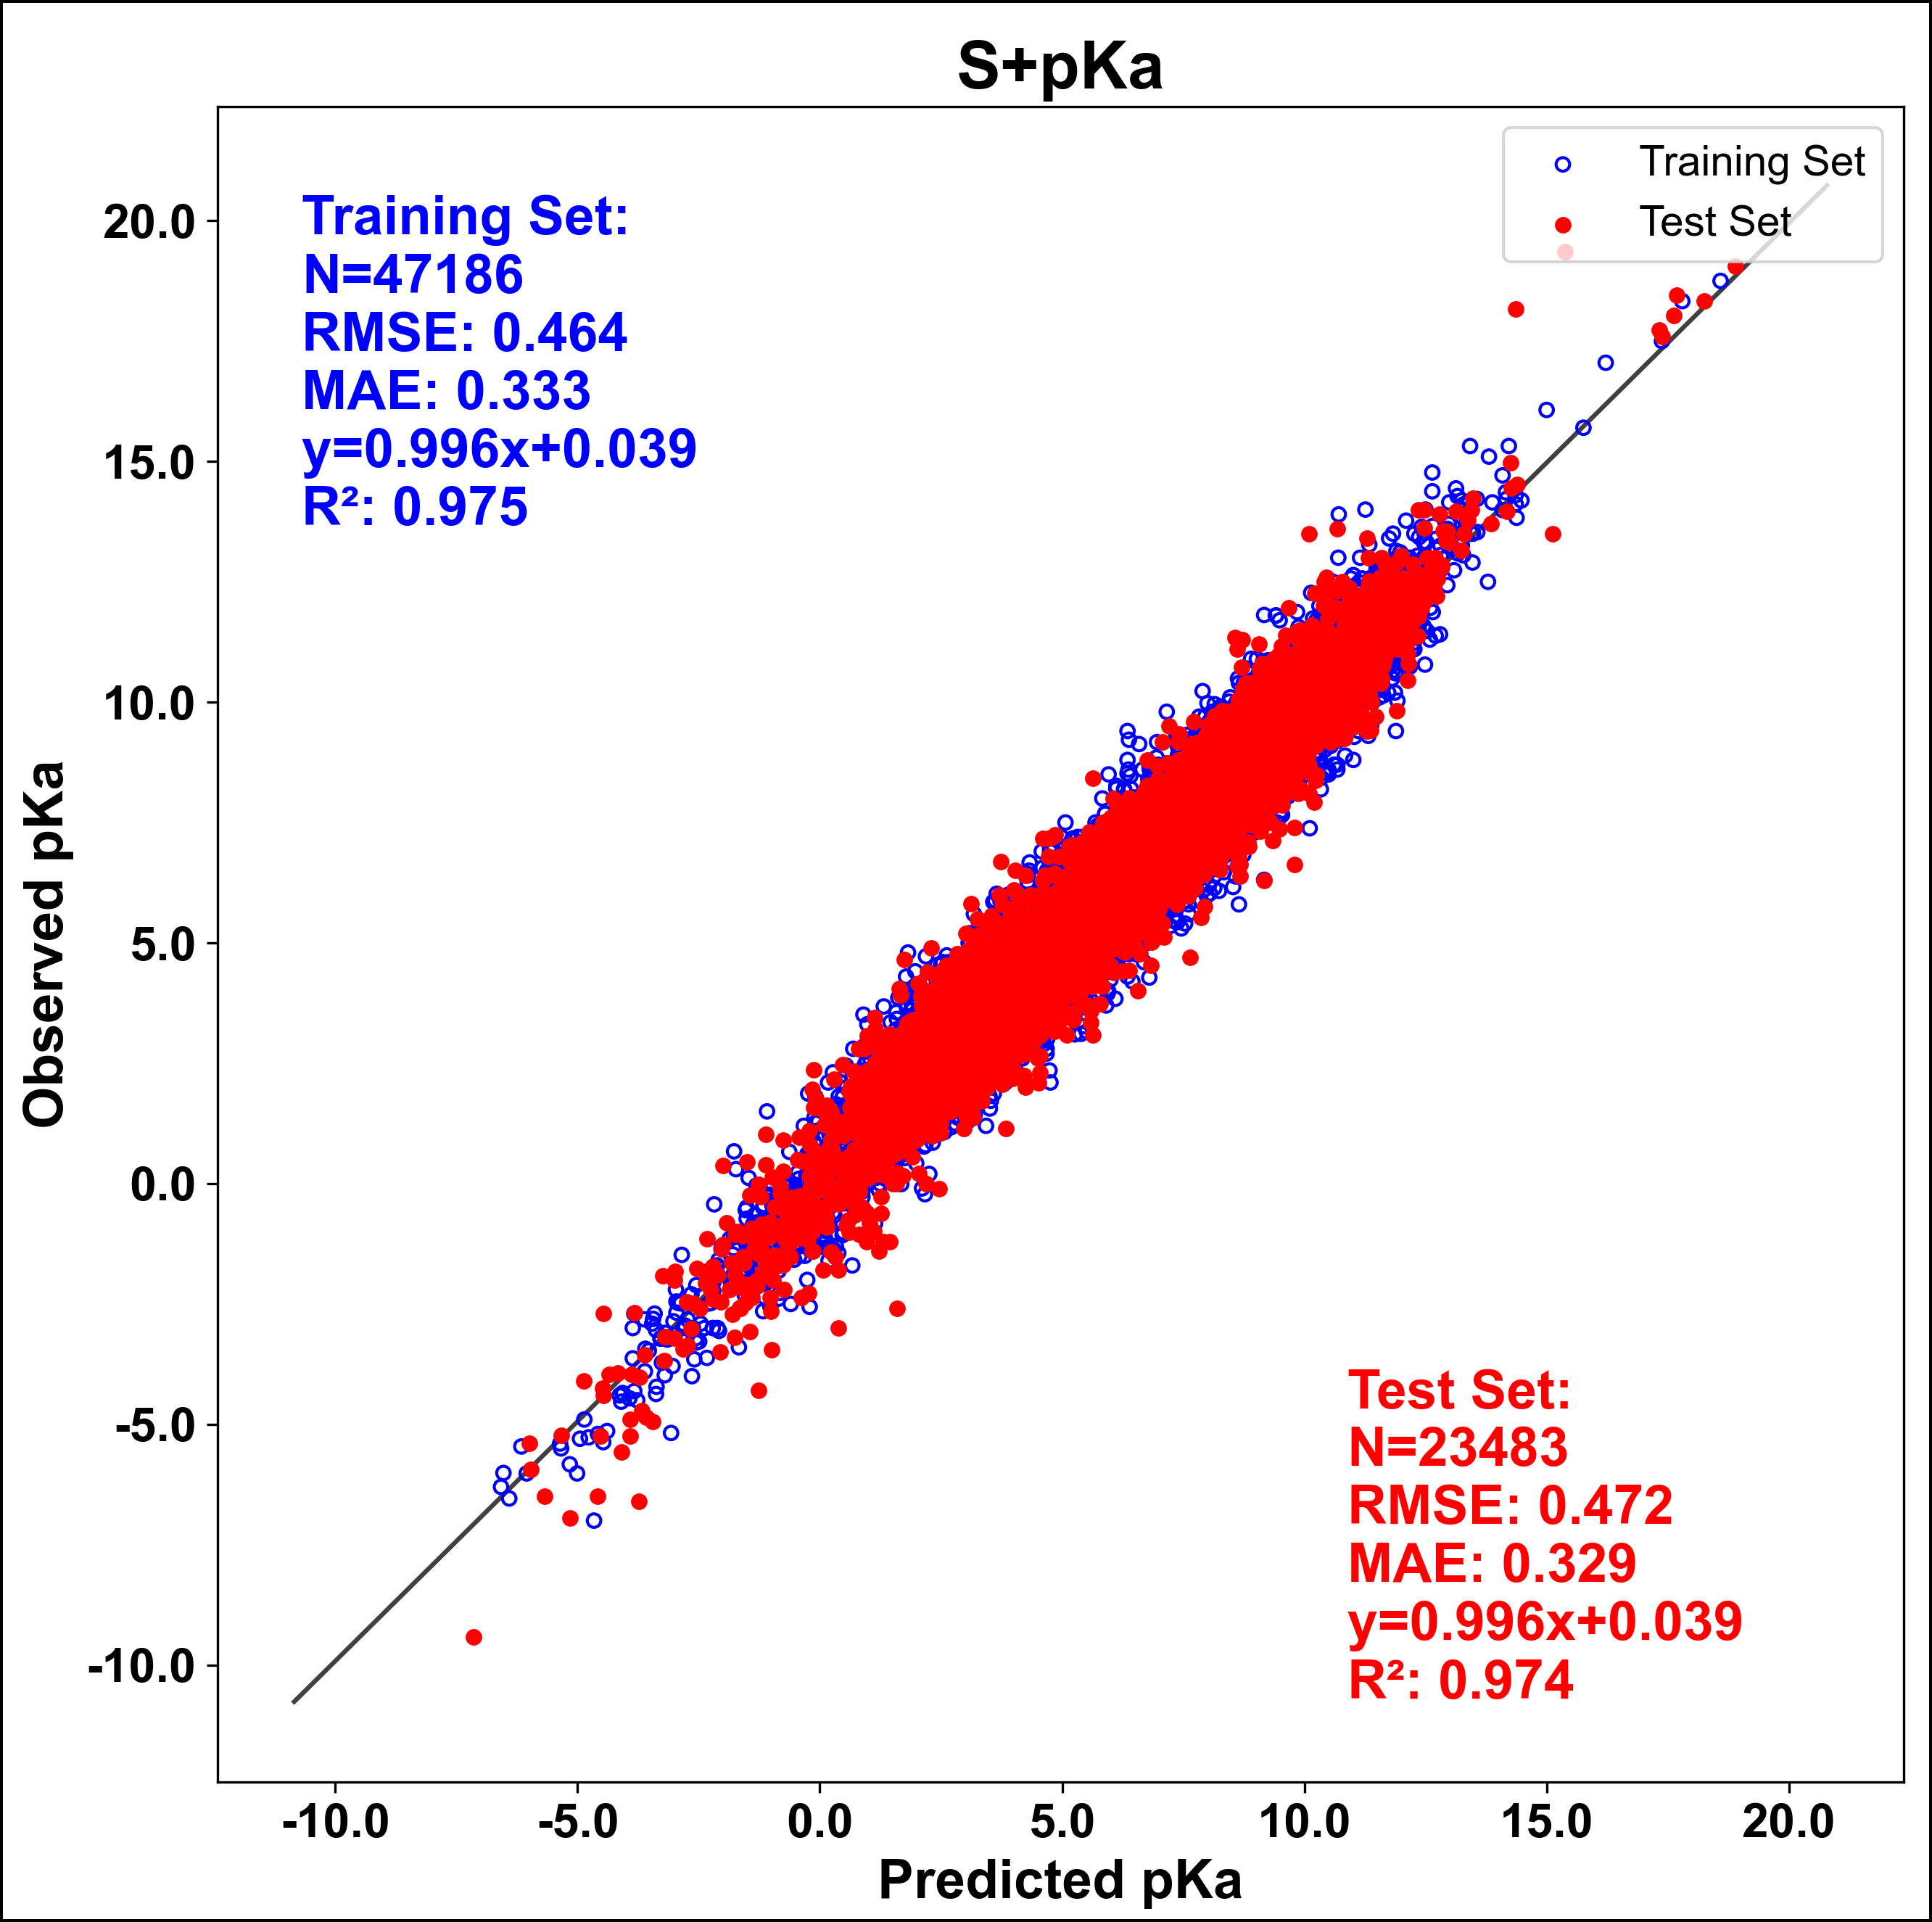
The figure below shows the predictive performance of the S+pKa model in ADMET Predictor. The test set RMSE was 0.472 across the 23,483 pKa values in the full test set. The respective MAE was 0.336. These performance statistics are comparable to those described in our joint publication with Bayer for a series of external validation sets run to test the model.
Carbobases represent an optional model that can be turned on and off in Preferences (Section 1.13). Carbon protonation is not widely appreciated, although the phenomenon has been known since 1950s (Abraham 1959) and extensively studied since 1960s (e.g., Hinman 1962). Substituted pyrroles such as 2,3,4-trimethyl pyrrole, for example, protonate on the α carbon with an observed pKa of 3.94.
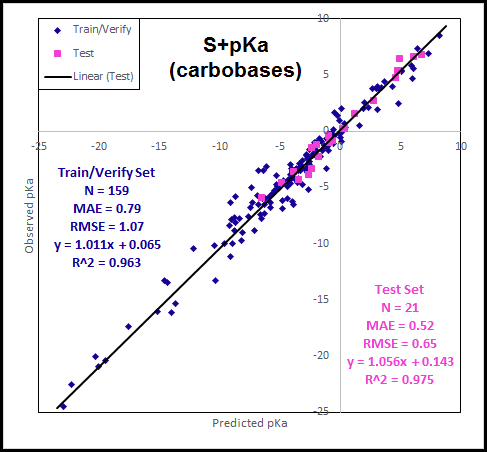
We have collected 180 unique examples of protonated carbon, suitable for modeling. Performance of the carbon protonation model derived from this database is shown below. Somewhat higher RMSE values reflect the higher variability of experimental data for this class of protonation.
The pKa Microstates Window
pKa information can be accessed in several ways, the most informative being through the pKa Microstates Window. Once at least one spreadsheet row has been selected, the window can be launched from the toolbar "pKa" icon (1); via the pull-down menu (TOOLS >> pKa Microstates...;2); by selecting Display in pKa Microstates Window... from the right-click context menu in the spreadsheet (not shown); or from the keyboard by typing Shift+K. In all cases, the microstates displayed will be for the uppermost row selected.
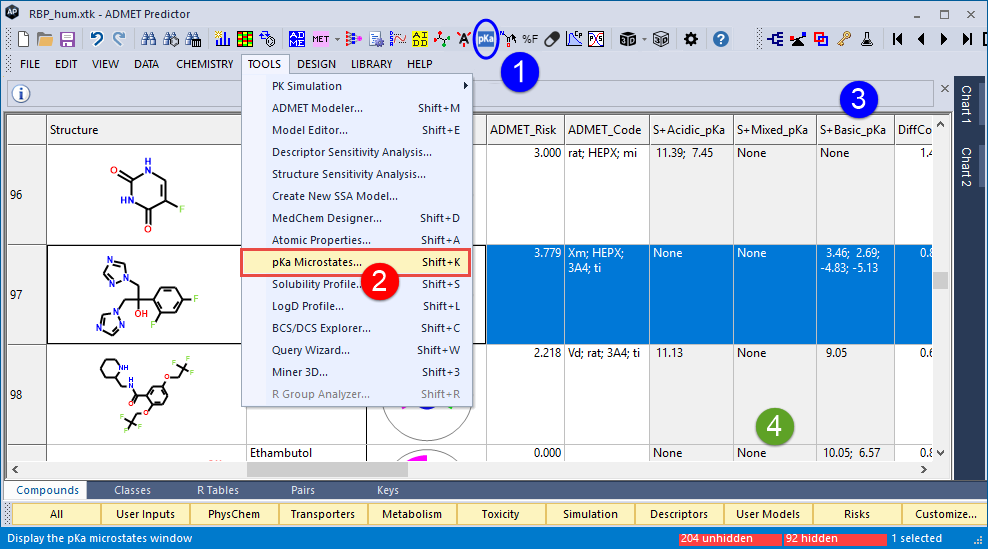
If PhysChem properties have already been calculated, three summary S+pKa attributes - S+Acidic_pKa, S+Mixed_pKa and S+Basic_pKa (4) - will appear in the spreadsheet. Double-clicking in a cell in one of those columns (e.g., 4) will launch the pKa Microstates Window, with the microstates for that row displayed.
The figure below shows the results of using Shift+K with the first row selected. Observable (macroscopic) pKa's are shown at left, bracketed by the macrostate transition to which it corresponds. Each macrostate is defined by the net charge and protonation state of the molecular species that comprise it. Basic transitions - the pKa's colored blue, which contribute entries to the S+Basic_pKa column in the spreadsheet - are ones in which the overall ionization decreases with increasing pH (e.g., the upward transition from HM- to M-2 (1) below). Acidic transitions - those in which overall ionization increases with increasing pH (2) - are colored red.
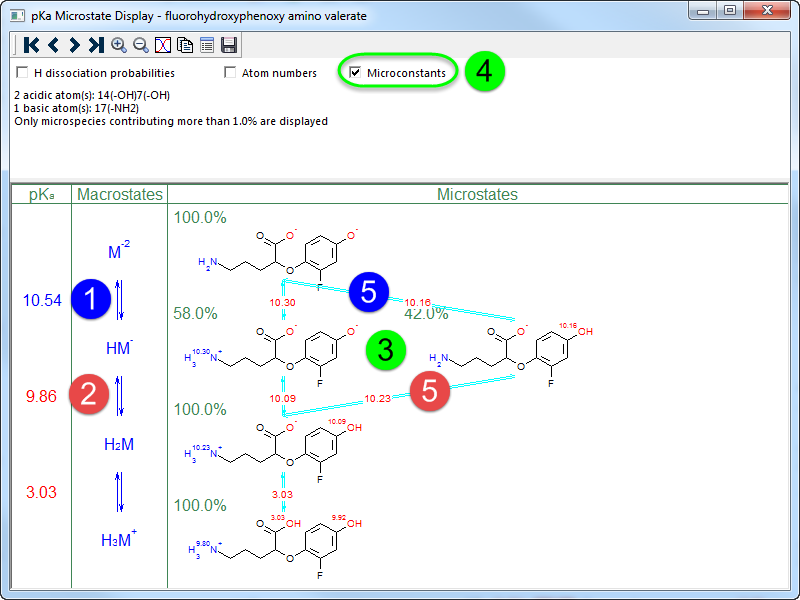
Figure 1
Two tautomeric microstates are shown for the HM- macrostate (3) in Figure 1. The distribution between their concentrations (which is independent of pH) is predicted to be 58:42, with the one bearing more ionized centers dominating the equilibrium. The transition from the dominant species (with three ionized centers) to the single M-2 microstate (which has two ionized centers) represents a reduction in overall ionization and so is basic in nature - the NH3+ is dissociating. The minor HM- microspecies (42%), on the other hand, has one ionized center, so its transition to M-2 is acidic - the phenolic OH is dissociating. In cases where the net change is close to 0 (as would be the case here for a 50:50 ratio), the transition would be categorized as "mixed" and the corresponding pKa would be colored green.
The Microconstants item (4) is OFF by default but has been checked ON in the figure above to show how the displayed microstates relate to one another - i.e., to show their microscopic equilibrium constants (5). Each microconstant represents the gain or loss of a single proton from a specific group. It represents a prediction from just one of ten ANNEs that make up the S+pKa model - the one corresponding to that specific group. The individual microconstant predictions form a system of equations that, when solved, yield the macroscopic pKa's.
The case described above is a good illustration of why "acidic" and "basic" labels can be misleading for multiprotic compounds which, like this one, have ionizable centers with similar microscopic dissociation constants (the phenolic and ammonium microconstants here only range from 10.09 to 10.30). A small change would have flipped the zwitterion:neutral ratio from 58:42 to 42:58, in which case the 10.54 pKa would be labeled as "acidic" and the 9.86 pKa would be "basic." Please see the relevant Theory and Details section for a more in-depth discussion.
Microstates navigation
The microstates display toolbar supports several functions. The first, "back to start" icon (1) displays the microstates distribution for the compound shown in the first row of the spreadsheet, where the fourth "go to end" icon (2) displays the microstates distribution for the compound shown in the last row of the spreadsheet. The icons in between (2) step one row forward (>) or back (<). There are also icons for zooming in and out (4), copying the image to the clipboard (5) and for writing out a summary table of the pKa analysis (6). The ionization chart icon (7) inserts an ionization graph at the right of the window.
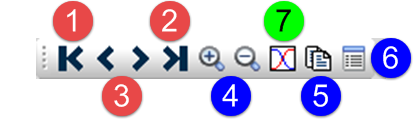
Once you have zoomed in, you can move the image within the frame by moving the mouse while holding down the left mouse button.
Display options summarized in the header can be modified in the Settings dialog (FILE >> Preferences... >> ADMET).
Microstates and Tautomerization
As noted above, tautomeric microstates within a macrostate are in equilibrium, and ADMET Predictor's pKa Microstates Window can be used to predict which will dominate. To do this, it is often useful to display all macrostates, including those secondary microspecies that make up less than 1% of their respective macrostates. These are not displayed by default, but will be shown if the threshold for display is changed in the ADMET tab of the Settings dialog (FILE >> Preferences... or Ctrl+Alt+P). Deprotonation of aliphatic OH and amides is ignored by default, but that can be changed in the Settings dialog as well, as can whether or not to consider potential protonation of aromatic carbons in nitrogen-containing heterocycles.
Turning Microconstants display OFF (1) and setting the minimum contribution to 0.0% (2) for the triprotic fluorophenol example yields the figure below, which shows all 23 = 8 microstates, three of which were hidden by default when the minimum contribution was set to 1%. Just as one might expect, the zwitterionic tautomer completely dominates the neutral (H2M) macrostate. The HM- macrostate is split between a zwitterionic species and the one in which only the carboxylate is ionized. The former is predicted to dominate but a flipped ratio is well within the margin of error for the model.
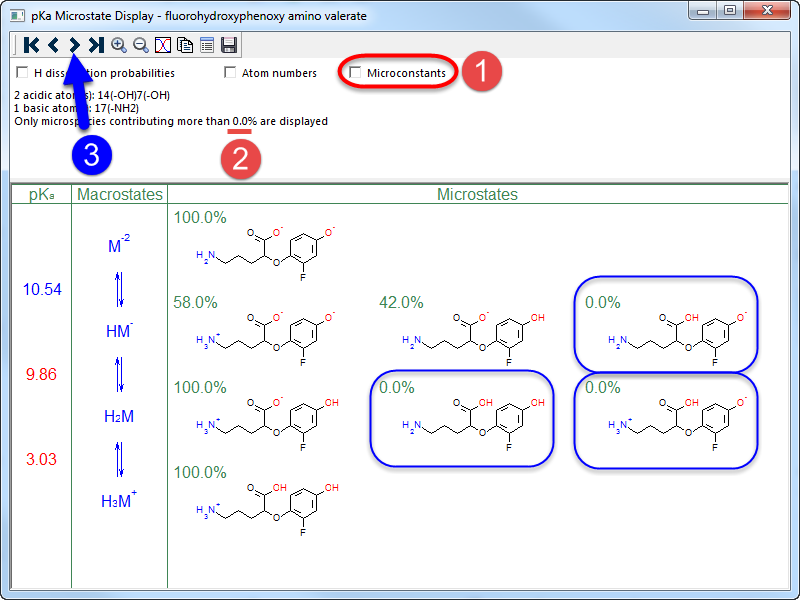
Figure 2
Clicking on the "next" arrow in the toolbar ((3), above) brings 2-hydroxypyridine into the microstates display. ADMET Predictor recognizes that this is actually the minor species at neutral pH and shows 2-pyridone (4) in the microstates display pane as the dominant species - which is correct.
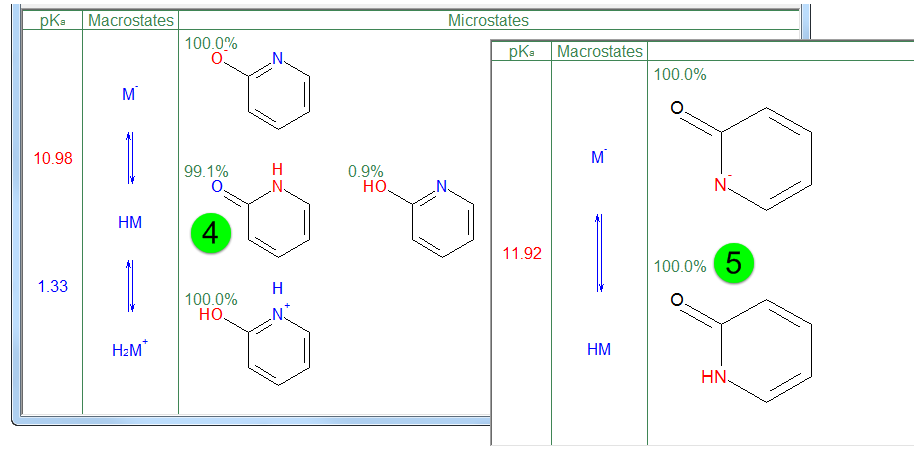
S+pKa estimates microconstants based on atomic descriptors calculated for the input structure. Different input structures generally yield different atomic descriptor values, so the exact proportions predicted for the various microspecies currently vary somewhat. In fact, entering 2-pyridone as the input structure yields a higher predicted acidic pKa (5). The pyridinium and hydroxypyridine are absent in this case because we do not currently have an S+pKa model for carbonyl protonation. Nonetheless, the latter pKa (11.92) is a more accurate value. If the input structure does not correspond to the dominant species, you should modifying the spreadsheet entry accordingly and re-launch the microstates window.
You can confirm tautomeric dominance by looking at predicted pKa's. Suppose tautomers "H-A" and "A-H" are in equilibrium with a shared microspecies A- and the pKa predicted for H-A (pKa1) is less than the pKa predicted for A-H (pKa2). All three species are at equilibrium, so at pH=pKa1, the concentrations of H-A and A- ("[H-A]" and "[A- ]") will be equal. [A-H] will be less than [A-], however, and therefore less than [H-A]. H-A is therefore the dominant tautomer and will be irrespective of pH.
In general, the acid with the higher pKa predominates. The reverse is true for basic tautomers - the one with the lower pKa will dominate. Things are more complicated when more than two tautomers are involved, but this rule of thumb can be useful for resolving cases where some microspecies are not accounted for.
Ionization charts
Clicking on the ionization chart icon (1) in the pKa Microstate Display for fluorophenoxy aminovalerate (see Figure 1) adds an Ionization Chart pane to the window that shows the distribution of microstates across pH values. This pane provides access to a cycle of pH profile plots, starting with Microstate Distributions and progressing through Macrostate Distributions, Bjerrum and Formal Charge plots for the behavior of the molecule as a whole to averaged single proton acidity plots (ASPA and ASP) that focus on individual ionizable centers within the molecule.
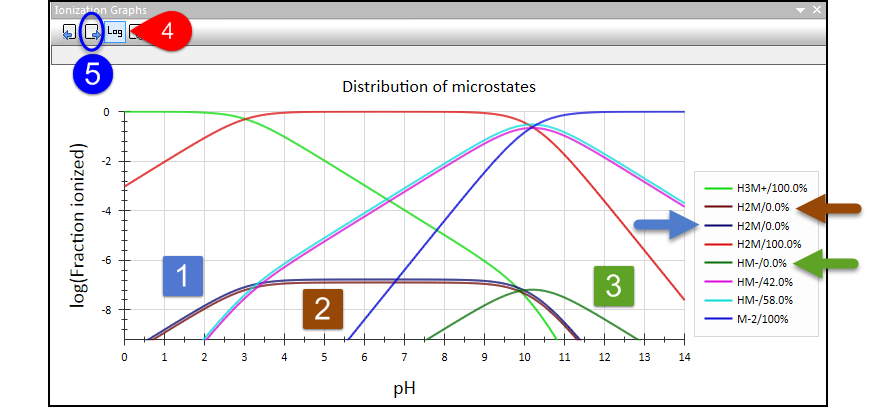
Minimizing the size of the window by dragging the corner (2) inward yields the display shown below, in which each line represents the concentration of one microspecies. The percentages shown in the Microstates Distribution legend (3) indicate the tautomeric prevalence of each.
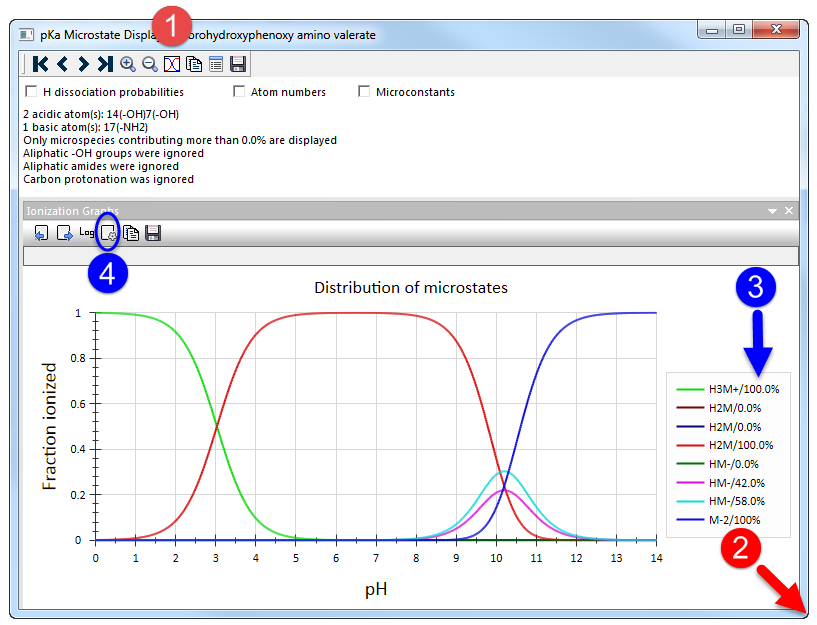
Such plots can provide useful insights for structure-based design programs. Specific microspecies typically bind to a target but the equilibrium concentration of the most tightly bound species in solution can limit Km and Ki.
As indicated above (Figure 2), several microspecies of this compound are present at very low concentration. They are marked as "0.0%" in the Microstates Distribution legend but they are of necessity present at some finite concentration. Clicking on the Log icon (4) in the Ionization Chart toolbar toggles the y axis in the plots back and forth between linear (the default) and logarithmic scales. For our aminovalerate derivative, this yields the plot shown below, where the three minor microspecies ([1-3]) are quite evident.
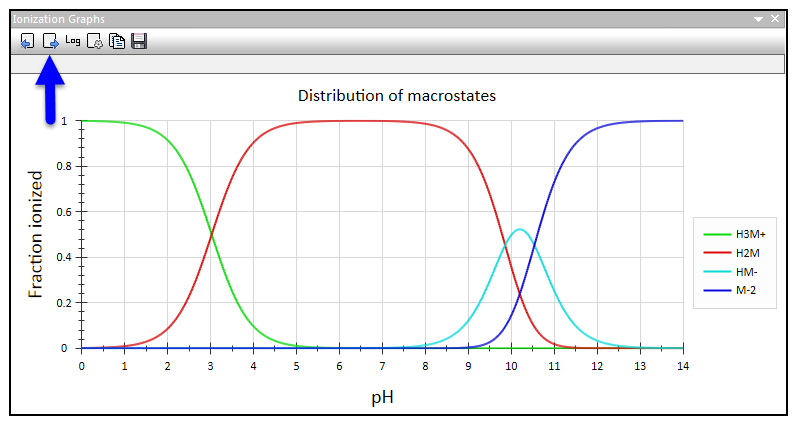
Toggling back to linear scaling (4) and clicking on the "Next plot" icon on the Ionization Chart toolbar (5) shifts to a display of Macrostate Distributions, in which the curves are sums of the constituent microstate concentrations.
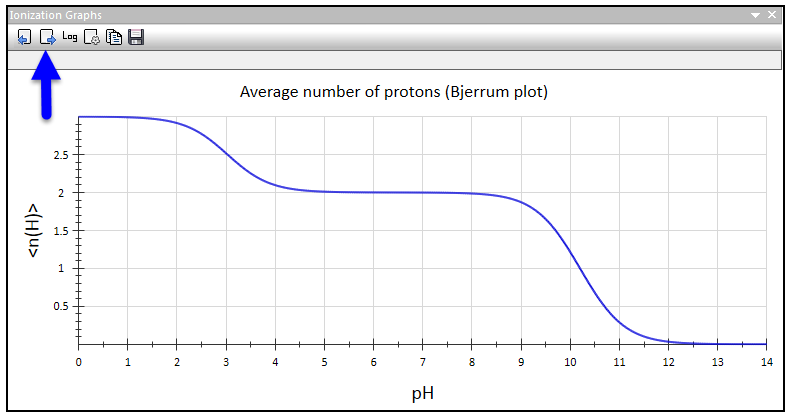
The next display in the sequence is the Bjerrum plot, which shows the number of dissociable protons remaining on the molecule as a function of pH.
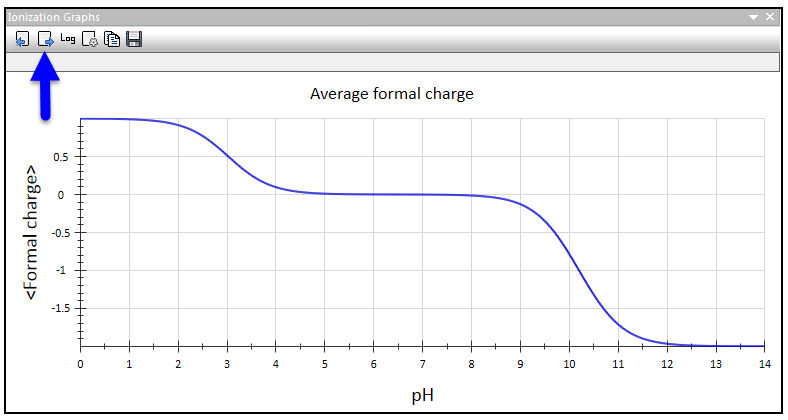
The Formal Charge plot indicates the pH profile for the formal charge on a molecule.
The acidity of a particular group in a molecule can vary - sometimes quite markedly - as other ionizable groups in the molecule protonate or deprotonate. The patterns of such changes are displayed graphically in the averaged single proton acidities (ASPA) plot that comes next in the Ionization Plot cycle. Protonation of the amino group in aminovalerate at low pH, for example, increases the acidity of the carboxylic acid and phenol groups.
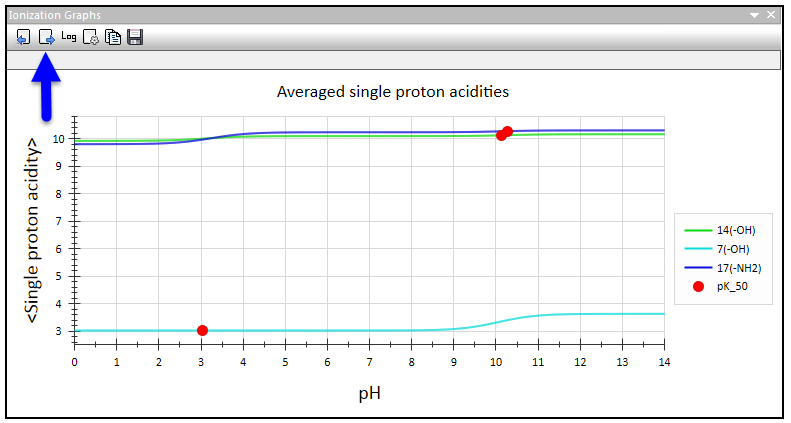
The final plot in the series is the averaged site protonation (ASP) plot shown below, which lays out the titration profiles for individual acidic and basic centers. In some rare cases the ASP plots can be quite unusual suggesting chameleonic character of certain ionizable atoms (Fraczkiewicz 2023(b)). The midpoints of these titration profiles (i.e., pH values at which the ASP curves cross the 50% occupation) are indicated by red dots and labeled as pK_50 values. These represent a true acidity or basicity of individual ionizable groups and shown to be useful parameters in, e.g., drug discovery and development. (Fraczkiewicz 2023)
In our aminovalerate example, the centers are well-separated in space and relatively well insulated from each other electronically, so the plot shown below looks simple. It can nonetheless be very informative in structure-based design work, where knowing the pH at which a particular center is half-protonated is often key to understanding ligand binding. The pK50s for the phenolic OH (red line) and the amino group (blue line) lie at 10.12 and 10.27, respectively. These values are considerably closer together than the macroscopic pKa's (9.86 and 10.54; see Figure 1) and more accurately reflect the actual protonation status of the two centers.
Many quite common groups - most notably piperazines - are prone to such effects and can have very complicated ASP plots. See the Property Theory and Details section on multiprotic ionization for discussion of just such complicated scenarios.
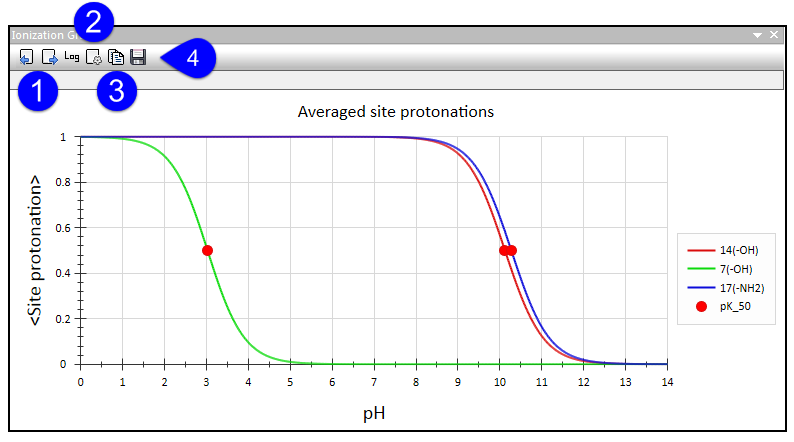
pK50s can be displayed in a text window (“Dissociation midpoints”) by double-clicking anywhere on the plot or overlaid on molecular structure in the Electronic section of atomic properties as well as in the spreadsheet's column S+pK50.
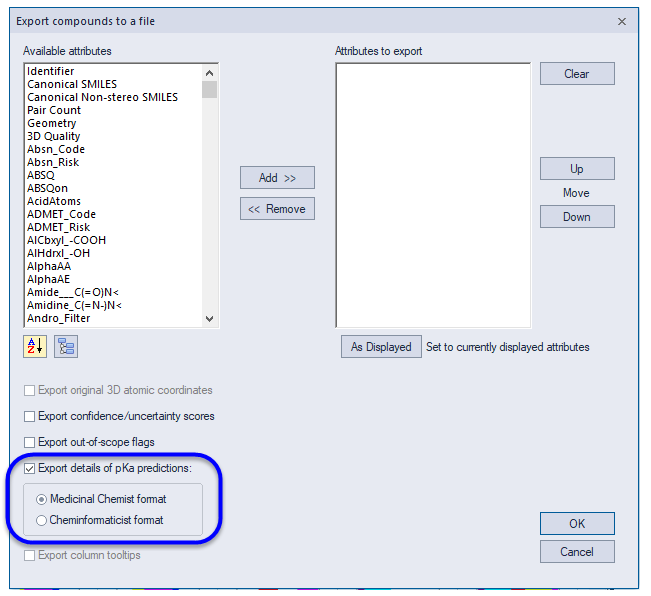
pK50s can be exported by selecting the Medicinal Chemist workflow option at the command line (-w MC) or the Medicinal Chemist option under Export details of pKa predictions in the Export compounds to a file dialog, which is accessed via File >> Export... after selecting an SDF file destination.
The "Previous plot" and "Next plot" icons at the left of the Ionization Plots toolbar (1) allow you to move around the plot cycle, whereas the "Log" icon toggles the y axis between linear and logarithmic scales. The Settings icon (2) allows you to control which curves are displayed and to control the x and y axis ranges for the plots; it is not operative for the Bjerrum or Formal Charge plots. There is also an icon for copying the image to the clipboard (3) or saving it to disc as a bitmap (4).