2.4.4. Permeability
The section covers the ADMET Predictor models relevant to predicting permeability, including models of passive permeability: MDCK Low Expression cell layer permeability (S+MDCK-LE), Parallel Artificial Membrane Permeability Assay (PAMPA), and effective permeability in human jejunum (S+Peff and SimplePeff); and active permeability: Madin-Darby canine kidney cell layer permeability (S+MDCK), MDCK-MDR1 cells, and Caco-2 cells. Models are provided for skin and corneal permeability ([Perm_Skin] and [Perm_Cornea]) as well as for the aqueous diffusion coefficient (DiffCoef). Combining predictions of the ability to penetrate the blood-brain barrier ([BBB_Filter]) with the predicted retention in the brain once taken up (logBB) makes it possible to anticipate whether or not a given compound is likely to be active in the central nervous system CNS).
All of the PAMPA and cell line permeability models are new or rebuilt for AP14 and are explicitly created to cover bRo5 compounds, including PROTACs, cyclic peptides, and macrocycles. The number of bRo5 and total compounds are listed in the description of each model below.
Bear in mind that many of these permeability assays have significant lab-to-lab variability. If predictions are not as accurate as you would like, it is highly recommended to build a DELTA modelTM to account for inter-lab variability.
PAMPA permeability
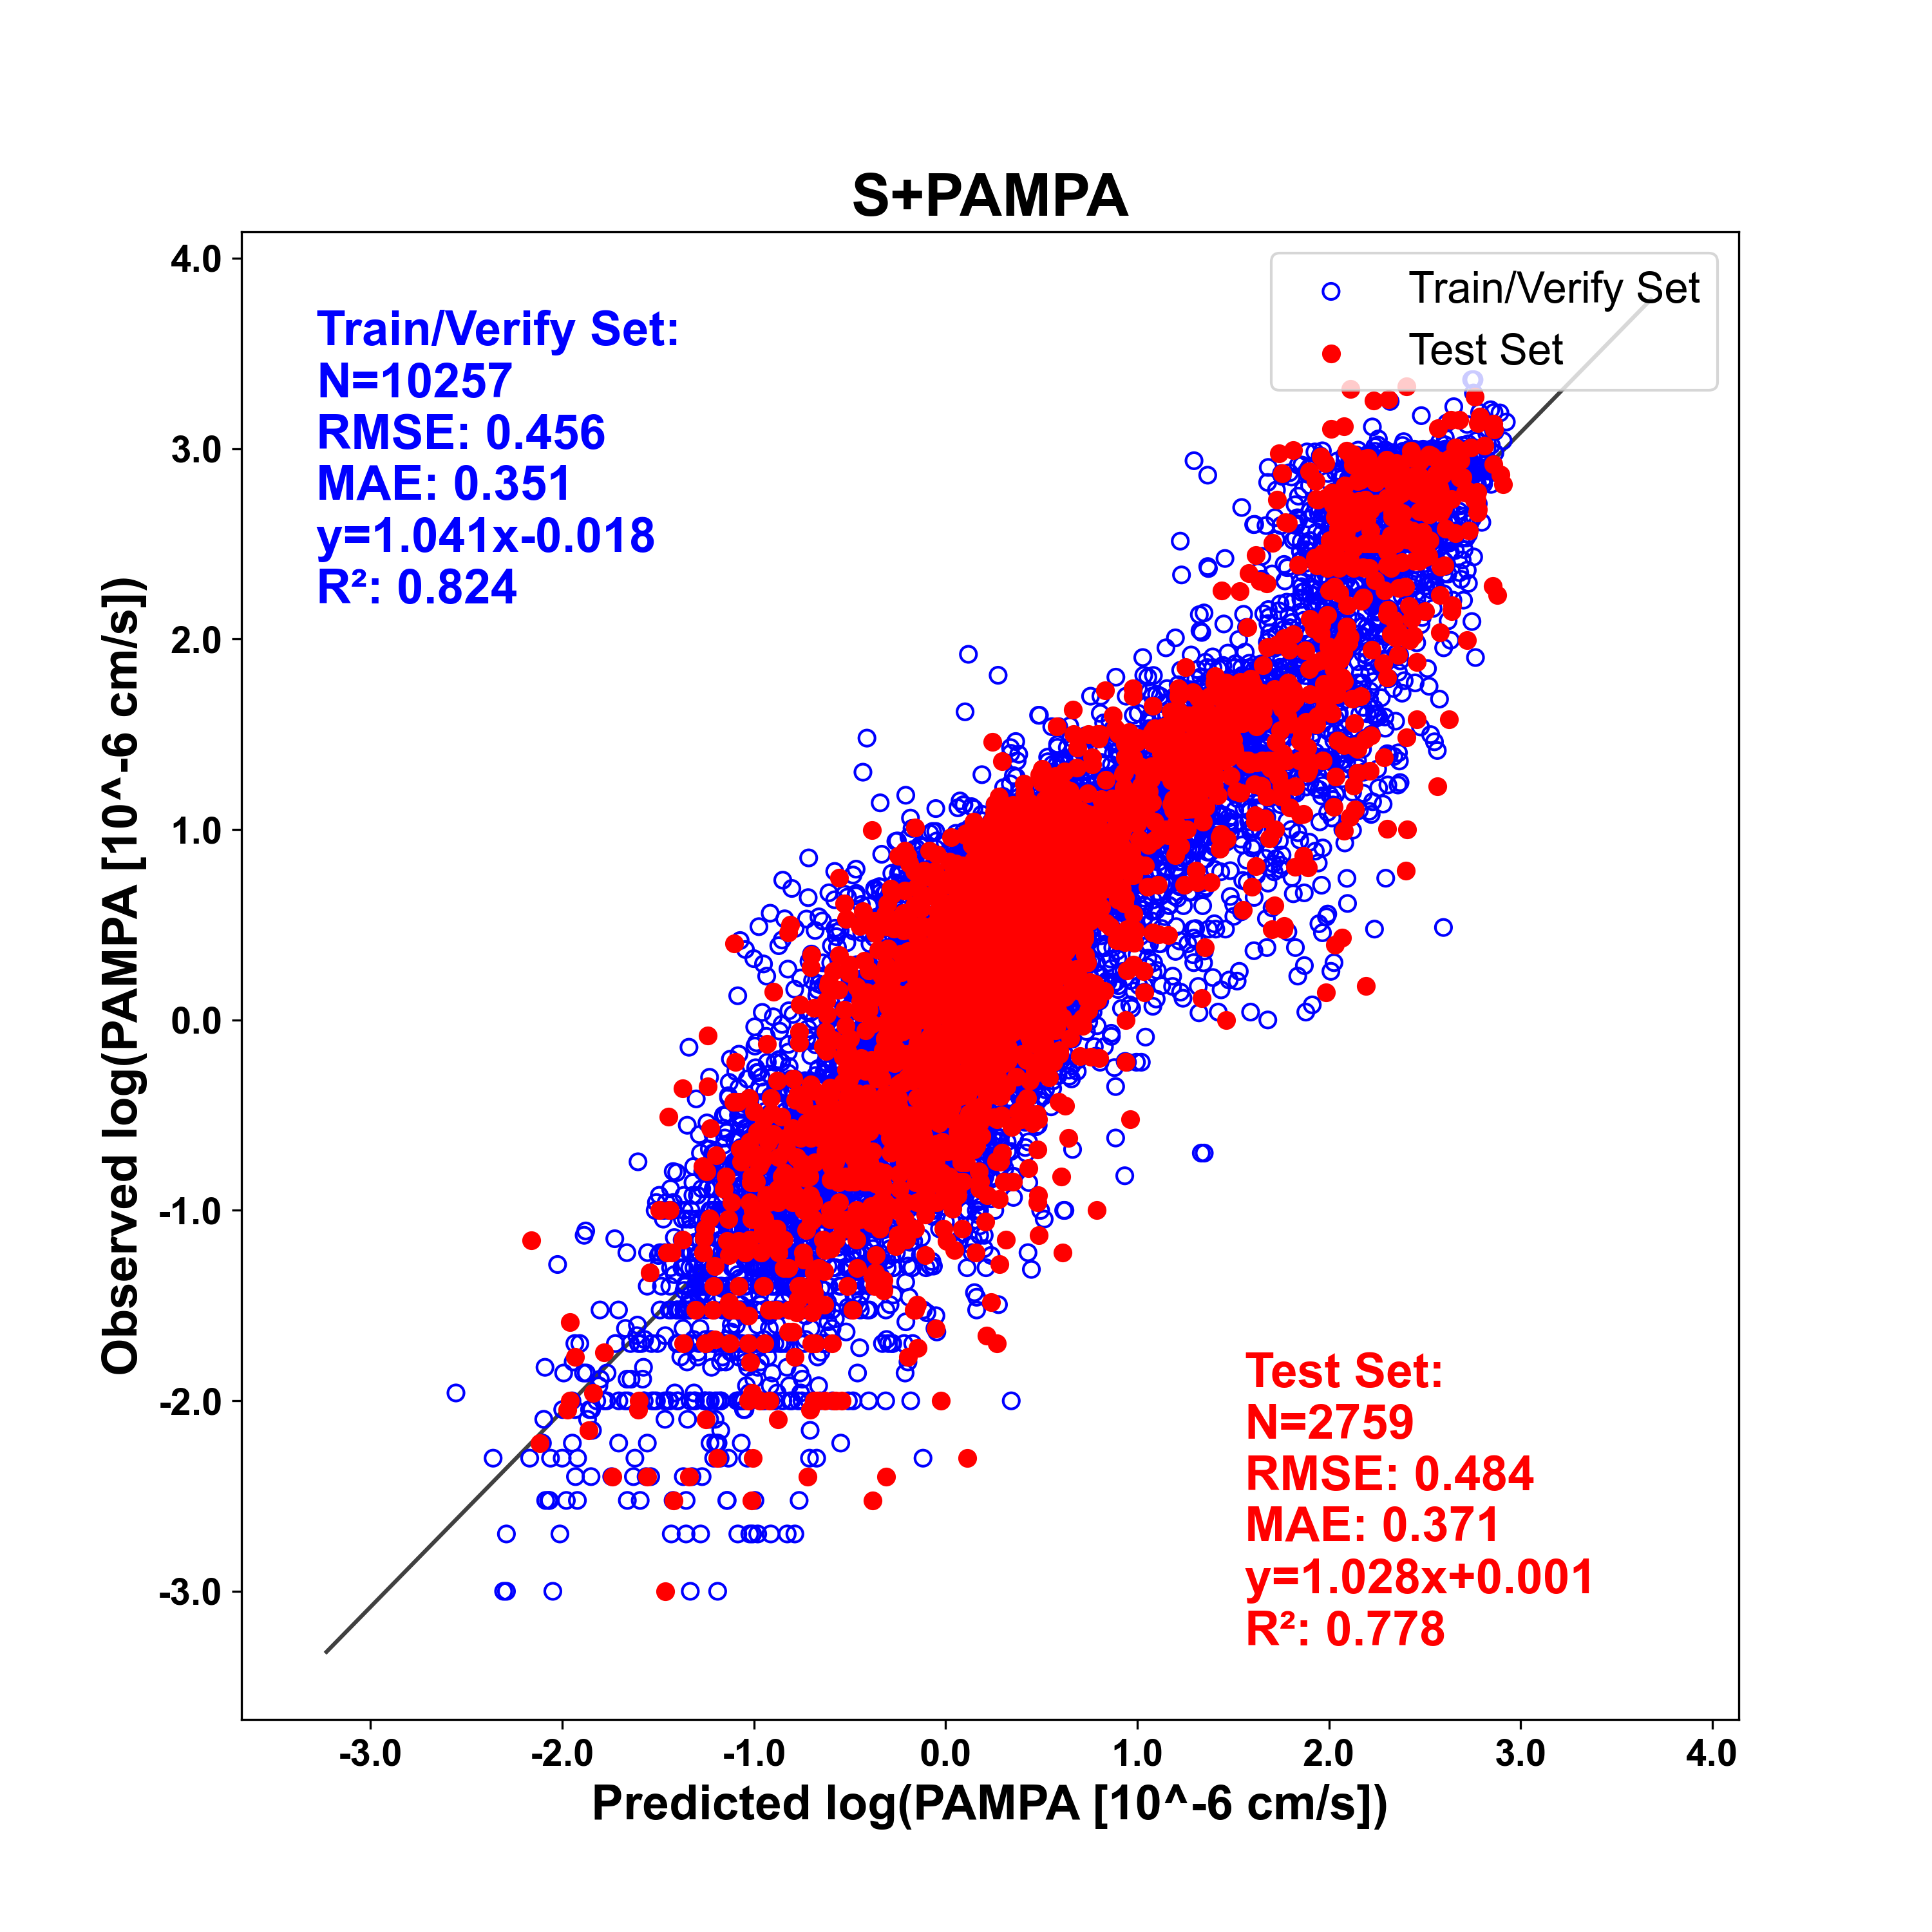
The S+PAMPA passive diffusion permeability regression model includes a total of 13,016 compounds from various sources, including NCATS, the Cyclic Peptide Membrane Permeability Database (CycPeptMPDB) (Li 2023) and the Nonpeptidic Macrocycle Permeability Database (Feng 2025). Of these, over 10,000 broke at least one Ro5, including 25 PROTACs, 2399 nonpeptidic macrocycles and 8144 cyclic peptides. The model was built on the log transformed values of the data, but predicted values are converted back to linear space in the ADMET Predictor spreadsheet. The number of compounds used for training and test sets, as well as quality metrics are shown in the figure below.
Caco-2 Papp A→B, B→A, and Efflux Ratio (ER):
Caco-2 apparent permeability (Papp) measures the rate of drug transport across a Caco-2 cell monolayer: A→B (apical to basolateral; AB) reflects intestinal absorption potential, while B→A (basolateral to apical; BA) reflects potential efflux or secretion. The Efflux Ratio (ER = Papp B→A / Papp A→B) indicates whether a compound is a substrate for efflux transporters (e.g., P-gp), with values >2 typically suggesting active efflux involvement.
Building models which combine Caco-2 data from multiple labs is notoriously difficult, as this model displays high lab-to-lab variability. With that in mind, we focused on three primary data sources for which there was good agreement in measurements (Kamiya et al 2022, Qiao and Van Voorhis) and added in several small datasets containing bRo5 molecules. Because of the more narrow focus of these models and known lab variability, we highly advise the use of DELTA models for extrapolation from internal data.
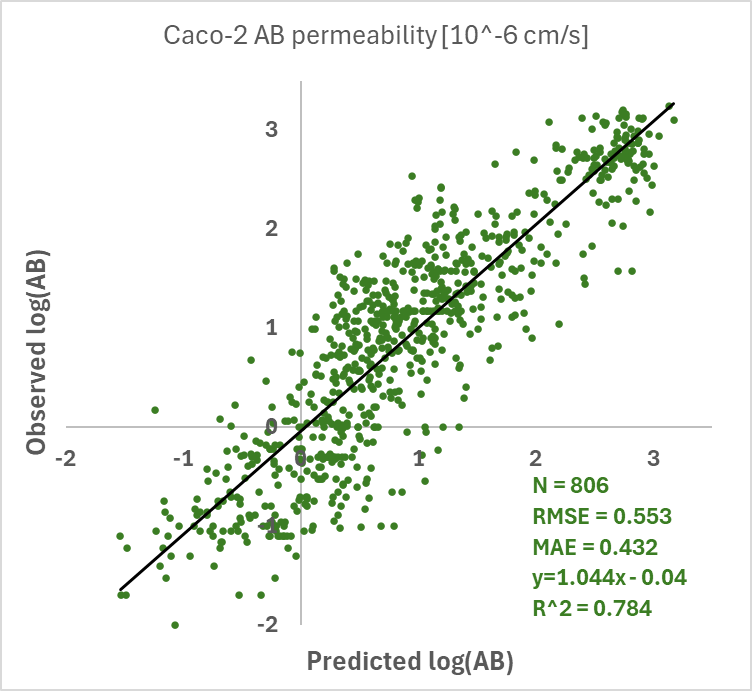
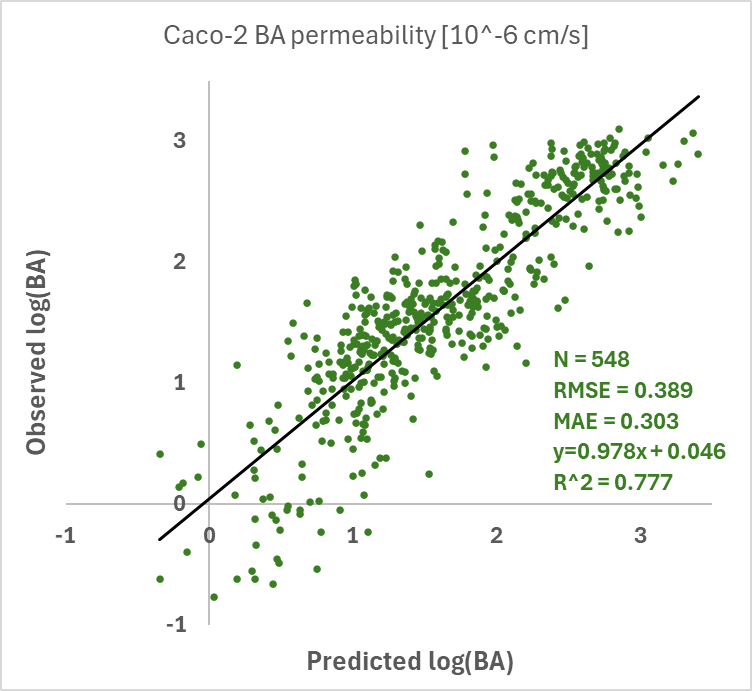
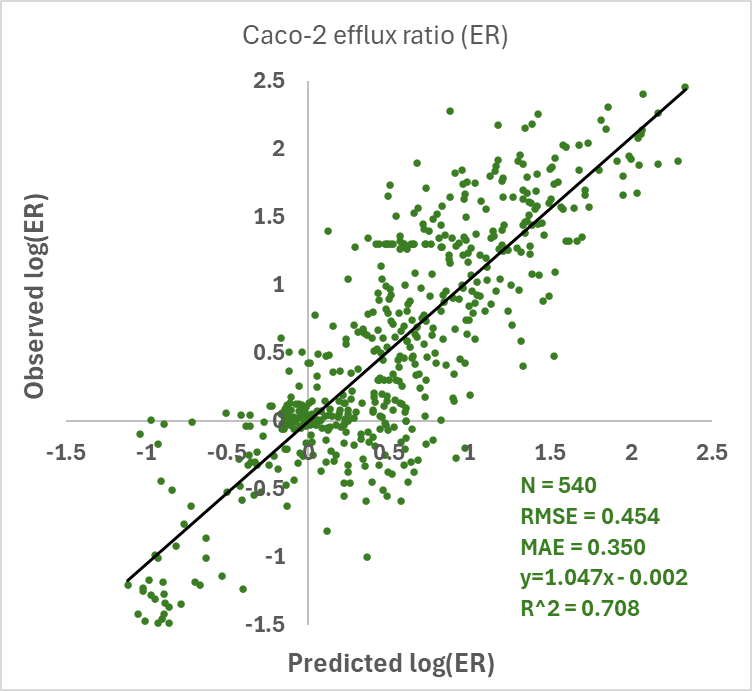
The A→B model contains 807 total compounds, of which 429 broke at least one Ro5, including 8 PROTACs, 85 macrocycles and 242 cyclic peptides. The B→A model contains 548 total compounds, of which 258 broke at least one Ro5, including 9 PROTACs, 164 macrocycles and 103 cyclic peptides. The ER model contains 541 total compounds, of which 212 broke at least one Ro5, including 6 PROTACs, 143 macrocycles and 122 cyclic peptides.
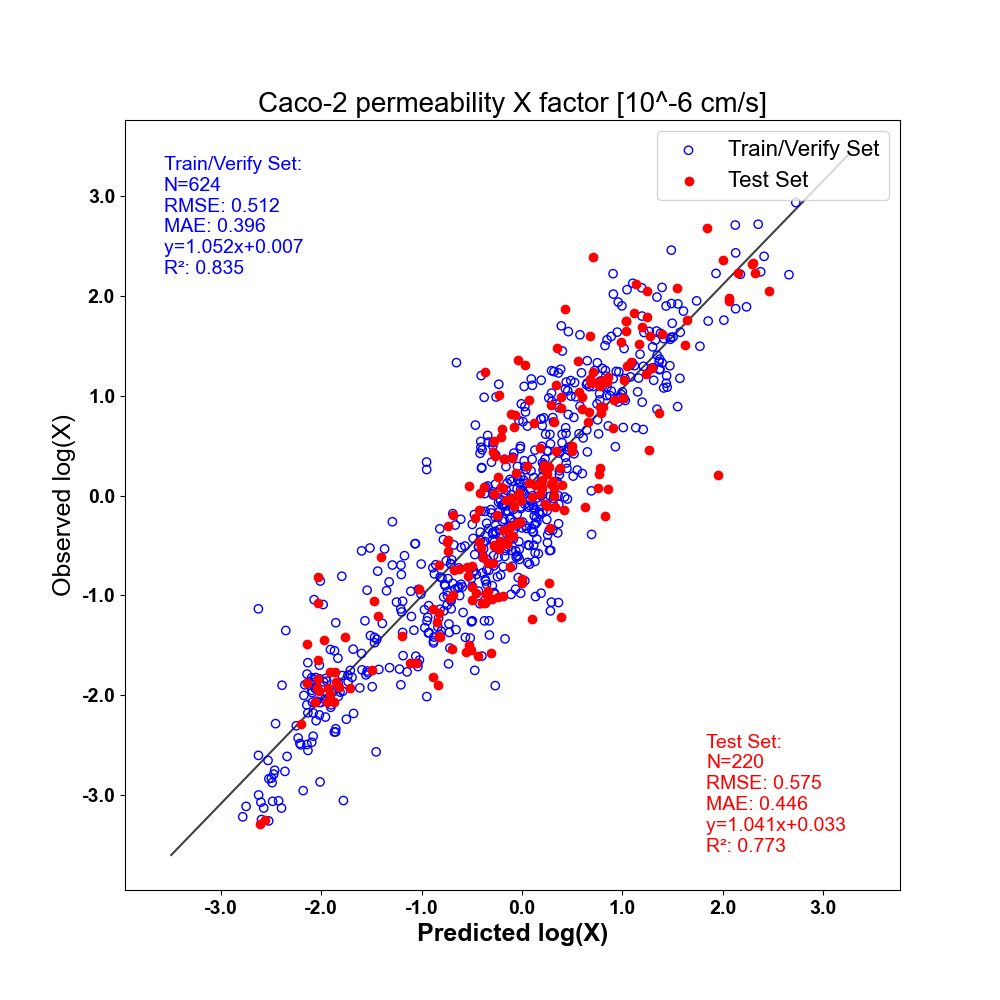
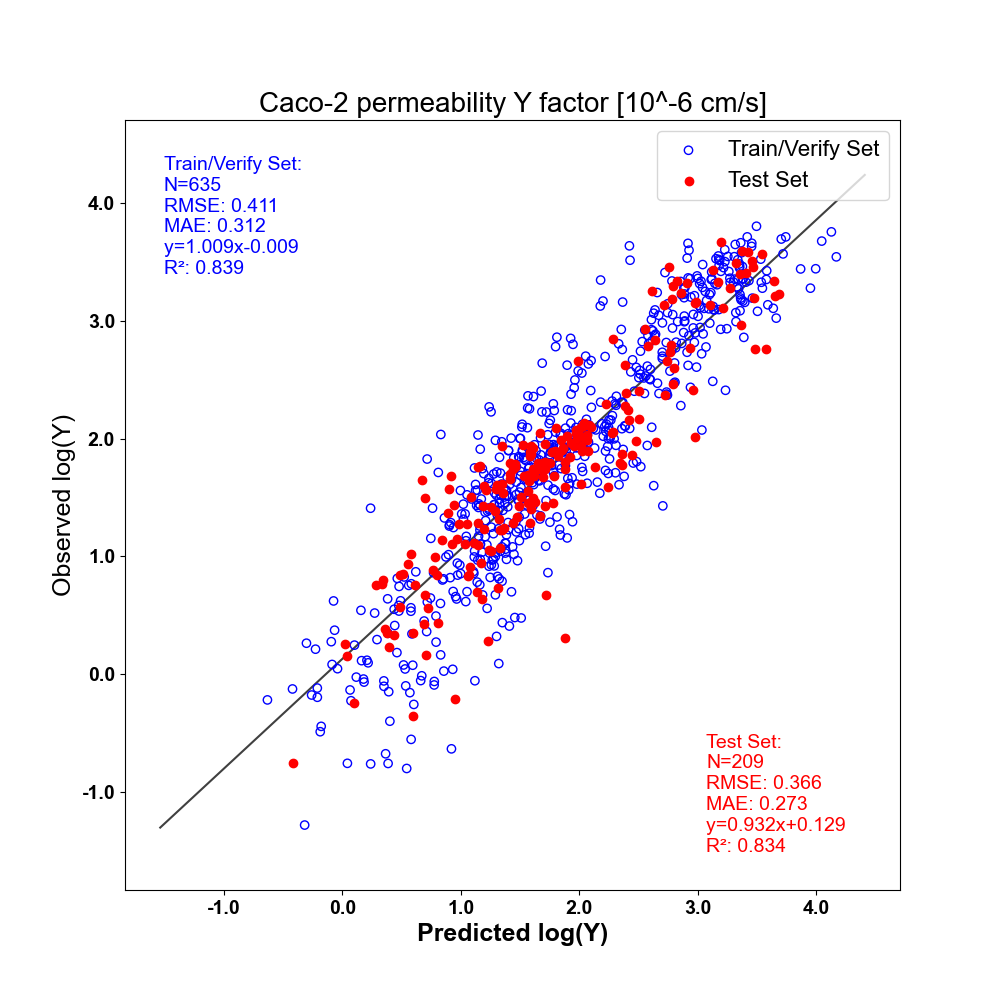
The following models were built with a special methodology to guarantee the expected ER = BA / AB relationship. The methodology is described in Section 3.4. It involved development of two independent ANNE models of the permeability X and Y factors calculated from the observed data (in 10-6 cm/s). Consequently, validation plots are shown below for these factors:
Naturally, it is the final endpoints that are of interest. However, since the ER, BA, and AB were derived from X and Y, the resulting performance plots no longer contain Train/Verify/Test distinction:
MDCK permeability
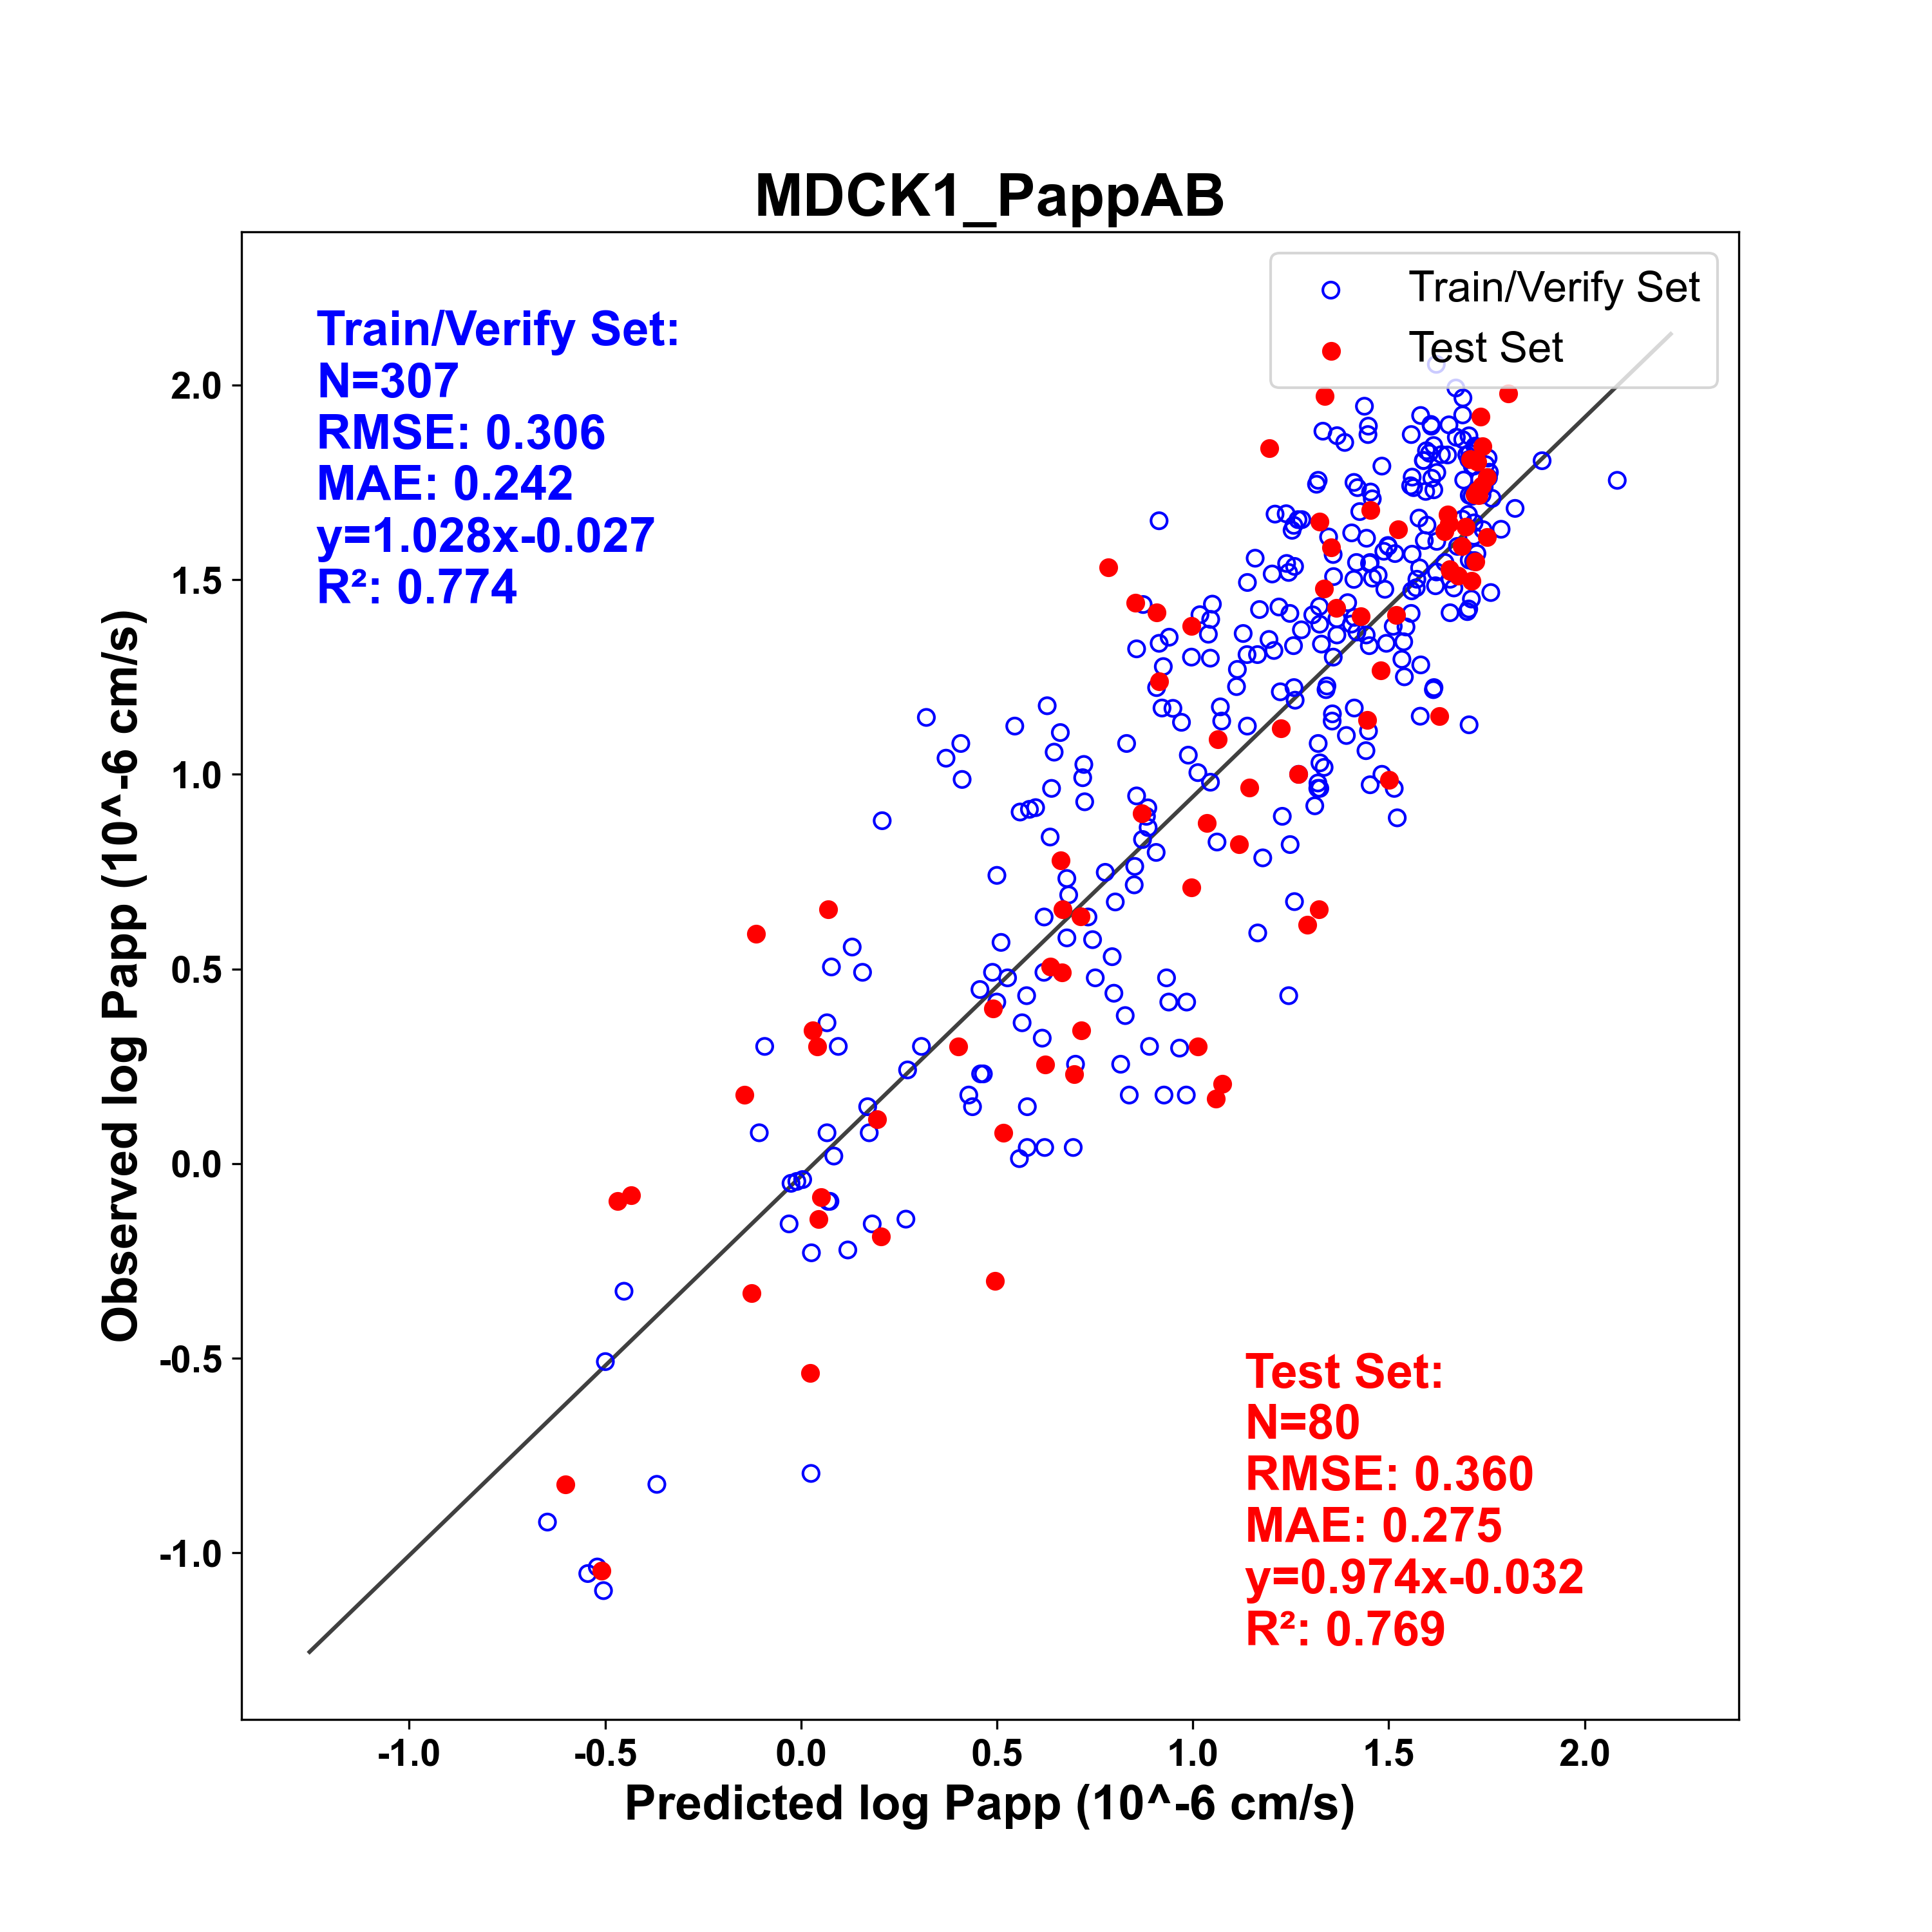
Our S+MDCK models predict apparent permeability (Papp) for Madin-Darby Canine Kidney cells. They are based on data obtained at Affymax, Inc., using their patented cells-on-sheet (COS) technology (US patent 6,043,027). The system used a single sheet of cultured epithelial cells sandwiched between an array of reservoir wells on the apical side and a complementary array of receiving wells on the basolateral side. This arrangement allowed for the collection of in vitro Papp data with greater throughput, consistency, and reproducibility than the traditional Transwell™ apparatus. Unfortunately, the system was not adopted by others and is no longer available. Because the same group had published Transwell™ results on many of the same compounds, however (Irvine 1999), we were able to determine that the two are log-log linear and so, as of version 8.0, have recalibrated the output to match that expected for today's standard assay system. Compounds from different sources were combined and for compounds that were in more than one dataset, the median value was used. The final dataset of 387 compounds contains 343 compounds assayed by Affymax, Inc, and has a total of 86 compounds that break at least one Ro5, including 48 macrocycles. Permeability data is reported in units of 10-6 cm/s and the number of compounds used for training and test sets, as well as quality metrics are shown in the figure below.
MDCK-LE permeability
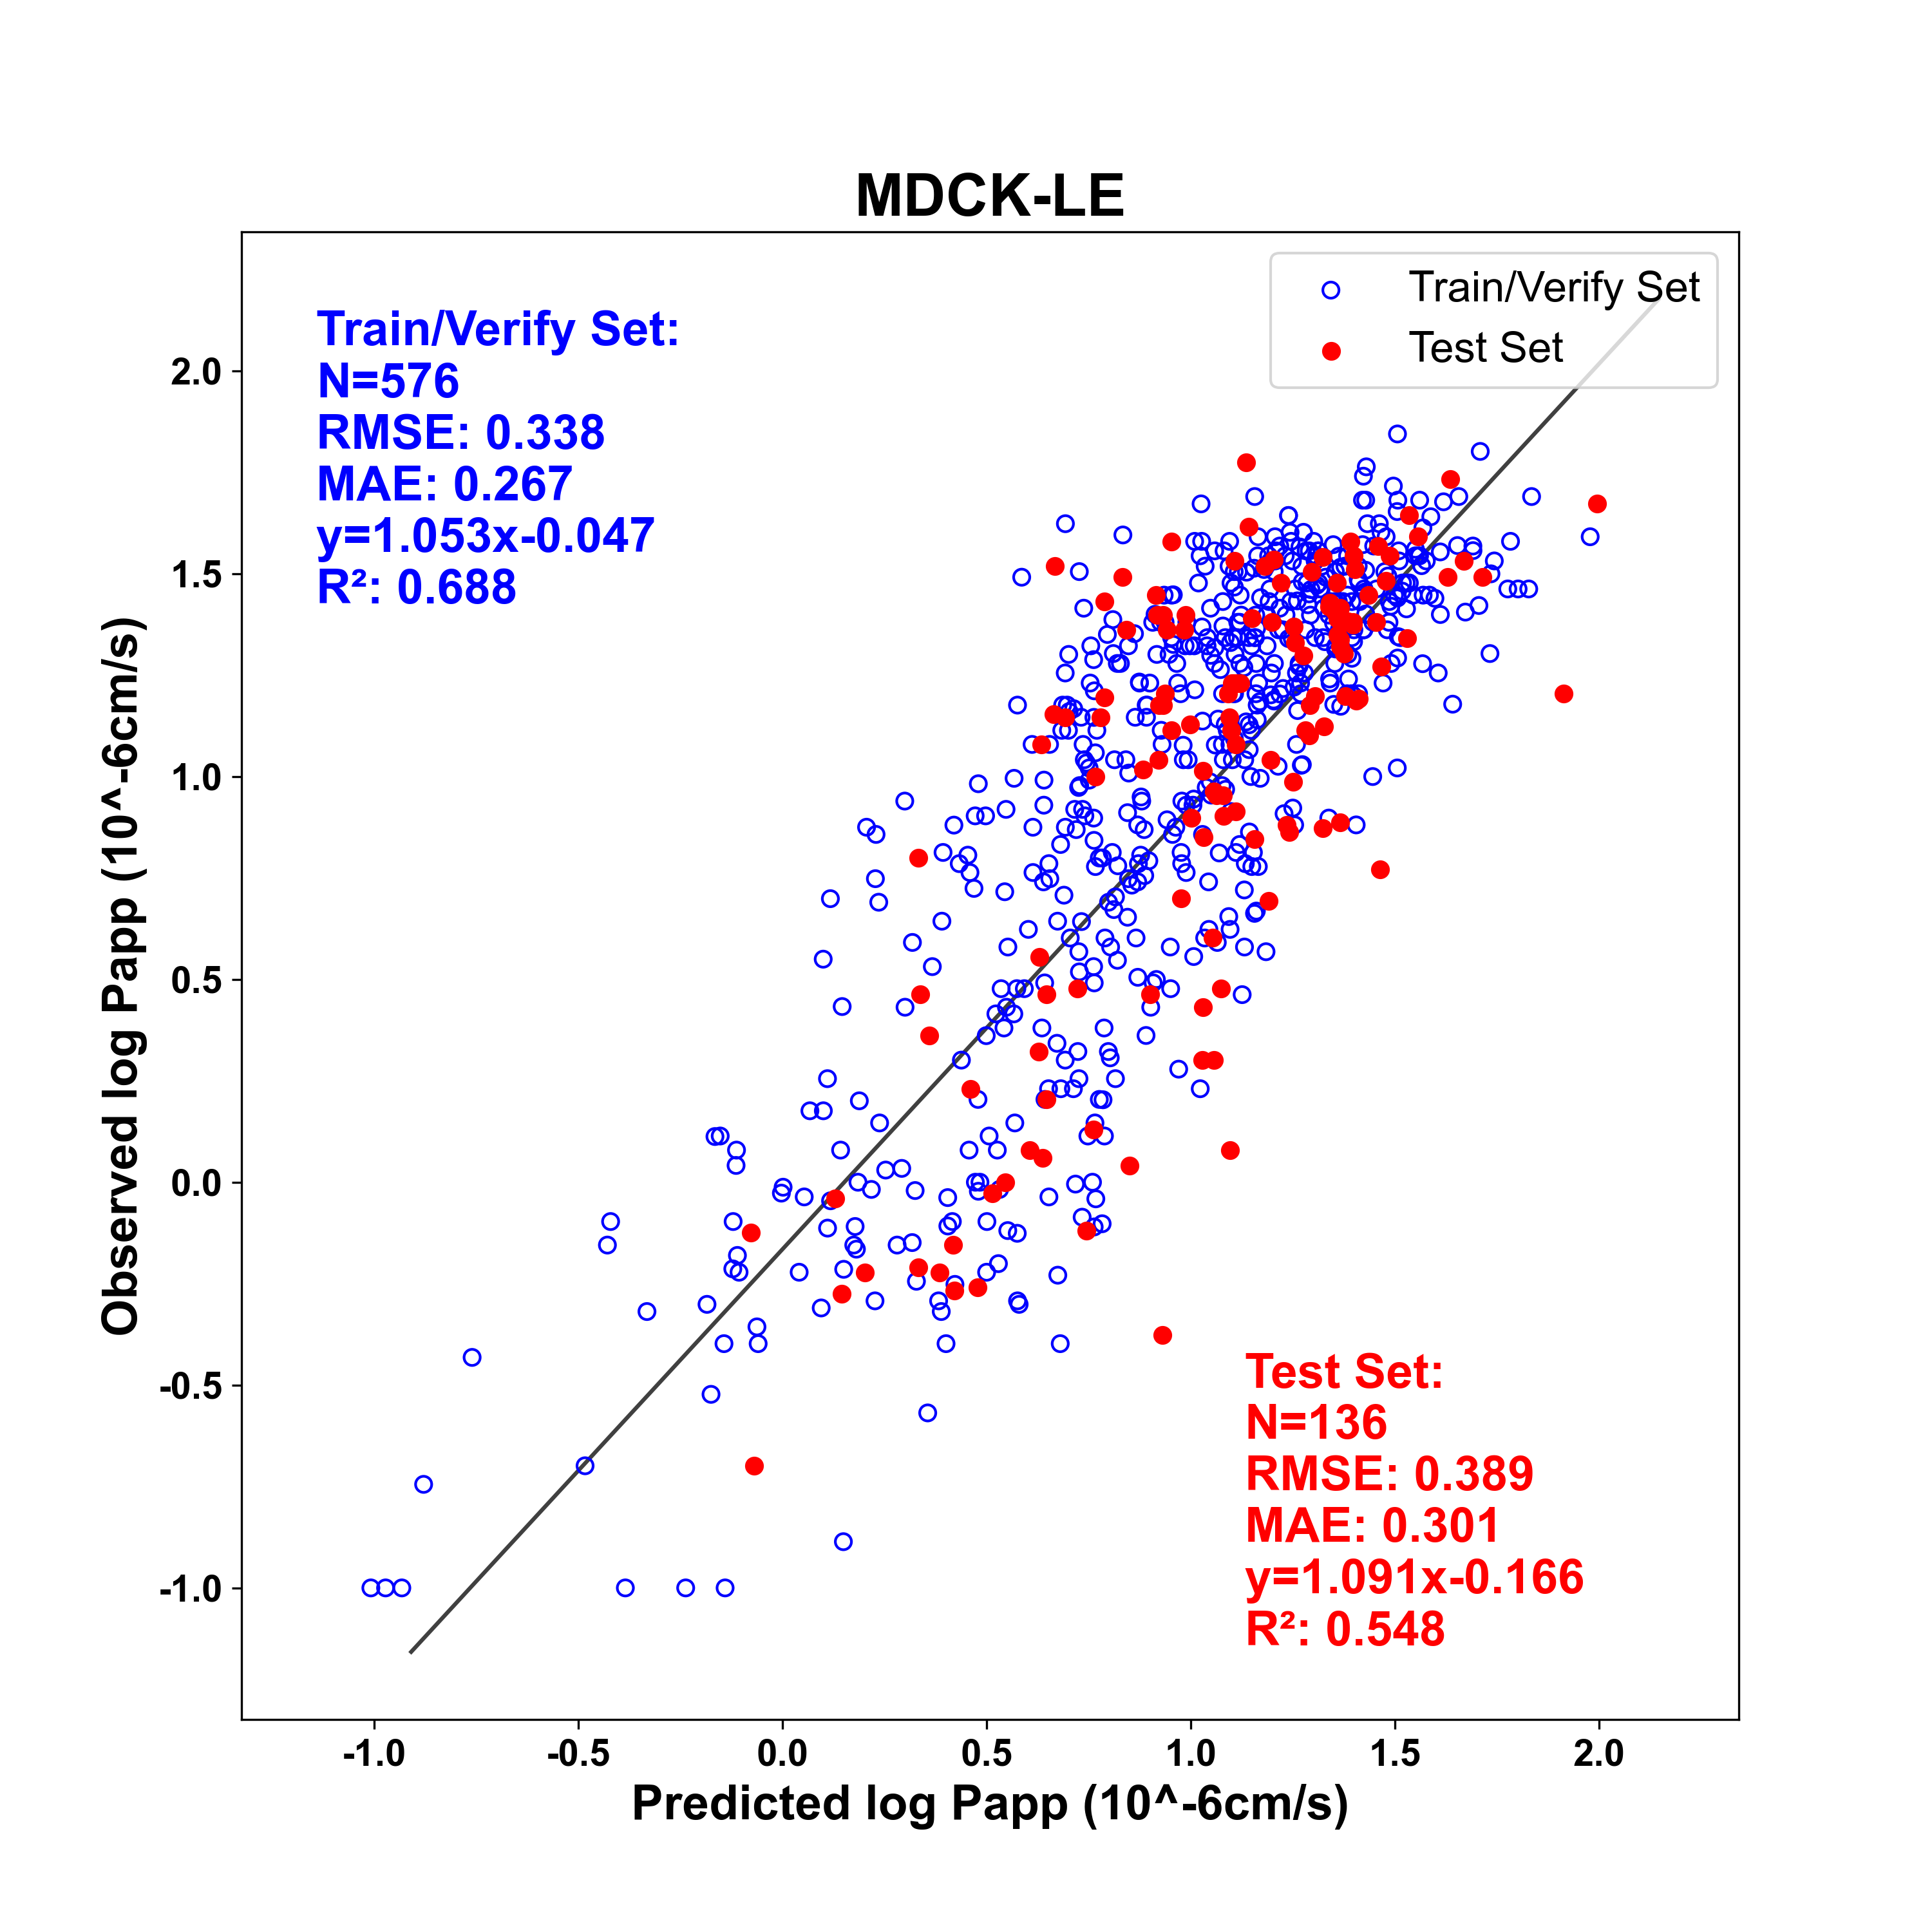
Our S+MDCK-LE model predicts apparent permeability (Papp) for Madin-Darby Canine Kidney-Low Expression cells, originally described by Di, L, et. al. as the following: “The Madin–Darby canine kidney cell line (MDCK) permeability assay is widely used and the primary concern of using MDCK cells is the presence of endogenous transporters of nonhuman origin. The canine P-glycoprotein (Pgp) can interfere with permeability and transporter studies, leading to less reliable data. A new cell line, MDCKII-LE (low efflux), has been developed by selecting a subpopulation of low-efflux cells from MDCKII-WT using an iterative fluorescence-activated cell sorting technique with calcein-AM as a Pgp and efflux substrate. MDCKII-LE cells are a subpopulation of MDCKII cells with over 200-fold lower canine Pgp mRNA level and fivefold lower protein level than MDCKII-WT.” These cells are also known as Ralph Russ canine kidney cells (RRCK) and they offer an advantage over the parental cell line for Restimation of passive permeability. For this reason, permeability is only measured in the A→B (apical to basolateral) direction. Permeability data, reported in units of 10-6 cm/s, was collected from literature sources and ChEMBL, with careful review of each primary literature source to ensure accuracy. Compounds from different sources were combined and for compounds that were in more than one dataset, the median value was used. The final dataset contained 712 compounds, of which 138 broke at least one Ro5, including 1 PROTAC, 11 macrocycles and 20 cyclic peptides.
Models were built on the log transformed values of the data, but predicted values are converted back to linear space in the ADMET Predictor spreadsheet. The number of compounds used for training and test sets, as well as quality metrics are shown in the figure below.
MDCK-MDR1 Papp A→B, B→A, and Efflux Ratio (ER):
MDCK-MDR1 cells are derived from Madin-Darby Canine Kidney (MDCK) epithelial cells that have been genetically engineered to overexpress the human MDR1 gene, which encodes the efflux transporter P-glycoprotein (P-gp).They are widely used in drug permeability and efflux studies because P-gp is a major transporter involved in limiting drug absorption and distribution, especially across biological barriers such as the intestinal epithelium and the blood–brain barrier. MDCK-MDR1 cells help distinguish whether poor permeability of a compound is due to low passive diffusion or active efflux by P-gp.
MDCK-MDR1 apparent permeability (Papp) measures the rate of drug transport across a cell monolayer: A→B (apical to basolateral; AB) reflects intestinal absorption potential, while B→A (basolateral to apical; BA) reflects potential efflux or secretion. The Efflux Ratio (ER = Papp B→A / Papp A→B) indicates whether a compound is a substrate for P-gp, with values >2 typically suggesting active efflux involvement.
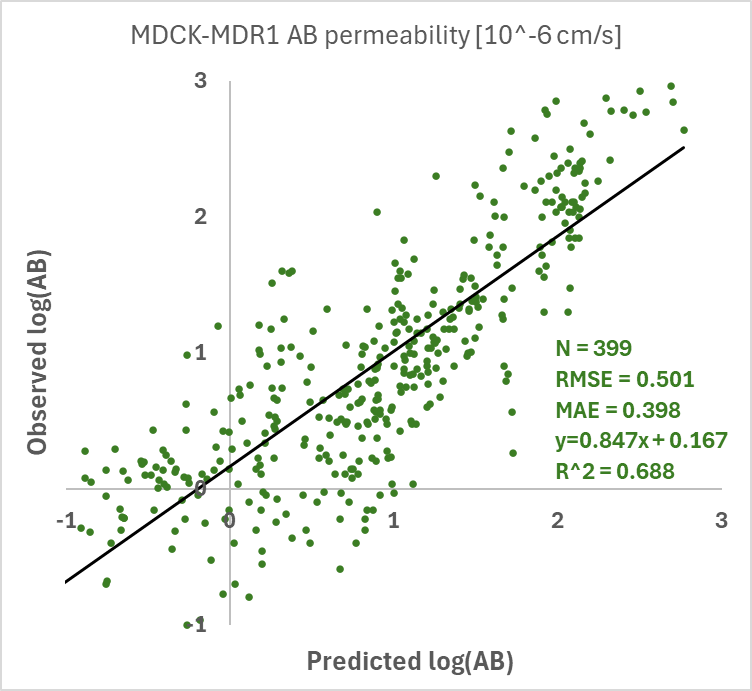
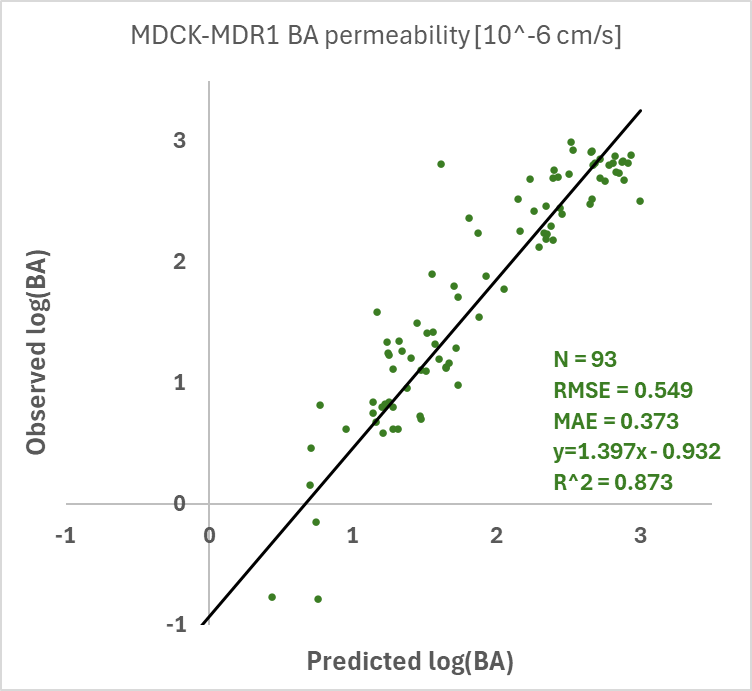
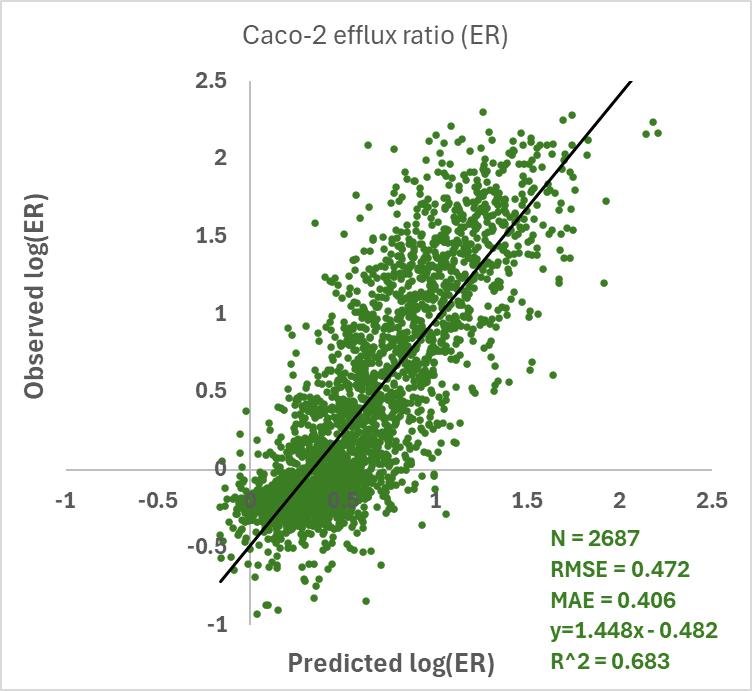
The A→B model contains 399 total compounds, of which 143 broke at least one Ro5, including 8 PROTACs, 27 macrocycles and 41 cyclic peptides. The B→A model contains 93 total compounds, of which 43 broke at least one Ro5, including 5 macrocycles and 13 cyclic peptides. The ER model contains 2687 total compounds, of which 115 broke at least one Ro5, including 46 macrocycles and 3 cyclic peptides.
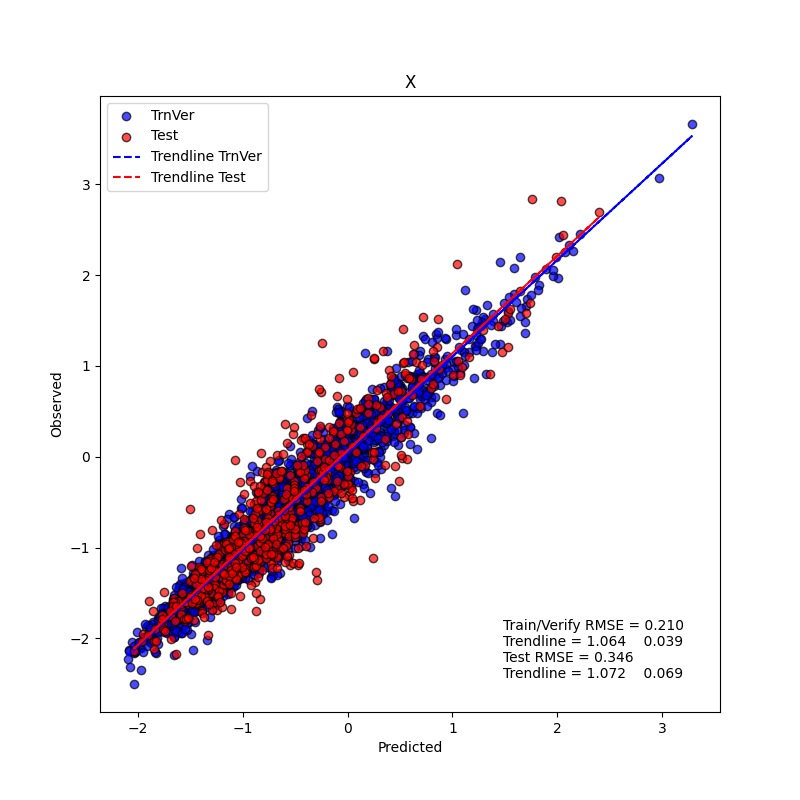
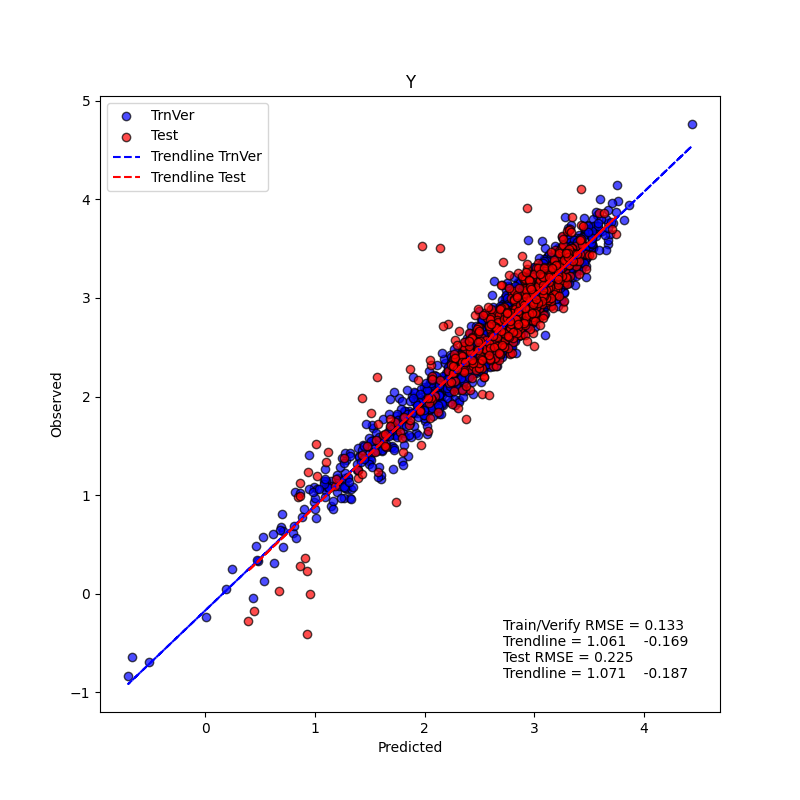
The following models were built with a special methodology to guarantee the expected ER = BA /A B relationship. The methodology is described in Section 3.4. It involved development of two independent XGBoost models of the permeability X and Y factors calculated from the observed data (in 10-6 cm/s). Consequently, validation plots are shown for these factors:
Naturally, it is the final endpoints that are of interest. However, since the ER, BA, and AB were derived from X and Y, the resulting performance plots no longer contain Train/Verify/Test distinction:
Human jejunal permeability
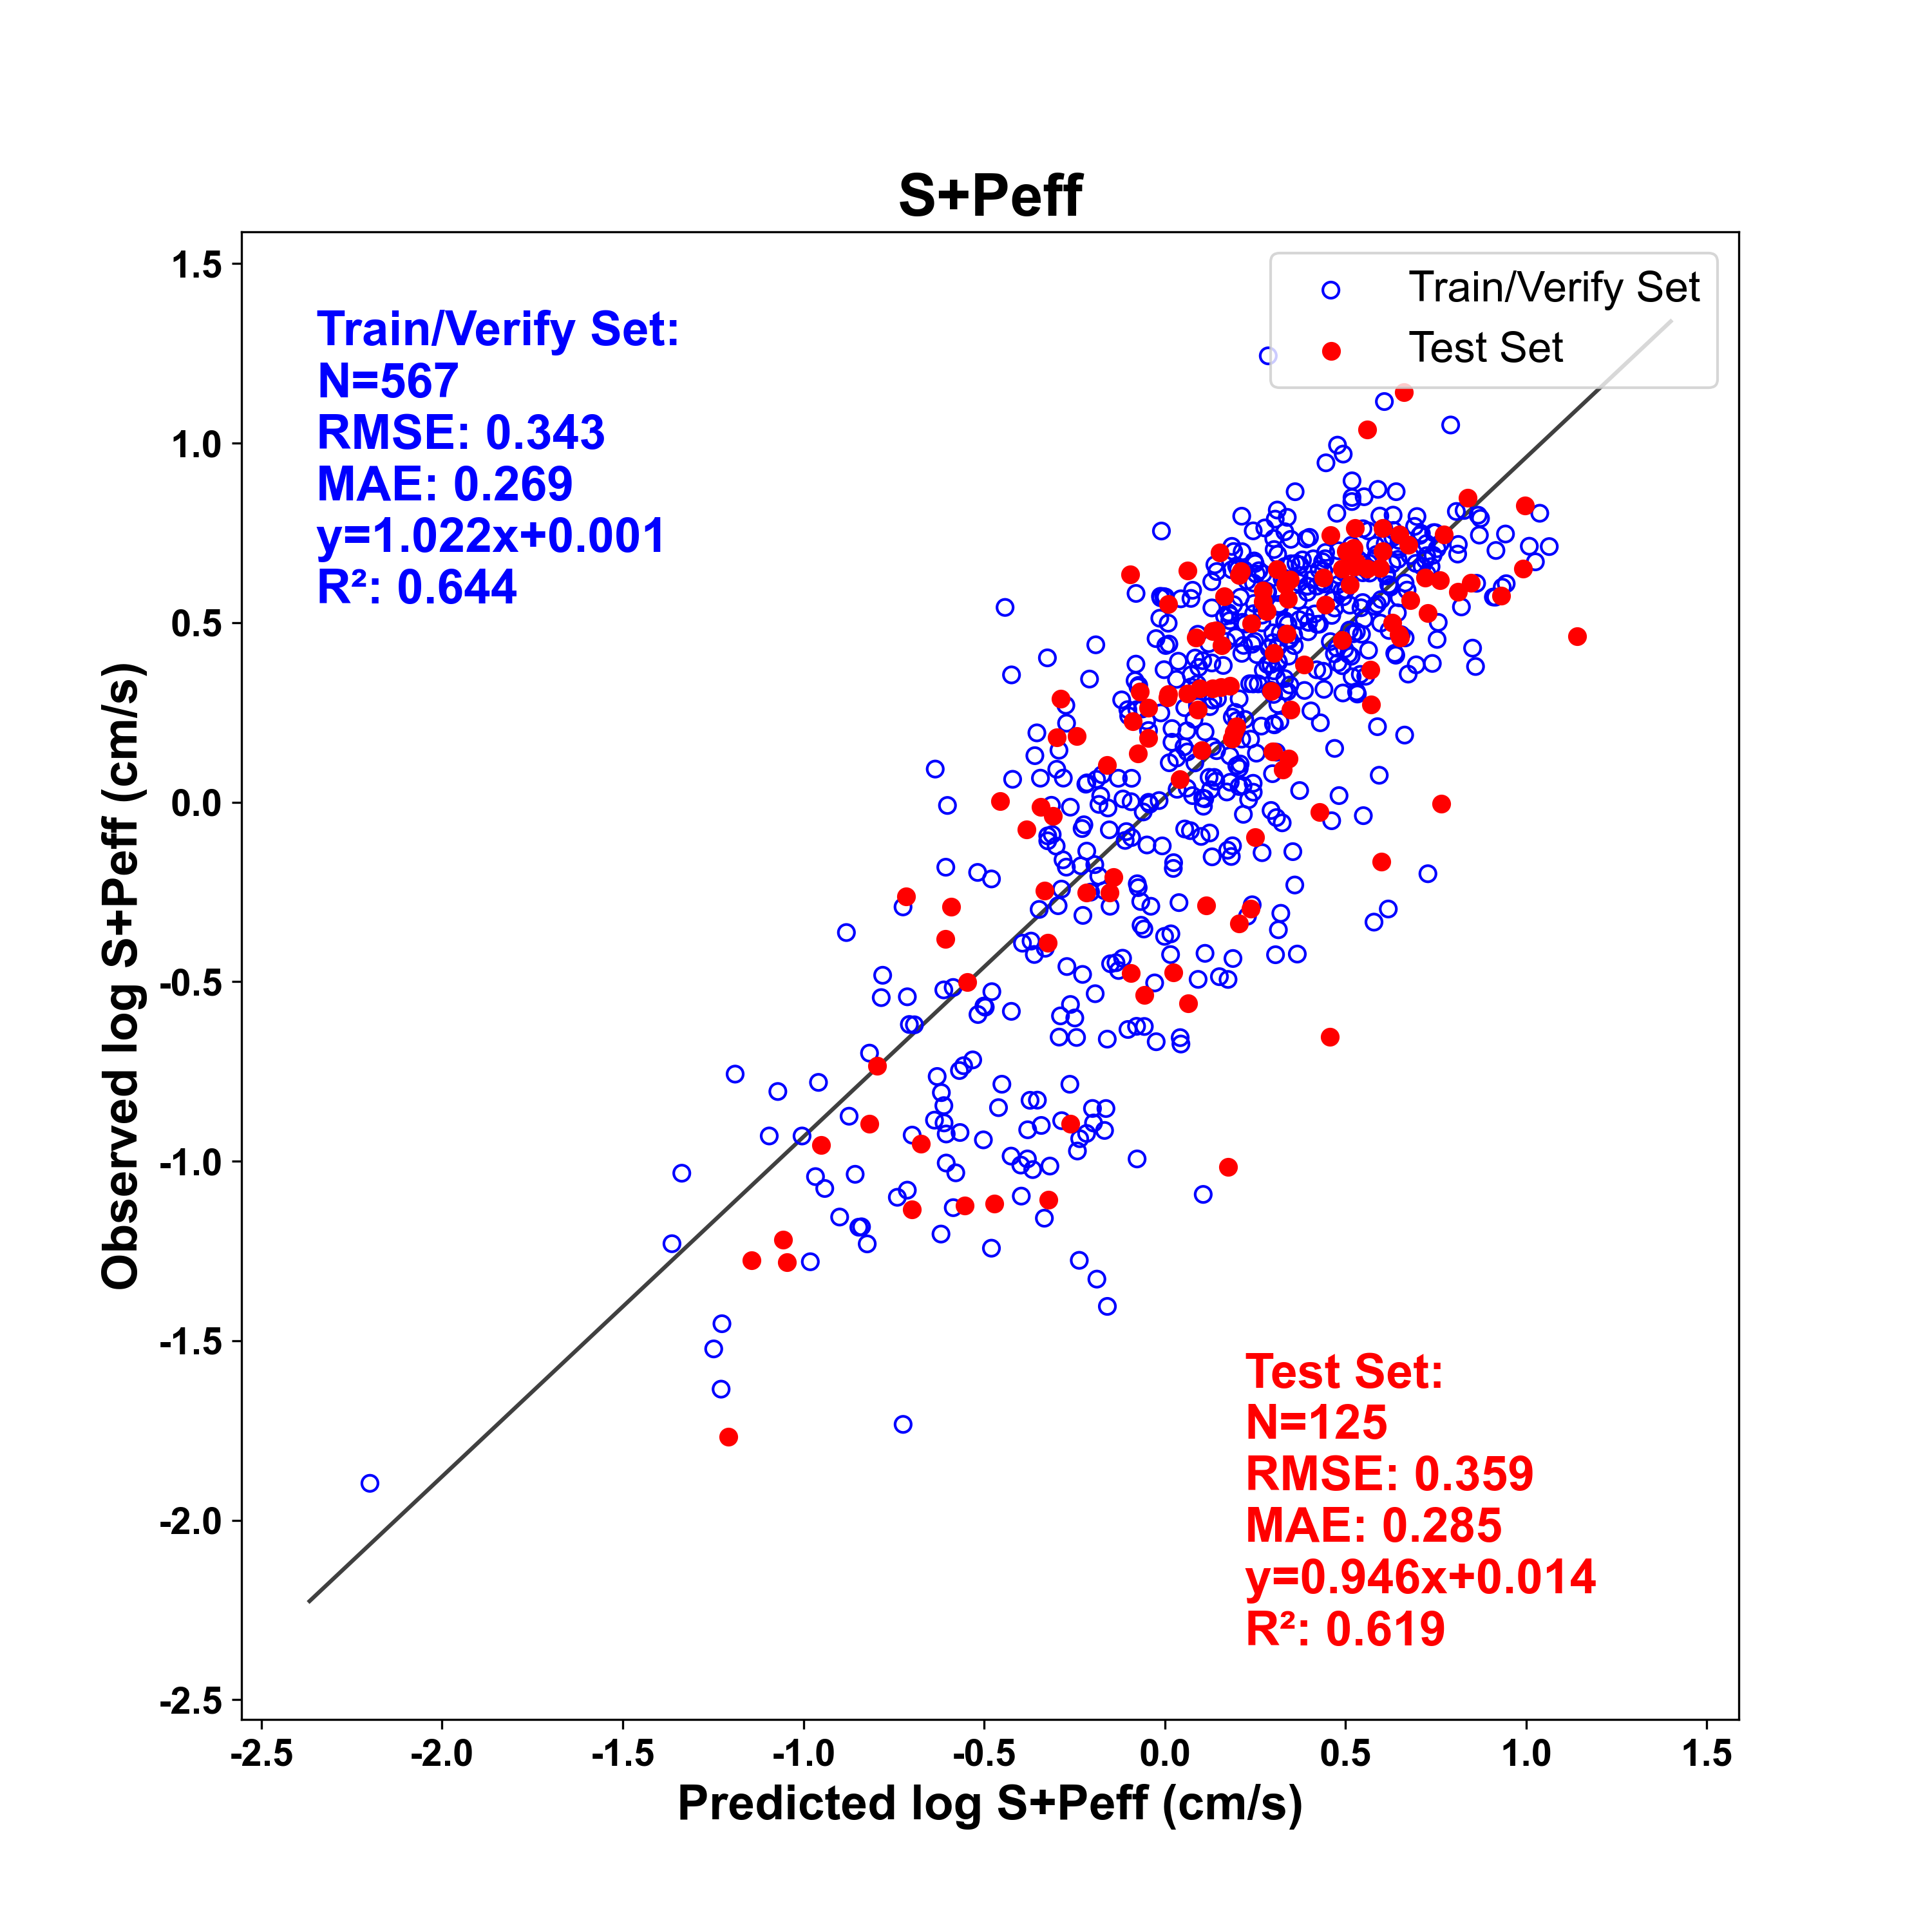
The Simulations Plus permeability model (S+Peff) predicts effective human jejunal permeability based on in vivo jejunal permeability measured in human subjects (Lennernas 1998, Lennernas 2007, Chiu 2003), in vivo permeability in rat jejunum (Caldeira 2021), in situ rat wall permeability (personal communication from GL Amidon, University of Michigan, U.S.A), human jejunal permeability measured in a Ussing chamber (Sjöberg 2013), rat jejunal permeability measured in a Ussing chamber (Guan 2022) and a subset of the MDCK-LE apparent permeability data (Goetz 2017, Li 2011, Obach 2018, Orozco 2019, Tess 2022, Tess 2023, Varma 2012, Varma 2015).
The in-situ rat Papp values were converted to human Peff values using a regression relationship derived from compounds for which permeability values were measured using both techniques. Human, rat and Ussing chamber values for compounds known to be subject to active efflux or influx were excluded. Indicator variables were used to adjust the Ussing cell and MDCK-LE data to be commensurate with those obtained in vivo for humans. Preliminary analysis identified a block of actively transported compounds in the MDCK-LE data set, which were excluded from subsequent analyses. Several compounds were represented in more than one of the data sets, which facilitated the calibration process. Peff values for such replicates were replaced by median values for the final analysis. The final model contains 692 total compounds, of which 131 broke at least one Ro5, including 21 macrocycles and 20 cyclic peptides.
The model was built on the log transformed values of the data, but predicted values are converted back to linear space in the ADMET Predictor spreadsheet in units of 10-4 cm/s. The number of compounds used for training and test sets, as well as quality metrics are shown in the figure below. The performance of S+Peff was also assessed by running HTPK simulations. The fraction absorbed (Fa) estimates obtained were in good qualitative agreement with human intestinal drug absorption values reported by Zhao (2001).
A simple linear multiple linear regression model of passive human jejunal permeability (SimplePeff) is based on experimental human Peff values for 20 passively absorbed drugs. It has been used successfully in pharmacokinetic simulations for a much wider range of compounds. The equation shown above is:
log SimplePeff = 0.245 × MlogP + 0.078 × IHB - 0.052 × HBA
The equation yields predictions in units of cm/s × 104. The descriptors used do not change from one version of ADMET Predictor to another. The positive coefficients for MlogP and a 2D estimate of the number of internal hydrogen bonds (IHB) along with the negative coefficient for the number of hydrogen bond acceptor atoms (HBA) indicates that in general Peff increases as hydrophobicity increases and external H-bonds decrease. SimplePeff is turned off by default; use Model Editor if you want to turn it on.
Diffusion coefficient
ADMET Predictor uses the approach of Hayduk and Laudie (1974) for estimating infinite dilution diffusion coefficients of nonelectrolytes in water.
where:
DAw = binary diffusion coefficient at infinite dilution (cm2/s ×105)
ηw = viscosity of water (cP) at 37oC.
VA = Solute molal volume at normal boiling point. (cm3/g-mol)
Molal volume VA is estimated using the method of Schroeder for liquid molal volume in cm3/mol at the normal boiling point (Schroeder 1949). The method sums the number of atoms of carbon, hydrogen, oxygen, and nitrogen plus one for each double bond and then multiplies the resulting sum by seven to estimate the volume in cubic centimeters per mole. The method has been expanded to include halogen atoms, sulfur atoms, and triple bonds and to apply corrections for a variety of rings (Reid 1977).
Skin permeability
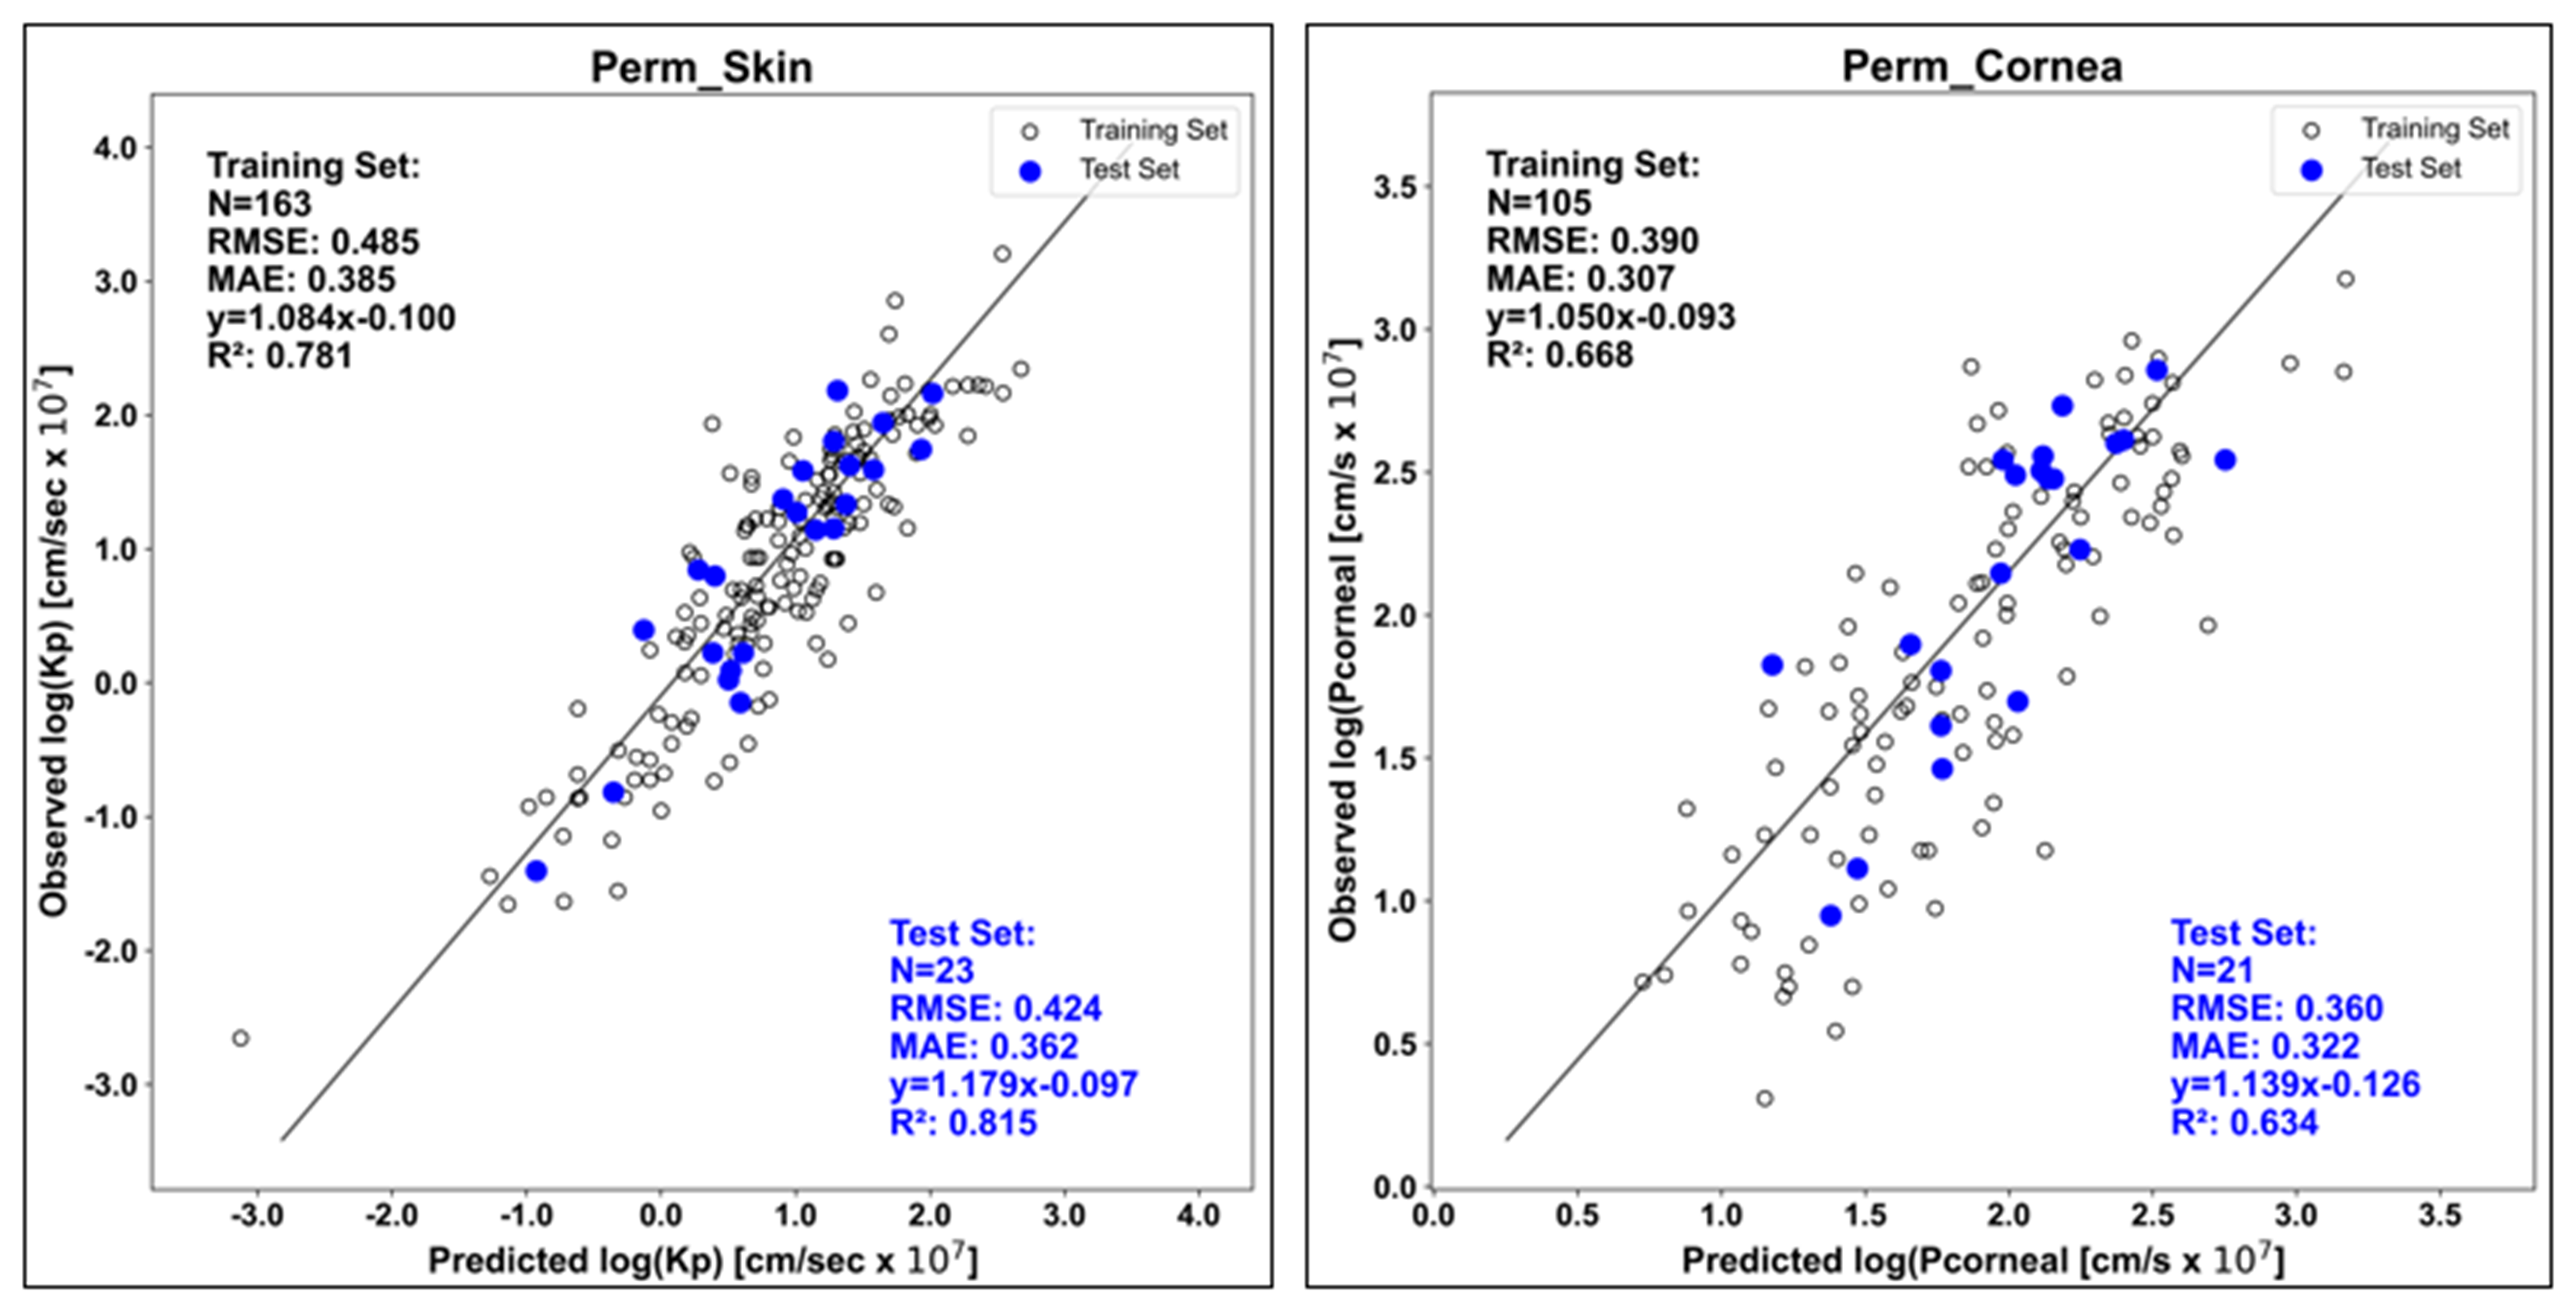
Our Perm_Skin model predicts the permeability of human skin (KPskin) to a compound dissolved in an aqueous solution. It was built with data for 186 compounds collected from the literature (Majumdar 2007; Thomas 2007; Juntunen 2008). The data curation process involved a thorough check for discrepancies and inconsistencies between reported experimental values. A set of 23 compounds was set aside as a test set and the remainder were used in the training pool to develop an ANNE regression model. A graph of the observed values versus predictions is shown below at left. Though the model was developed in logarithmic space, the final output is back-transformed into the linear space and expressed in units of ×10-7 cm/sec .
Corneal permeability
Simulation Plus’ Perm_Cornea model predicts in vitro corneal permeability (Pcornea) of drug-like compounds for rabbit cornea. The curated data set was composed of 126 compounds collected from the literature (Prausnitz 1998; Kidron 2010; Li 2005; Fu 2002; Yoshida 1996). The lowest permeability value in the data set was 2×10⁻⁷ cm/s.
Twenty compounds representative of the entire range of permeabilities were set aside as external test set before building the ANNE regression model. The test set RMSE was 0.448 log units; performance is shown in the plot above right. Predictions are reported in units of cm/s×107.
Predicting CNS access
Taken together, BBB_Filter and LogBB can be used to predict how effectively a molecule can penetrate the blood-brain barrier (BBB): the former is a binary ANNE classification model (“High”/”Low”), whereas the latter is a regression model estimating the decimal logarithm of brain-blood partition coefficient: log(Cbrain/Cblood). Two separate models are provided to take advantage of the greater abundance of qualitative data over the quantitative data in the scientific literature. They actually represent two separate events: BBB_Filter predicts whether a compound can get into the brain, whereas logBB predicts whether it will be retained once it gets in. Many compounds that do penetrate the BBB get pumped back out by efflux transporters such as P-glycoprotein.
The data used to build the models comes from rat studies. The data for BBB_Filter comes from multiple sources. It consists of 2,276 compounds that cover a wide range of chemical space. A subset of 462 compounds had quantitative information on the partition coefficient, so the chemical space coverage of the LogBBB model is correspondingly lower.
The performance of BBB_Filter is shown below. The overall classification concordance reaches 92%. This compares favorably with the model built by Crivori et al. (2000), which “. . . correctly predicts more than 90% of the BBB permeation data.” Exactly where the cutoff between “High” and “Low” classes was not specified in some reports, while for others it was reported as being at log(Cbrain/Cblood) = -1.0.
|
Model |
Set |
Negatives |
Positives |
Total |
Correct |
Concordance |
Sensitivity |
Specificity |
|---|---|---|---|---|---|---|---|---|
|
BBB_Filter |
Training |
425 |
1395 |
1820 |
1676 |
92.1% |
93.0% |
88.9% |
|
Test |
109 |
347 |
456 |
421 |
92.3% |
94.5% |
85.3% |
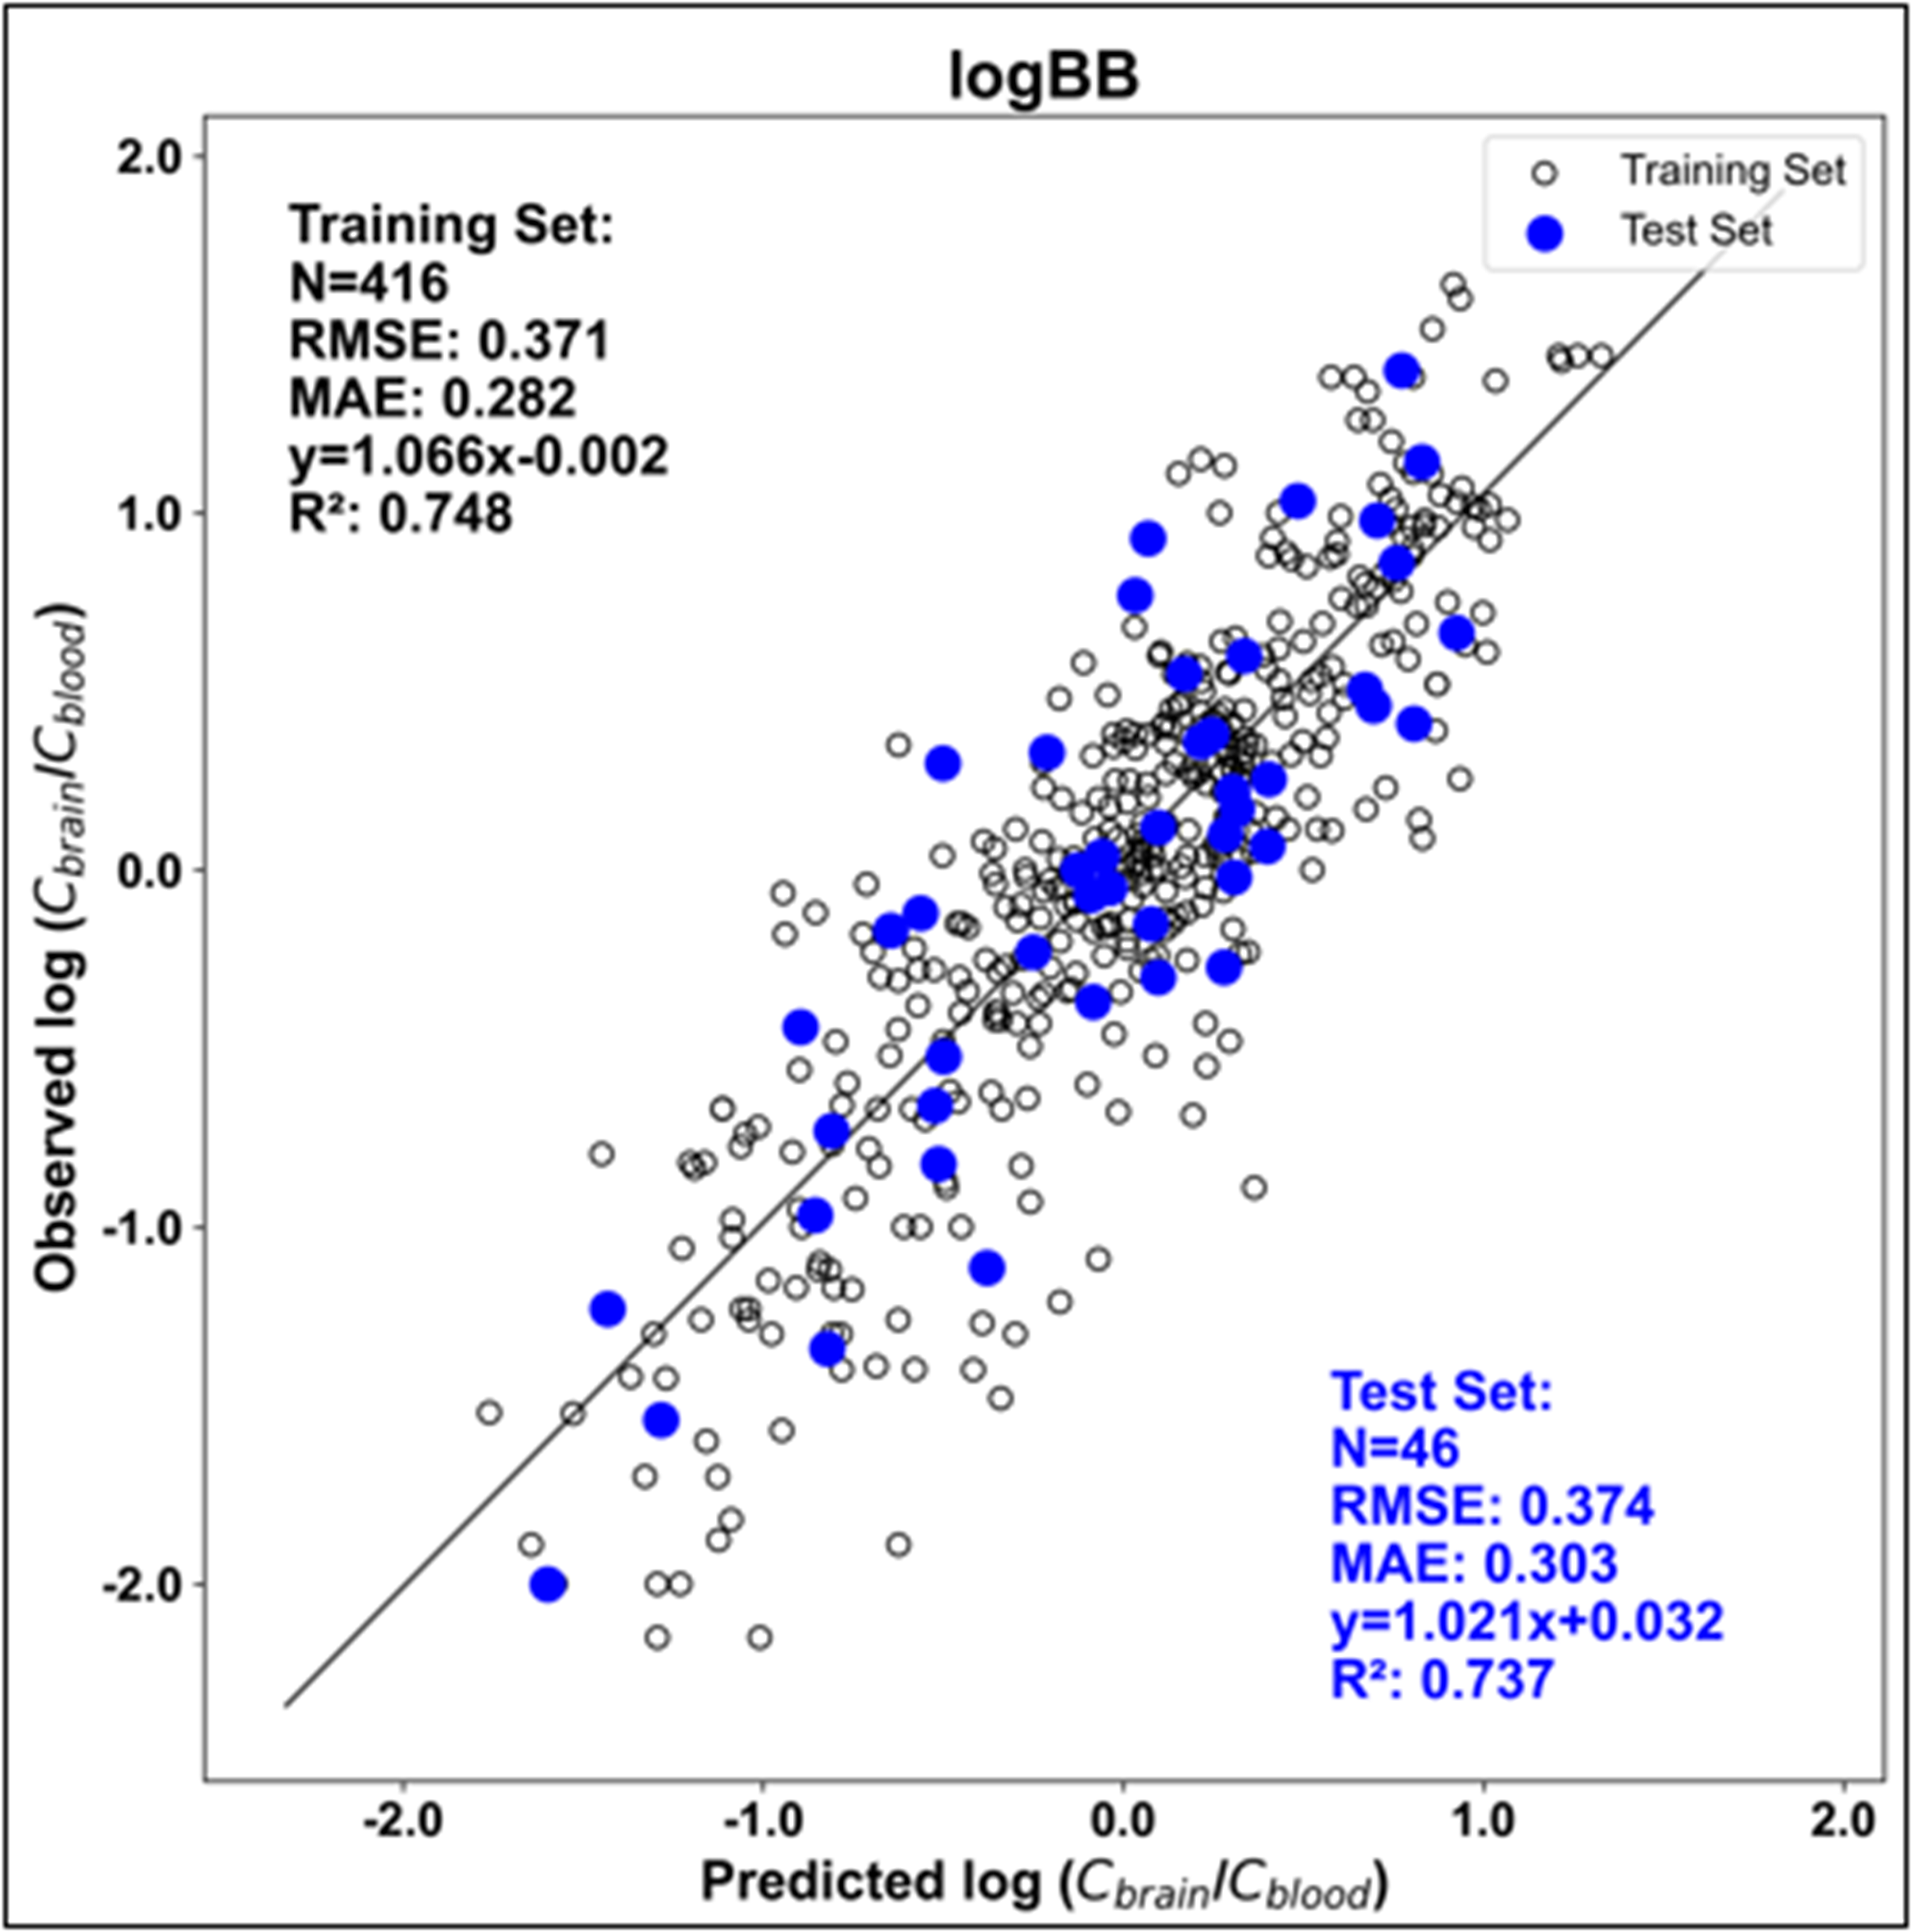
The performance statistics for the LogBB ANNE regression model are illustrated below. Out of 462 modeling compounds, 46 were chosen as an external test set. The RMSE was 0.374 for the test set.