

2.4.3. Solubility, melting point and solvation
A license to the Physicochemical and Biopharmaceutical Module provides access to 12 different models related to aqueous solubility, including three that predict solubility in pure water (derived from intrinsic solubility), three that predict solubility in simulated gastrointestinal fluids, and one (SupSatn) that predicts whether a compound will tend to form supersaturated solutions. In addition, the same license includes two optional models of the free energy of solvation.
Intrinsic solubility is the concentration of the compound's neutral form (macrostate) at saturation. Strictly speaking, it is a pH-independent parameter only measurable for non-ionizable compounds. S+S_Intrins is the intrinsic solubility model developed by Simulations Plus with machine learning technology. Two versions of it are provided: one takes advantage of geometric (3D) information and the other only makes use of connectivity (2D) information. The intrinsic solubility model is a foundation for derived solubility models that predict the pH at saturation (native pH, S+pH_Satd); saturated concentration of the most stable pure neutral solid form of a compound in pure water (native solubility, S+Sw); the solubility at a pH that you specify (S+S_pH); and the ratio of salt solubility to intrinsic solubility (the salt solubility factor, SolFactor).
In addition, the S+S_Intrins takes advantage of the lipophilicity predicted by S+logP and a new Simulations Plus model predicting the melting point of the pure solid compound in degrees Celsius, S+MP. Two additional models were developed as potential inputs for S+S_Intrins: the Gibbs free energy of self-solvation, DG_SelfSolv, and aqueous hydration, DG_Hydration; both in the units of kcal/mol. In the end both models turned out not to be necessary (S+logP and molecular descriptors covered solvation adequately), but were retained as optional models for users who want to build custom models of other quantities related to solvation. See the section on Model Editor for instructions on how to turn both models on.
Kinds of solubility predictions in pure water
Native pH (S+pH_Satd) is calculated from intrinsic solubility and ionization constants using chemical equilibrium theory.
Native solubility (S+Sw) is calculated from intrinsic solubility, native pH, and the compound's dissociation constants.
Solubility at the pH specified when ADMET property calculations are initiated (S+S_pH) is calculated from intrinsic solubility, salt solubility factors, and the compound's dissociation constants.
Salt solubility factors (SolFactor) come from regression models that use intrinsic solubility as a descriptor.
The entries for the derived models in the Model Editor can be rather complicated. In particular, the derived models can use either internally predicted or experimental pKa values supplied as input. The latter are provided by adding real-valued user attributes named Obsd_Acidic_pKa and/or Obsd_Basic_pKa. Any values provided will override those calculated internally and returned as S+Acidic_pKa and S+Basic_pKa, respectively. See the section on pKa's for more details.
Intrinsic solubility
For the first 26 years of its existence ADMET Predictor used the native solubility model, S+Sw, as a basis for all the derived solubility models. Early versions were constructed from data on 1337 compounds for which both melting points and reliable native water solubilities were available (Meylan 1996). Meylan et al. had carefully screened the data set, which made it possible for us to build very precise predictive models - the mean absolute errors were ~0.3 log units and the R2 against external tests sets was over 0.95. Those models - one of which incorporated experimental melting point - performed quite well in independent evaluations against competing models (Dearden 2003; Dearden 2006). Some of our users found early versions of S+Sw too biased towards small molecules, however, a concern which was addressed by adding solubility data from the literature and from the Aquasol database (Ran & Yalkowsky 2001). The current 2D and 3D S+Sw ANNE models were both trained on the 3596 compounds in the expanded data set, with the test set for the latter being somewhat smaller than for the former The test set RMSEs were very similar - 0.57 log units for the 2D model and 0.56 for the 3D model.
It all changed in 2024 when a seminal book by Alex Avdeef containing intrinsic solubilities of 3490 compounds ("Wiki-pS0" database) was published (Avdeef 2024). Alex has used his pDISOL-X software to painstakingly convert measured pH-dependent solubilities from literature into their intrinsic equivalent - a lifetime work achievement. We have converted the native solubilities from the Meylan/Aquasol set described above into intrinsic values, as well. There was a high degree of overlap between two sets. We have combined Avdeef's set with the unique members of Meylan/Aquasol set. Subsequent data curation resulted in good intrinsic solubilities for 4877 compounds.
The curated Avdeef’s set included just 8 beyond-Rule-of-Five (bRo5) compounds. In 2025, in an effort to extend model’s applicability domain, we have appended additional 71 bRo5 compounds (PROTACs) extracted from ChEMBL and published literature resulting in a modeling set totaling 4948 compounds.
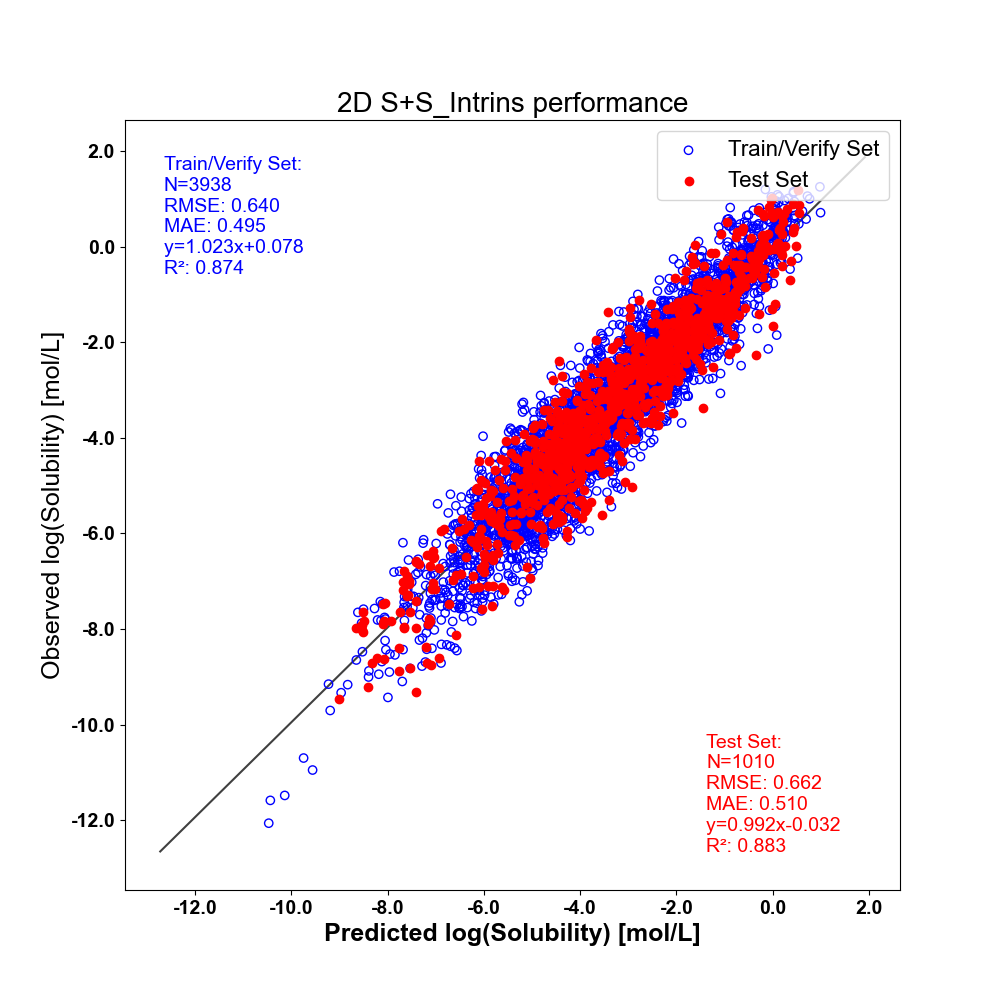
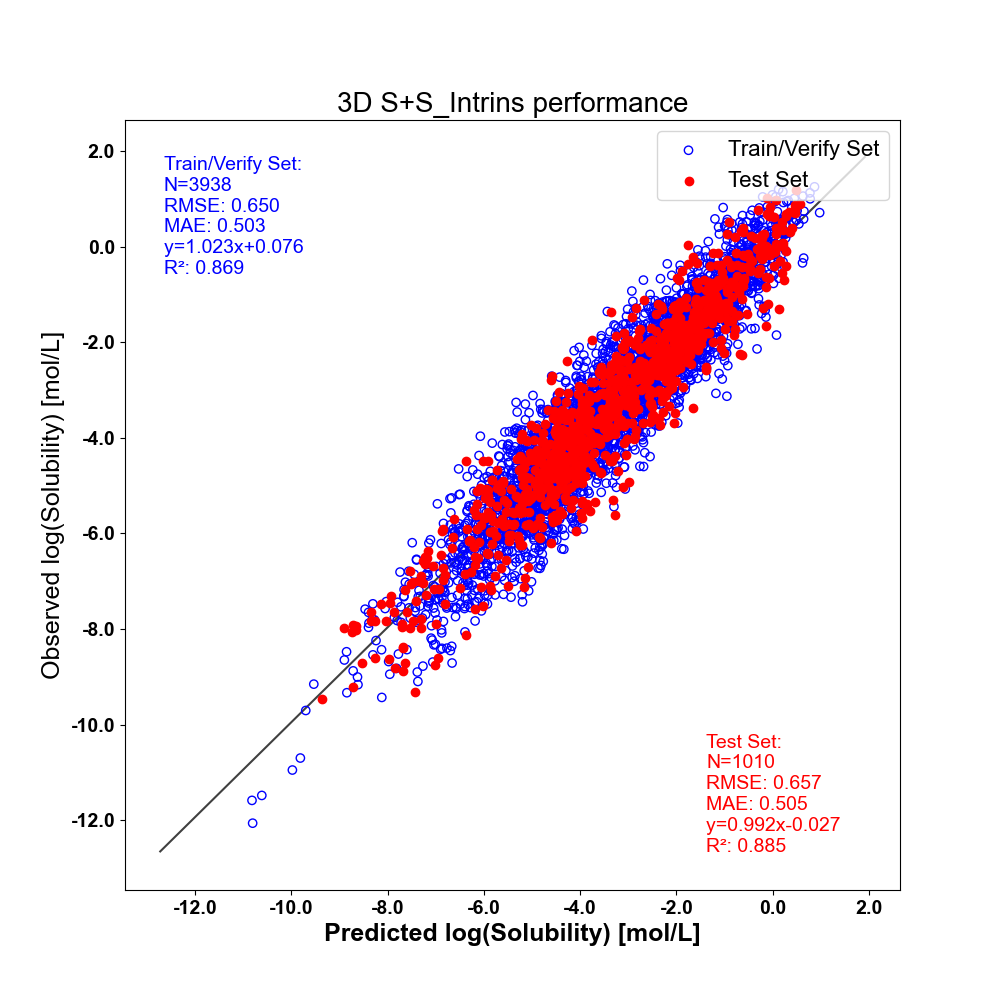
Next, we have built two artificial neural network ensemble models for S+S_Intrins using 2D and 3D structures of these compounds. The two graphs included below illustrate their predictive performance.
Many drugs are ionizable, so their solubility is affected by the pH of the solution. ADMET Predictor makes it possible to visualize the effect of pH on the solubility of individual compounds. The tool for doing so is accessed using TOOLS >> Solubility Profile or via the Shift+S shortcut. Either will launch the Solubility Profile window for the selected compound. The predicted result of titrating the solubility of furosemide is shown below.
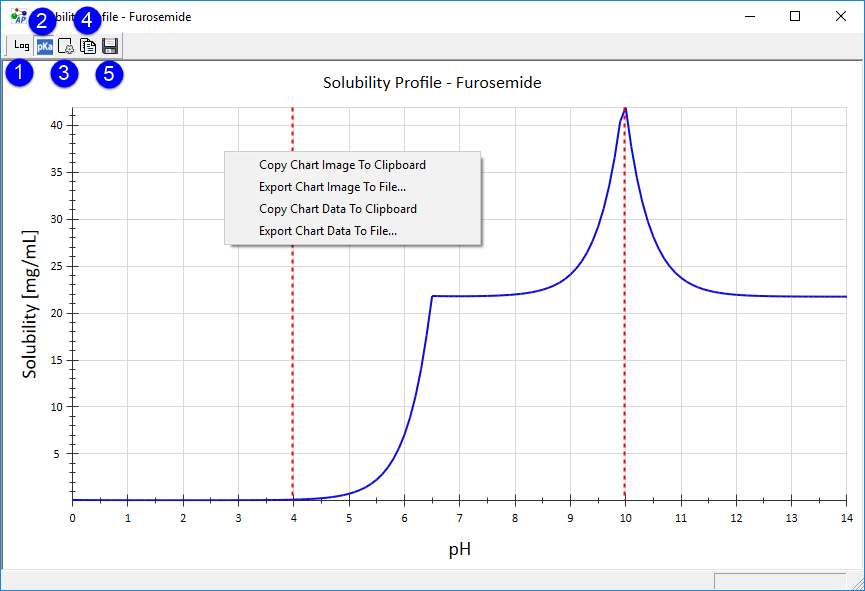
The calculated S+S_pH is plotted against pH. The display is controlled using the five toolbar icons in the left-hand top corner. The Log icon (1) allows you to toggle the Solubility axis between linear and logarithmic scales. The pKa icon (2) allows you to display predicted pKa's as dotted vertical lines color-coded by the nature of the associated macrostate transition: red for acidic. blue for basic and green for mixed. The settings icon (3) allows user to change the ranges of the X and Y axes. The copy icon (4) and save button (5) allow you to copy and save the chart, respectively.
By right clicking, you can Copy Chart Data To Clipboard" and paste the data into another program as text. You can also save the chart data using the Export Chart Data To File item in the pop-up context menu.
Melting Point
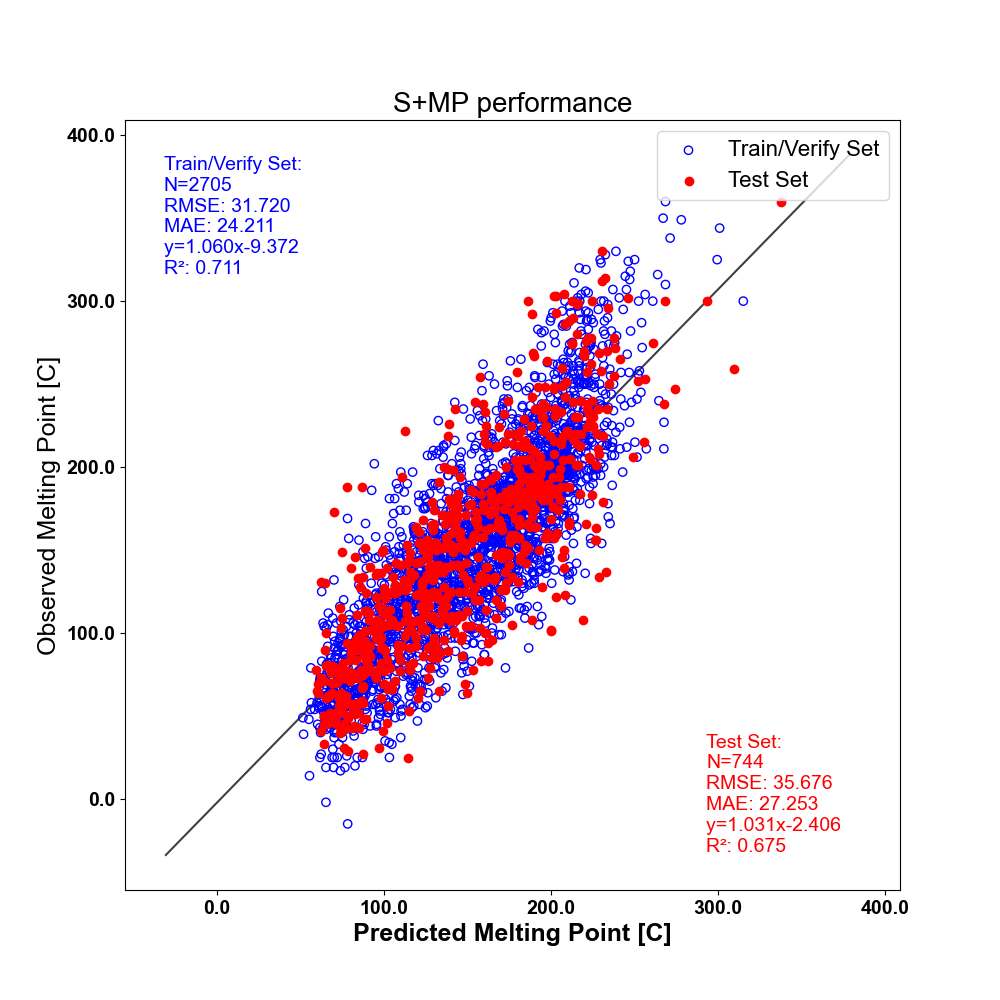
The General Solubility Equation derived by Ran and Yalkowsky (Ran 2001) relates native solubility to only two inputs: log P (accounting for hydration) and melting point (accounting for the strength of crystal lattice of dissolving solid). Since the Avdeef's Wiki-pS0 database contains melting point data for each compound (Avdeef 2024), we have used it to construct our own machine learning model of this important parameter. Data curation resulted in 3449 compounds with melting point in degrees Celsius. We used it to train the S+MP model whose performance is shown below. Along with S+logP it was picked up as an important descriptor in the intrinsic solubility model S+S_Intrins. It is retained as a default model in the Physicochemical and Biopharmaceutical Module, primarily for users who want to build solubility predictors from their own data.
Gibbs free energy of solvation
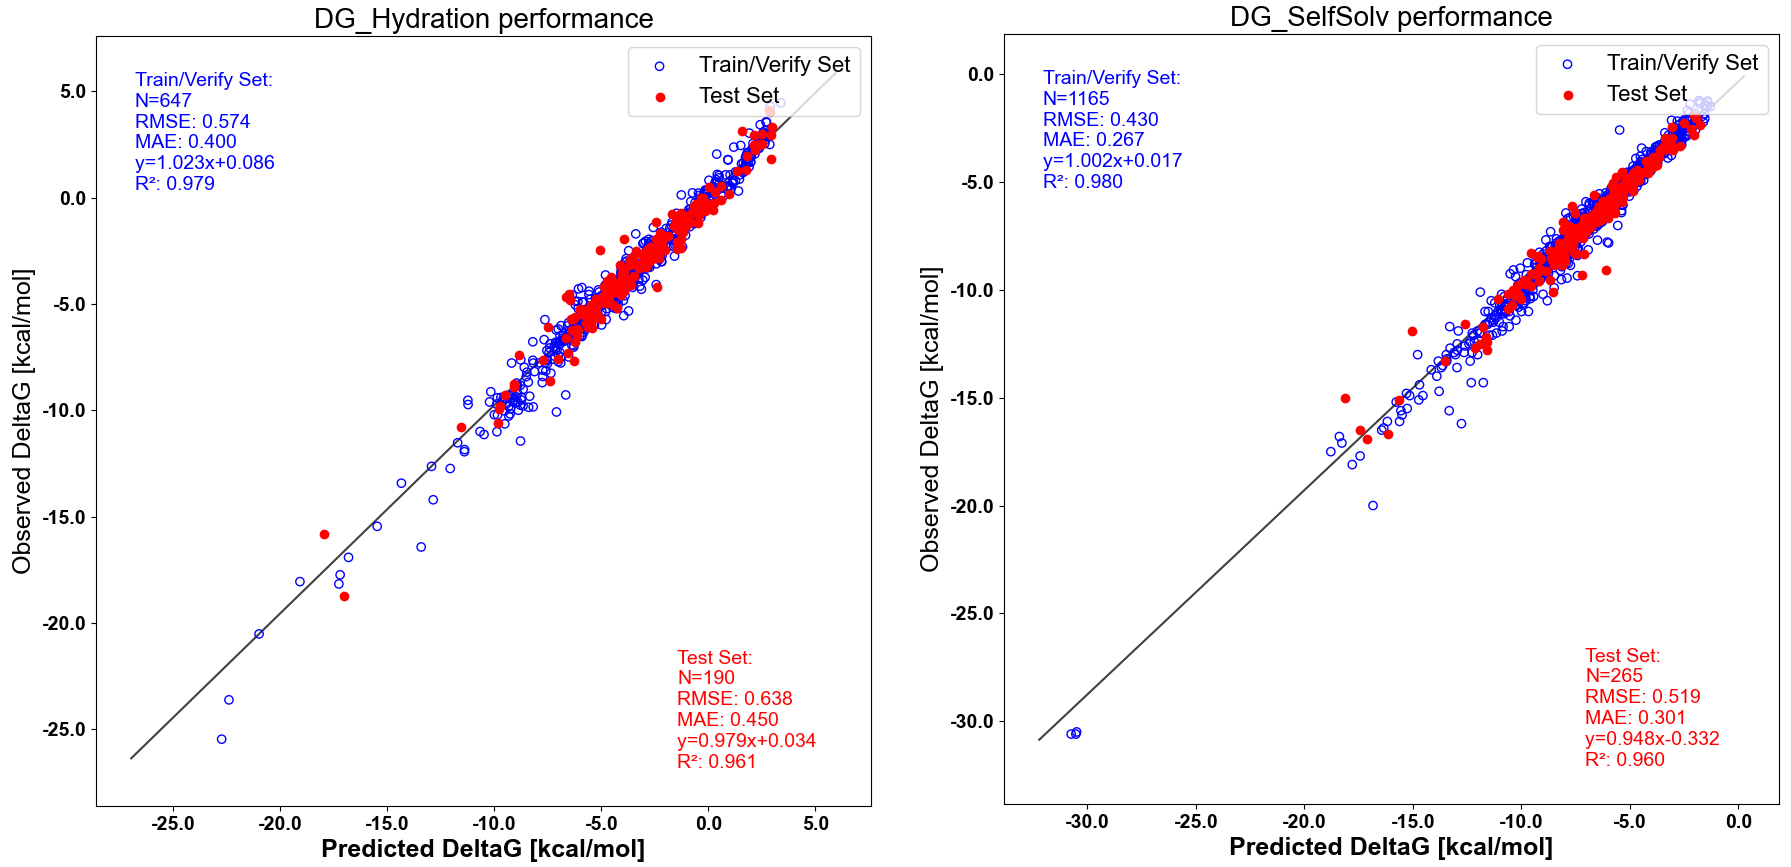
In a similar effort to generate inputs for solubility modeling we have combined two published databases of Gibbs free energies, DG measured in kcal/mol: 1) FreeSolv containing DG of hydration (Mobley 2014); 2) CompSol containing DG of hydration and self-solvation (Moine 2017). Self-solvation is a process of solvating a compound by itself in liquid state. In the case of overlapping compounds preference was given to better documented CompSol data. The latter was limited to data measured at 298 K. Two models were built from the combined data: 1) DG_Hydration = DG of hydration in kcal/mol; 2) DG_SelfSolv = DG of self-solvation in kcal/mol. The respective performance graphs are shown below. Although both models were selected as inputs for some S+S_Intrins prototypes, the one chosen as the final model of intrinsic solubility does not depend on any of them. Therefore, DG_Hydration and DG_SelfSolv are distributed as optional (i.e., by default turned off) components of the Physicochemical and Biopharmaceutical Module, again, as potentially useful inputs for custom models built at a user site. See the section on Model Editor for instructions on how to turn both models on.
Solubility factor
For monoprotic weak bases, we define the solubility factor as the ratio of asymptotic salt solubility at the low pH limit to the intrinsic solubility. In practical applications, the asymptotic salt solubility for weak bases can be approximated by the equilibrium solubility measured at least three log units below the pKa. Likewise, the intrinsic solubility of bases is close to the value that is at least three log units above the pKa. The reverse is true for acids and their salts.
We studied the solubility vs. pH profiles for 22 drug molecules to determine the relationship between the value of intrinsic solubility and the solubility factor. The plot below shows that the logarithm of intrinsic solubility (mg/mL) and the logarithm of solubility factor are inversely related in a linear fashion. The R2 is 0.83 for bases and 0.68 for acids.
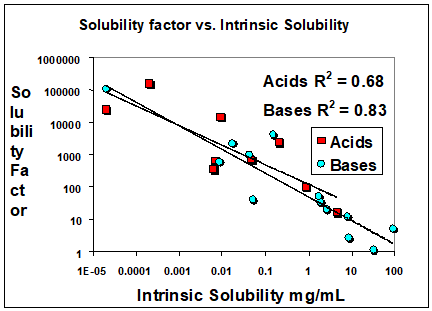
ADMET Predictor estimates the intrinsic solubility of a molecule using the S+S_Intrins built-in model. No distinction in solubility factor is made between the first, second, …, nth ionization state for polyprotic compounds. Zwitterions, for which the intrinsic solubility is not directly measurable, were omitted from the data set.
Performance of derived solubility models
No experimental data is involved in training the derived models, so there are no meaningful performance statistics to report for them. Predictive performance in these cases depends on the performance of the native solubility models upon which they are based and S+pKa or the accuracy of the input pKa. Please consult Section 2.4.1 for details.
Biorelevant solubility models
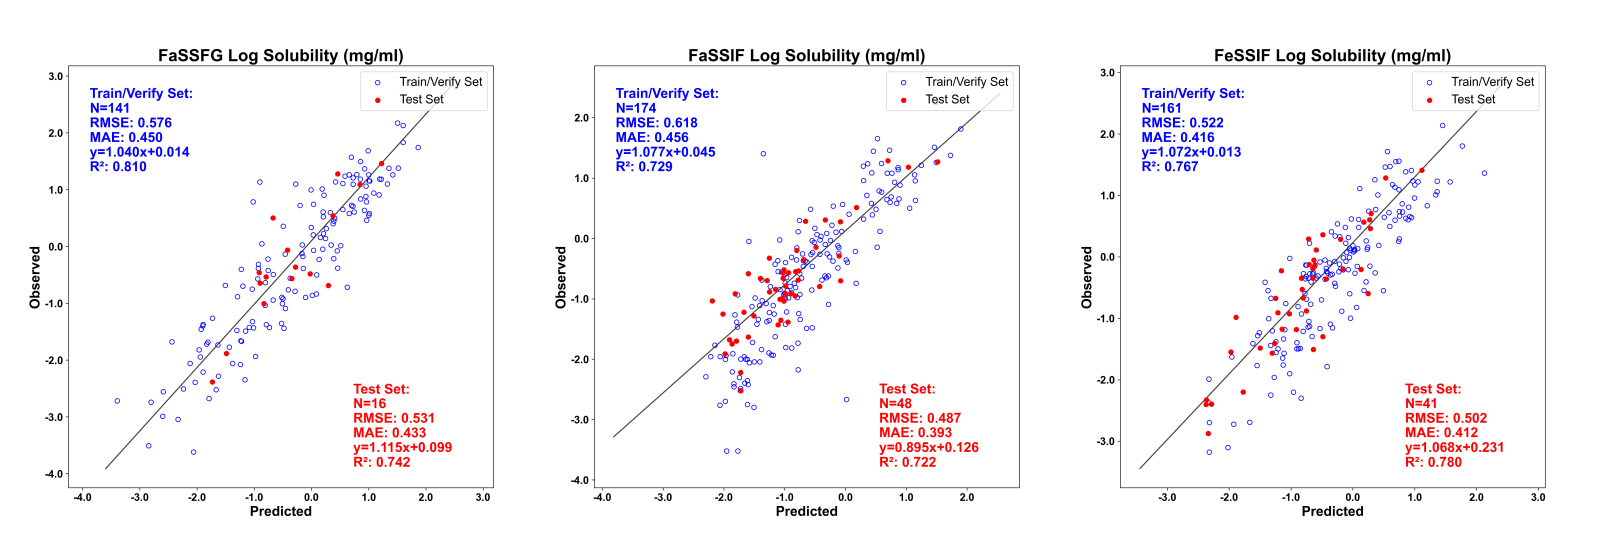
Successful pharmaceutical development requires that drug candidates have adequate solubility to dissolve in the gastrointestinal tract before being excreted. We provide models for predicting solubility in fasted state simulated gastric fluid (S+FaSSGF), in fasted state simulated intestinal fluid (S+FaSSIF), and in fed state simulated intestinal fluid (S+FeSSIF).
In 2011 Simulations Plus underwrote biorelevant solubility determinations in FaSSGF, FaSSIF, and FeSSIF for 160 diverse drug-like compounds. Technical background for the study and experimental details are provided in the chapter on Property Theory and Details. The results obtained are available for purchase from Simulations Plus under the name of “Biorelevant Solubility Database” and underpin our S+FaSSGF, S+FaSSIF, and S+FeSSIF ANNE models. In 2024 S+FaSSIF and S+FeSSIF models were updated using data from publications that have the same experimental conditions (protocol V2 precisely). Data sources: added 103 and 46 compounds to FaSSIF and FeSSIF respectively. All three models take 2D structural information as input and yield predictions for solubility in logarithm scale (mg/mL).
Tendency to supersaturate
A compound’s tendency to form a supersaturated solution is characterized by a supersaturation ratio (SSR) defined as the ratio of its kinetic solubility over its intrinsic solubility:
SSR = Skin/S0
where S0 is the intrinsic solubility, the thermodynamic solubility of a compound in its fully un-ionized free acid or free base form; Skin is the kinetic solubility, the concentration of a compound in solution at the time when an induced precipitate first appears. The intrinsic solubility is measured at equilibrium condition while the kinetic solubility is not. The SupSatn model predicts whether a compound is supersaturating or not using SSR = 1.3 as the threshold value. Data from 131 compounds with measured intrinsic solubility and kinetic solubility from (Box 2008; Llinàs 2008) were used to develop the model.
|
Model |
Set |
Negatives |
Positives |
Total |
Correct |
Concordance |
Sensitivity |
Specificity |
|---|---|---|---|---|---|---|---|---|
|
Supsat |
Training |
29 |
70 |
99 |
94 |
94.9% |
95.7% |
93.1% |
|
Test |
4 |
21 |
25 |
23 |
92.0% |
90.5% |
100% |